I. INTRODUCTION
Recently, one-dimensional (1D) inorganic semiconductor nanostructures with well-defined shapes and morphologies have garnered tremendous interests owing to their promising applications in photonics, nanoelectronics, information storage, catalysis, and biosensors (Simmons et al., Reference Simmons, Li, John, McPherson, Bose, Zhou and He2002; Ye et al., Reference Ye, Meng, Jiang, Wang, Wang and Zhang2002; Tang et al., Reference Tang, Zhou, Zhang, Ou, Jiang, Yu and Qian2005; Sirbuly et al., Reference Sirbuly, Law, Yan and Yang2005; Siqueira et al., Reference Siqueira, Werner, Backer, Poghossian, Zucolotto, Oliveira and Schcning2009). Since versatile morphologies exhibit diverse surface areas and electron states, extensive research revealed that the properties of nanomaterials are strongly related to their morphologies (Chen et al., Reference Chen, Li, Ma, Qin and Chang2001; Zhang and Zhu, Reference Zhang and Zhu2005). However, research on the internal crystalline states of nanomaterials has been relatively limited, though internal crystallinity strongly influences properties such as thermal conductivity and light transmittance. Nanoscale-SiC is unique because of its good physical stability, high thermal conductivity, and high breakdown electric field which makes it a promising candidate for fabrication of nanodevices operated in harsh environment (Seeger et al., Reference Seeger, Kohler-Redlich and Rühle2000; Lo et al., Reference Lo, Das, Hwang, Chen, Hsu, Chen and Chen2003; Xi et al., Reference Xi, Peng, Wan, Li, Yu and Qian2004; Yang et al., Reference Yang, Miao, Xie, Zhang and An2004; Zhang et al., Reference Zhang, Chen, Xie and Yang2010). In this paper, we investigated the crystallinity transformation of β-SiC nanorods at different preparation temperatures using X-ray diffraction (XRD). XRD characterization indicated both enhanced crystallinity and increased yield of products with higher reaction temperature. Scanning electron microscope (SEM) and high-resolution transmission electron microscope (HRTEM) were further used to understand detailed structural information of the SiC nanorods obtained at a specific temperature.
II. EXPERIMENTAL
Typically, the milled Si and SiO2 powders were employed as the starting raw materials, methane as the reactive gas, graphite wafers as the substrates, and FeCl3 was used as the catalyst. The experimental process was described in detail previously (Li et al., Reference Li, Gao, Meng, Geng and Wan2008). The resulting products were then characterized by X-ray diffraction (Rigaku D/max-2400X-ray Diffraction System), field emission scanning electron microscope (JEOL JSM-6, FE-SEM), and JEM-2100 transmission electron microscope (TEM).
III. RESULTS AND DISCUSSION
A series of corresponding XRD patterns of the rod-like nanostructures obtained at different reaction temperatures are shown in Figure 1. As shown in the top XRD patterns of Figure 1, at the low reaction temperature of 1150 °C, only one weak diffraction peak at 60.5°2θ can be assigned to the β-SiC (220) reflections. The top three strongest diffraction peaks of the pattern should be attributed to the graphite substrate. The XRD results indicate that the resulting product has very poor degree of crystallinity. On increasing the reaction temperature to 1200 °C, the SiC (111) and (311) peaks appeared. Compared with the diffraction peaks of graphite substrate, the relative intensity of the diffraction peaks of the SiC nanostructures obtained at 1200 °C becomes stronger than that obtained at 1150 °C. Increasing the reaction temperature to 1230 °C, the SiC (111) peak becomes much sharper and stronger than that of the products obtained at the reaction temperature of 1200 °C. In addition, it can be inferred that the low-intensity peak at 34.5°θ may be aroused by the crystal stacking faults (S.F.) (Meng et al., Reference Meng, Zhang, Gao, Sun and Li2011). The diffraction peaks of the SiC nanostructures obtained by increasing the reaction temperature to 1250 °C are very strong in the XRD pattern shown at the bottom of Figure 1. The major diffraction peaks can be indexed as the (111), (200), (220), and (311) diffraction planes of the cubic β-SiC, respectively, which agreed well with the standard single crystal electron diffraction patterns of β-SiC (JCPDS Card No. 29-1129, unit-cell parameter a = 0.4358 nm). Compared with other peaks, the high intensity of (111) implies that the nanorods obtained at 1250 °C are highly oriented. Otherwise, the narrow and concentrated peaks of the SiC nanorods synthesized at 1250 °C illustrate that the nanostructures have a high degree of crystallinity. It can be deduced that the stacking faults of the nanorods disappear when the temperature was raised to 1250 °C, as indicated on the left partially enlarged detail of the XRD patterns of 1230 and 1250 °C.
XRD patterns taken from SiC nanostructures prepared at different reaction temperatures.

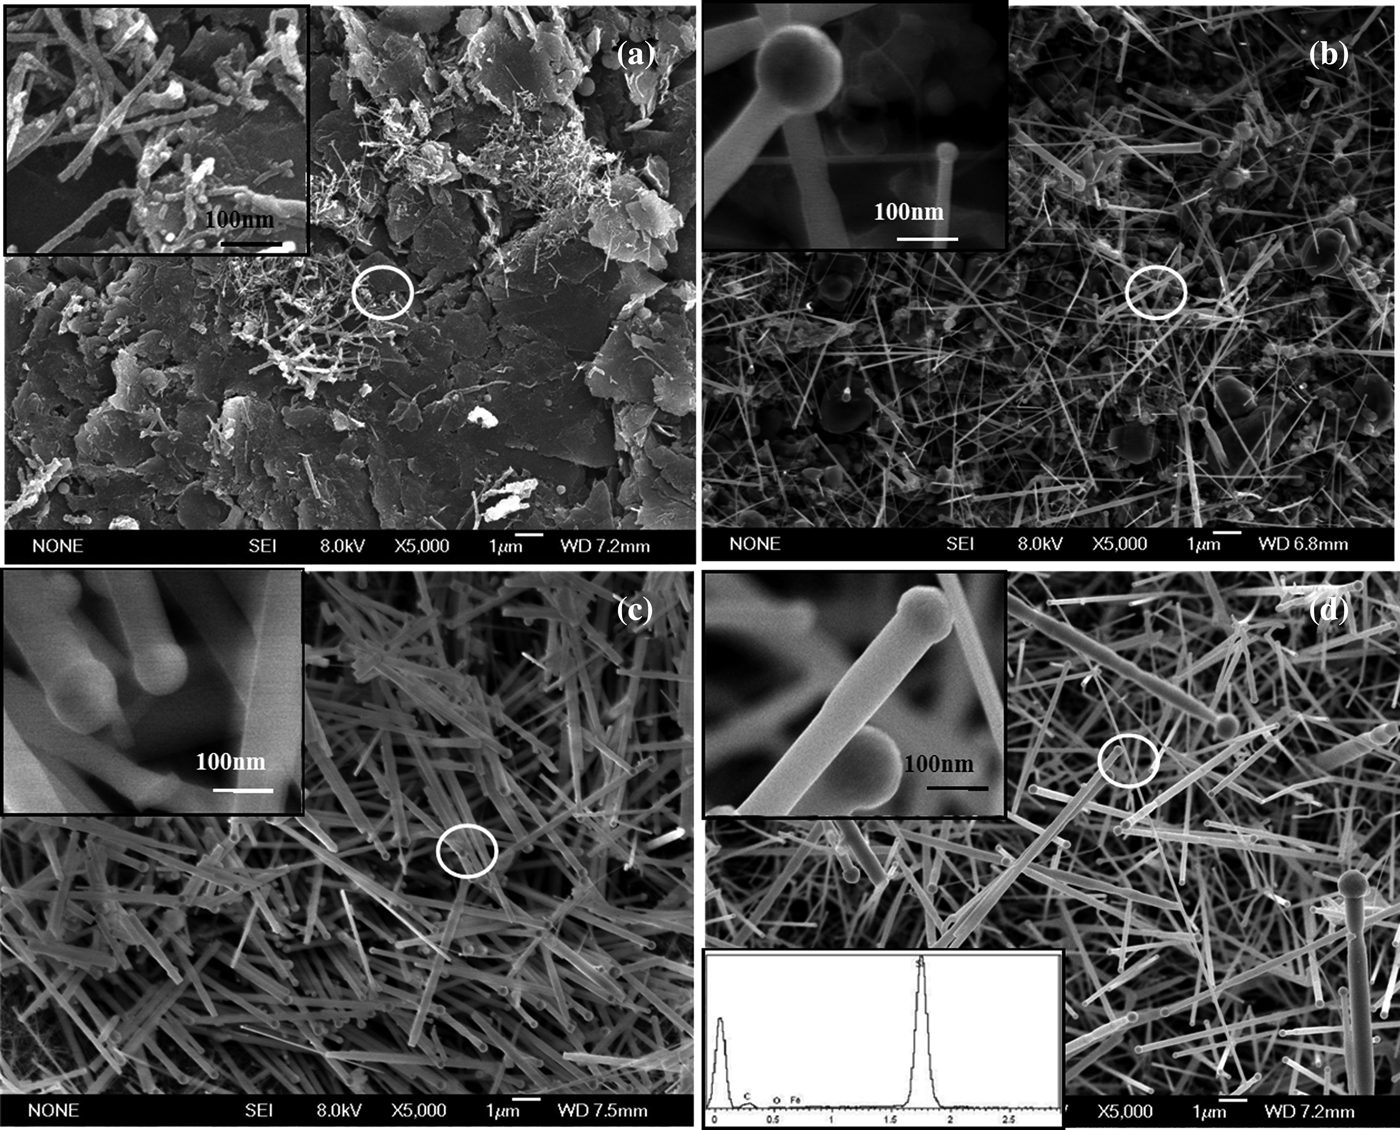
Figure 2 shows FE-SEM images of the resulting β-SiC nanostructures prepared at different reaction temperatures, the top left inserts are the high-magnification SEM images taken from the corresponding circle areas of Figures 2(a)–2(d), respectively. At the reaction temperature of 1150 °C, only a few rod-like products with length up to several microns and diameter about 15 nm were synthesized, and most areas of the substrate exposed, as shown in Figure 2(a). It is obvious that the straight SiC nanorods about 20 µm in length and different diameters ranging from 100 to 200 nm had been prepared at 1200 °C, and catalyst particles were located to the tip of the nanorods, which indicated that the growth process was controlled by the vapor–liquid–solid (VLS) mechanism (Wagner and Ellis, Reference Wagner and Ellis1964), as shown in Figure 2(b). Figure 2(c) indicates that smooth surface and randomly distributed nanorods had been prepared with diameters of about 120 nm. In addition, the yield of the SiC nanorods is higher than that of the product obtained with reaction temperature of 1150 and 1200 °C. Long SiC nanorods with smooth surface in high yield were observed on the graphite substrate, as shown in Figure 2(d), and the major products of the rod-like SiC nanostructures exhibit small sizes with diameters of 60–120 nm, but a spot of SiC nanorods with diameter of 1 µm and length of up to 20 µm also can be found. Notably, Fe particles can be distinctly observed at the tip of the SiC nanorods. The bottom left insert of Figure 2(d) is the corresponding energy dispersive X-ray detector (EDX) spectrum also taken from the circle area which is composed of Si, C, Fe, and O. We assumed that the O element may be aroused by the surface adsorbed oxygen.
SEM images of SiC nanostructures obtained at different temperatures: (a) 1150 °C, (b) 1200 °C, (c) 1230 °C, and (d) 1250 °C. The inserts are the corresponding high-magnification SEM images taken from the circle area in white.
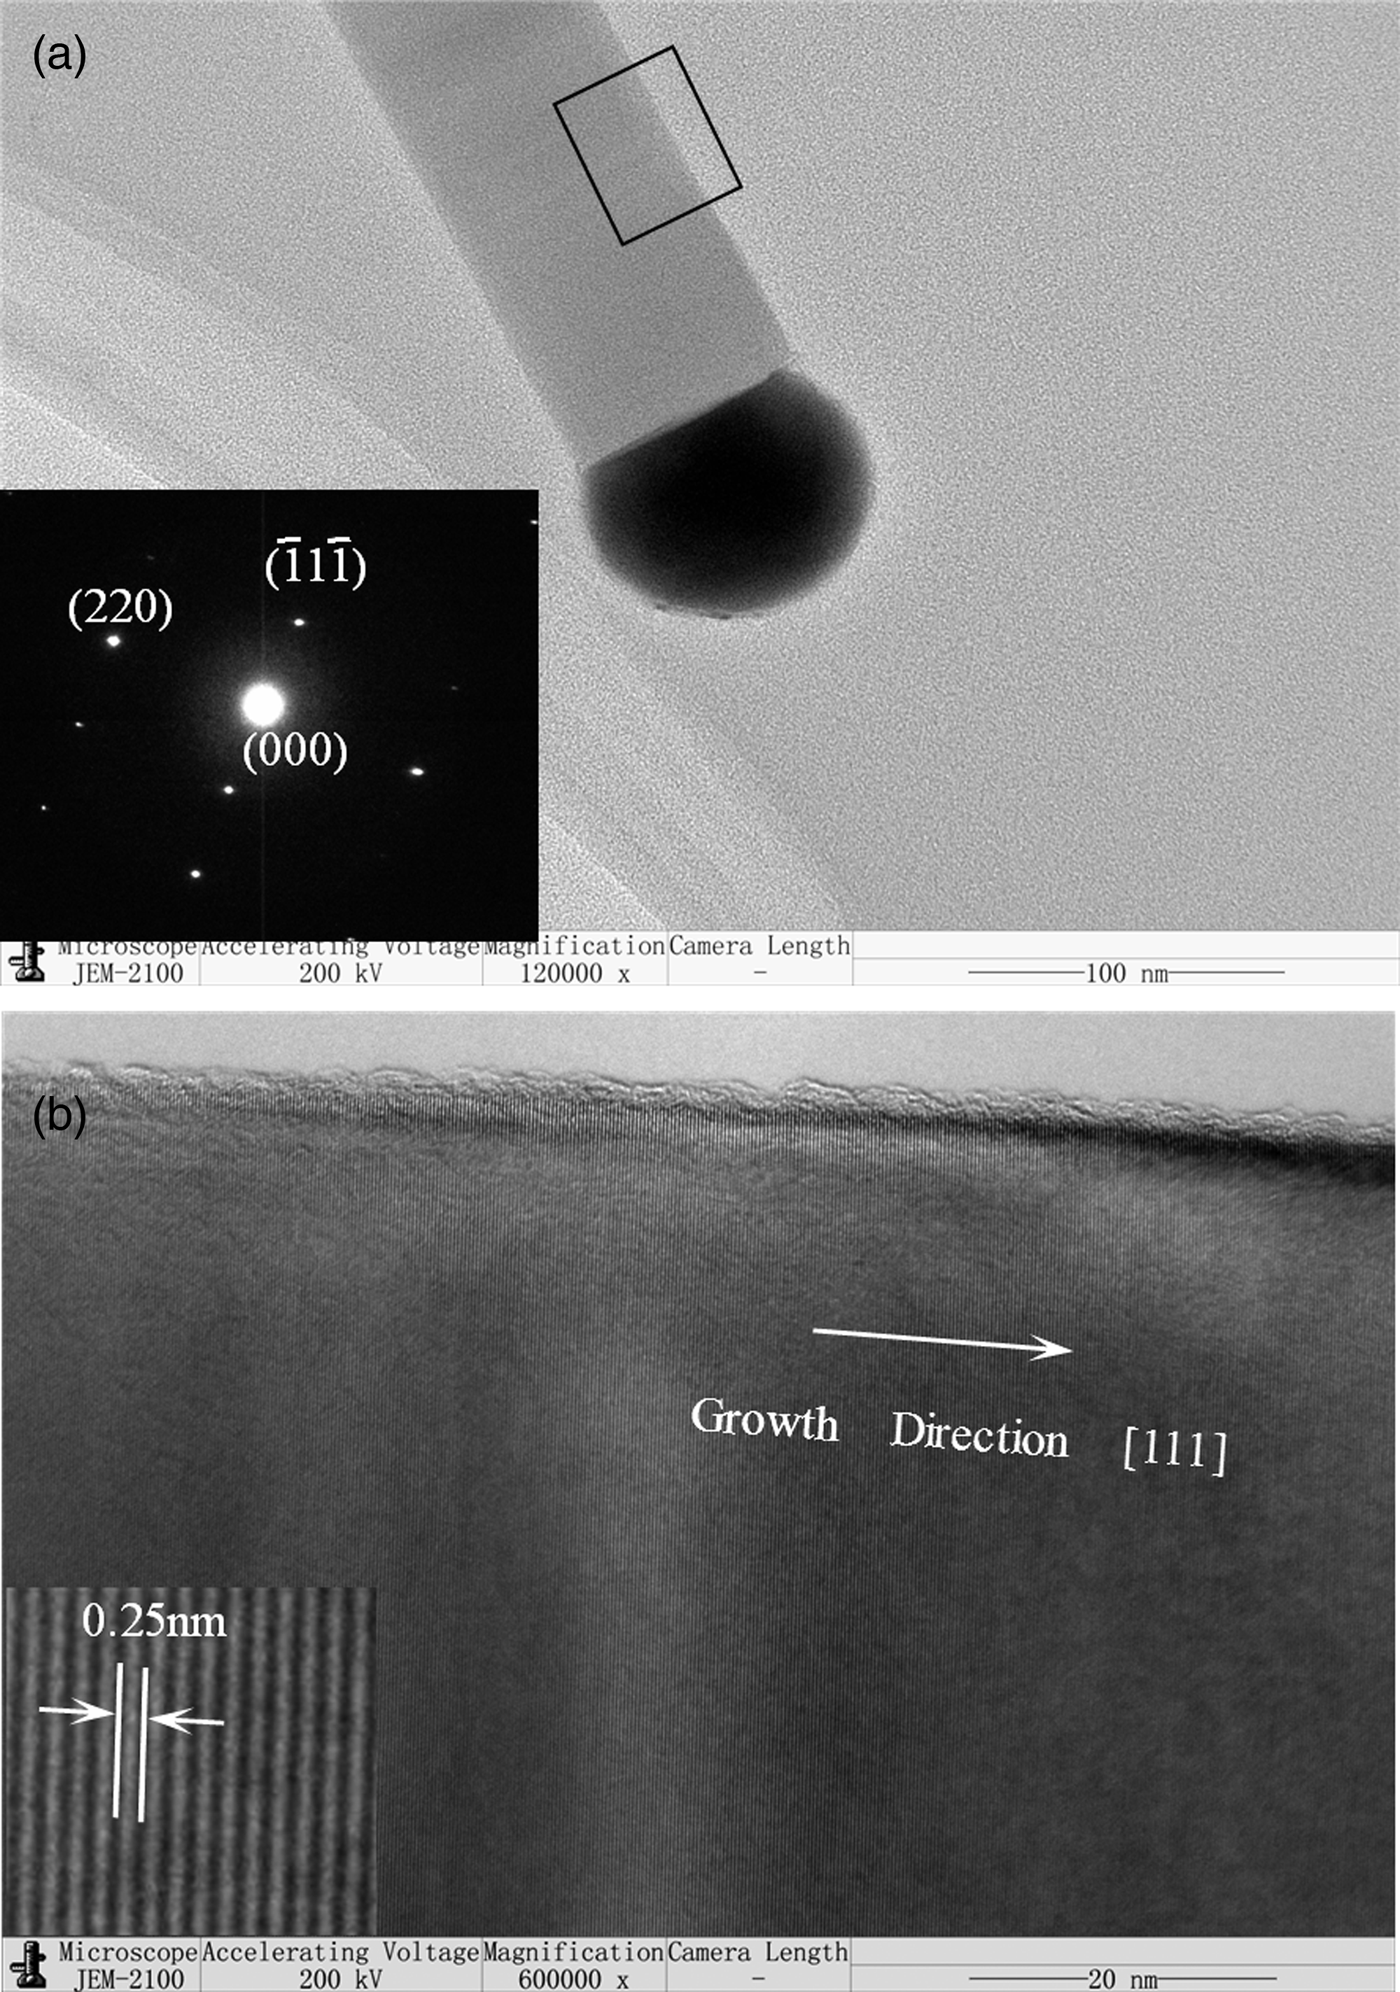
Figure 3(a) shows the TEM image of the resulting products synthesized at 1250 °C, which exhibit a single rod-like structure with a diameter of about 60 nm. It can be observed that the nanorod is just one-layer structure with smooth surface and homogeneous diameter which is different from the reported papers (Meng et al., Reference Meng, Zhang, Gao, Sun and Li2011). The corresponding SAED pattern [bottom left insert; Figure 3(a)] of the nanorod exhibits a row of well-defined spots running parallel to the nanorod growth axis and other spots running nearly normal to the growth axis. The pattern exhibit a single-crystalline character without splitting of the reciprocal lattice reflections structures suggests the obvious high-quality single-crystalline nature of the nanorod, which could also be indexed to the cubic β-SiC structure. The HRTEM image shown in Figure 3(b) taken from the black rectangle area of Figure 3(a), which indicates the growth direction of the nanorod is [111]. Otherwise, it also can be seen from the bottom left insert of Figure 3(b) that the lattice fringe separation is ~0.25 nm for the (111) lattice plane of β-SiC, which is perpendicular to the growth orientation, and in agreement with the SAED and XRD results.
(a) TEM image of SiC nanorods, the insert is the corresponding SAED pattern, and (b) HRTEM image of rectangle area in (a).
The SiC nanorods gradually undergo a series of morphological, yield, and crystalline state evolution with increased reaction temperature from 1150 to 1250 °C. The VLS mechanism is a classical theory to explain the growth process of the nanostructures. Herein, based on the results of the characterization, we believe that the β-SiC nanorods were also controlled by the VLS mechanism (Li et al., Reference Li, Zhang and Meng2011).
IV. CONCLUSION
In summary, the temperature-dependent crystalline state evolution of β-silicon carbide (β-SiC) nanorods prepared under different reaction temperatures via the CVR method was studied, and the structural analysis of the SiC nanorods using XRD, SEM, and TEM was also performed. The result of characterization indicates that the as-synthesized products exhibit increasing crystallinity and yield with increasing reaction temperature. The results on the crystal defects help us to obtain a better understanding of the temperature-dependent crystalline state evolution of SiC nanorods synthesized at different reaction temperatures, which can be beneficial to define the reaction temperature for synthesis and potential application of SiC nanorods.
ACKNOWLEDGEMENTS
This work was supported by the National Natural Science Foundation of China under Grant Nos. 51272117, 50972063, 51172115, the Natural Science Foundation of Shandong Province under Grant Nos. ZR2011EMZ001, ZR2011EMQ011, the Tackling Key Program of Science and Technology in Shandong Province under Grant No. 2012GGX10218, the Innovation Fund of Science and Technology Intensive Small-and-Medium-Sized Enterprises of Ministry of Science and Technology under Grant No. 10C26213712086, and also the Key Technology Major Research Plan in Qingdao under Grant No. 09-1-4-21-gx. We express our grateful thanks to them for their financial support.