1. Introduction
Internal tides are oceanic internal gravity waves that are generated by the flow of an oscillating tidal flow over bottom topography in the presence of density stratification. Some of the internal tide energy is dissipated locally due to small scale turbulence, while a substantial fraction is radiated out. The radiated tidal energy is thought to make a significant contribution to mixing in the ocean interior (Polzin et al.
Reference Polzin, Toole, Ledwell and Schmitt1997; Munk & Wunsch Reference Munk and Wunsch1998; Ledwell et al.
Reference Ledwell, Montgomery, Polzin, Laurent, Schmitt and Toole2000; Wunsch & Ferrari Reference Wunsch and Ferrari2004). One of the mechanisms by which internal tides dissipate energy is through reflection at a continental slope or at isolated topography. Two factors which work in conjunction to make the reflection process an important contributor to the transition from internal tides to turbulence are: (1) continental slopes have substantial regions where the slope angle
 ${\it\beta}$
is close to the critical angle for the semidiurnal internal tide (Cacchione, Pratson & Ogston Reference Cacchione, Pratson and Ogston2002), and (2) near-critical reflection leads to higher wavenumber and velocity amplitude for the reflected wave, enhancing the propensity for nonlinear effects.
When an internal wave reflects off a near-critical sloping bottom, the component of reflected wavenumber in the direction normal to the slope increases. When the slope angle
 ${\it\beta}$
is close to the internal wave characteristic angle
 ${\it\alpha}$
(the situation of critical angle), the energy density of the reflected wave increases leading to high shear and small scale turbulence. This process has been studied theoretically in the frequency domain when
 ${\it\beta}\simeq {\it\alpha}$
(Dauxois & Young Reference Dauxois and Young1999; Scotti Reference Scotti2011). There have been several numerical and experimental studies (DeSilva, Imberger & Ivey Reference DeSilva, Imberger and Ivey1997; Slinn & Riley Reference Slinn and Riley1998a
,Reference Slinn and Riley
b
; Javam, Imberger & Armfield Reference Javam, Imberger and Armfield1999; Tabaei, Akylas & Lamb Reference Tabaei, Akylas and Lamb2005; Rodenborn et al.
Reference Rodenborn, Kiefer, Zhang and Swinney2011; Chalamalla et al.
Reference Chalamalla, Gayen, Scotti and Sarkar2013) exploring the reflection of internal gravity waves. Both shear-driven as well as convective-driven instabilities are found responsible for breakdown from waves to small scale turbulence. Off-critical reflection as a mechanism for nonlinear processes and turbulence have been less studied. In a study of nonlinear effects in reflecting and colliding wave beams by Tabaei et al. (Reference Tabaei, Akylas and Lamb2005), secondary waves with frequencies equal to the sum and difference of the participating wave beams are found. Chalamalla et al. (Reference Chalamalla, Gayen, Scotti and Sarkar2013) found that, when the slope is near to but not exactly critical, wave breaking by larger overturns that are less restrained by the boundary are possible, leading to higher turbulence levels than in the exactly critical case. The objective of the present study is to explore a different mechanism called parametric subharmonic instability (PSI) by which energy can be transferred to smaller vertical scales through generation of subharmonic waves.
An internal wave of frequency
 ${\it\Omega}$
and wave vector
 $\boldsymbol{k}$
, when subjected to PSI decays by transferring energy to two waves of lower frequency, such that
 $\boldsymbol{k}=\boldsymbol{k}_{1}+\boldsymbol{k}_{2}$
and
 ${\it\Omega}={\it\Omega}_{1}+{\it\Omega}_{2}$
. The subharmonic frequencies can be either equal, i.e.
 ${\it\Omega}_{1}={\it\Omega}_{2}=0.5{\it\Omega}$
or unequal, depending on the flow conditions. A finite-amplitude free internal wave is susceptible to PSI through second-order interactions with infinitesimal perturbations as shown by theory (Hasselmann Reference Hasselmann1967; Thorpe Reference Thorpe1968; McEwan Reference McEwan1971), experiment (McEwan Reference McEwan1971; Benielli & Sommeria Reference Benielli and Sommeria1998) and numerical simulation (Koudella & Staquet Reference Koudella and Staquet2006).
There has been much recent interest in the role of PSI related to topographically generated internal tides. Transfer of energy from the internal tide to near-inertial motions with nearly half the fundamental frequency was predicted to be important at near critical latitude (29° N) in numerical simulations by MacKinnon & Winters (Reference MacKinnon and Winters2005). Such transfer of energy at a modest rate was later observed in the ocean by MacKinnon et al. (Reference MacKinnon, Alford, Sun, Pinkel, Zhao and Klymak2013). Carter & Gregg (Reference Carter and Gregg2006) and, more recently, Sun & Pinkel (Reference Sun and Pinkel2013) have documented significant energy transfer from the semidiurnal tide to near-diurnal motions near the Kaena Ridge.
Oceanic internal waves generated at steep topography with near-critical regions have high-mode content that often propagate as so-called internal wave beams. Laboratory and numerical experiments also show internal wave beams radiating off obstacles. The stability of internal wave beams of finite width is of interest. Wave beams have been found to be susceptible to PSI during propagation as in the numerical simulations of generation at a continental shelf break (Gerkema, Staquet & Bouruet-Aubertot Reference Gerkema, Staquet and Bouruet-Aubertot2006) and PSI may help explain the observed transfer of M2 to M1 energy in the vicinity of the Kaena ridge. In laboratory experiments, Clark & Sutherland (Reference Clark and Sutherland2010) found that large-amplitude oscillation of a cylinder led to internal wave beams that break down after a long time. Based on the experimental data, and supporting numerical simulations, the breakdown was attributed to PSI. Recently, Bourget et al. (Reference Bourget, Dauxois, Joubaud and Odier2013) experimentally found PSI of plane wave beams with frequency
 ${\it\Omega}$
that leads to subharmonics with frequencies
 $0.33{\it\Omega}$
and
 $0.67{\it\Omega}$
. Accompanying theoretical analysis of the stability of infinite-width sinusoidal plane waves helped elucidate how the division of subharmonic frequencies and their growth rates depends on frequency, wavenumber and Reynolds number (
 $Re$
) of the fundamental wave. In particular, the subharmonic frequencies were found to move towards
 $0.5{\it\Omega}$
at large
 $Re$
.
Interaction with the upper ocean pycnocline results in beam degradation according to observational studies (Cole et al.
Reference Cole, Rudnick, Hodges and Martin2013; Johnston et al.
Reference Johnston, Rudnick, Carter, Todd and Cole2010). Gayen & Sarkar (Reference Gayen and Sarkar2013) performed several two-dimensional simulations of an internal wave beam of vertical thickness,
 $l_{b}$
, incident on a pycnocline of vertical thickness,
 $l_{p}$
, and found that the refracted beam suffers PSI as long as
 $l_{p}$
was sufficiently large to support the propagation of a vertical wavelength of the resulting subharmonic wave. Increasing the beam
 $Re$
shifted the subharmonic frequencies from (0.3, 0.7) to approximately 0.5 in agreement with the analysis of Bourget et al. (Reference Bourget, Dauxois, Joubaud and Odier2013). There was also a finite-amplitude threshold: PSI was absent when the beam velocity was decreased, i.e. the incident beam Froude number,
 $Fr_{b}=u/Nl_{b}$
, was decreased from 0.035 to 0.015. In a follow-up three-dimensional study (Gayen & Sarkar Reference Gayen and Sarkar2014), the cascade of energy through PSI ultimately to turbulence was demonstrated. Similar to observations, the simulation showed substantial degradation of the beam so that the main reflected wave carried only 30 % of the incident energy. Javam, Imberger & Armfield (Reference Javam, Imberger and Armfield2000) found PSI in a study of caustic reflection (
 ${\it\omega}=N$
) in their two-dimensional numerical experiments. For sufficiently large values of incident wave Keulegan number (degree of nonlinearity), internal waves with frequencies
 $0.3{\it\Omega}$
and
 $0.7{\it\Omega}$
were excited in the reflection region. Zhou & Diamessis (Reference Zhou and Diamessis2013) studied the reflection of an internal wave beam at a free-slip horizontal surface, finding nonlinear effects such as mean currents and harmonics. In addition, PSI was found over long timescales in the subsurface reflected zone.
Recent work has examined the conditions under which the spatially-localized internal wave field of a beam becomes unstable to PSI. Karimi & Akylas (Reference Karimi and Akylas2014) performed an asymptotic analysis for a small-amplitude beam subject to short (relative to the beam width) wavelength instability. It was found that quasi-monochromatic carrier waves that are sinusoidal with a localization envelope can suffer PSI, and an expression for the instability growth rate was derived. Thresholds in both the beam width (number of carrier wavelengths) and beam velocity were identified. Bourget et al. (Reference Bourget, Scolan, Dauxois, Le Bars, Odier and Joubaud2014) also recently examined the role of finite beam width. Their laboratory and numerical experiments showed that beam width and beam amplitude must be sufficiently large for the onset of PSI. An energy-based analysis of the wave–wave interaction helped explain the observed thresholds. As noted by Karimi & Akylas (Reference Karimi and Akylas2014) and Bourget et al. (Reference Bourget, Scolan, Dauxois, Le Bars, Odier and Joubaud2014), thresholds for PSI in beams are present because both the time of interaction (crossing time of a subharmonic wave packet across the beam envelope) and the strength of the quadratic interaction term must be sufficiently large to overcome viscous decay of the subharmonic.
Reflection of an internal wave beam at a solid boundary with slope angle
 ${\it\beta}$
close to the wave propagation angle
 ${\it\alpha}$
substantially increases the wave amplitude and the wavenumber. It is thus possible that an incident internal wave beam of small amplitude that is stable, upon reflection at the solid boundary, leads to a reflected wave beam that is unstable to PSI. We examine this possibility through two-dimensional numerical simulations. The roles of wave amplitude, envelope shape, beam width and Reynolds number are explored and connected with previous results on the stability of localized internal waves. The subsequent evolution of the subharmonic waves (and their energetics) is the focus of this paper. Section 2 of this paper describes the problem set-up; § 3 describes the evolution of PSI; § 4 presents results on the energetics of subharmonic waves; finally, a summary and concluding remarks are given in § 5.
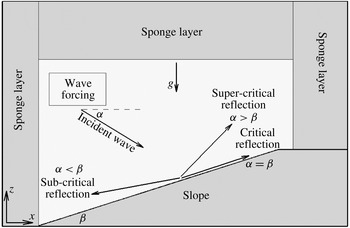
Schematic of the problem showing a uniform slope of angle
 ${\it\beta}$
and an incident wave that propagates at an angle
 ${\it\alpha}$
to the horizontal. The reflected wave is also shown for three different scenarios of incident wave angle relative to slope angle: (1) exactly critical reflection when
 ${\it\alpha}={\it\beta}$
, (2) supercritical reflection when
 ${\it\alpha}>{\it\beta}$
and (3) subcritical reflection when
 ${\it\alpha}<{\it\beta}$
. The wave angle with respect to the vertical is preserved after reflection in all three cases.

2. Formulation of the problem
Navier–Stokes equations under the Boussinesq approximation, and in a non-rotating environment are solved. Internal waves are forced by adding a momentum source to the right-hand side of the vertical velocity equation. The governing equations are shown below:
 $$\begin{eqnarray}\displaystyle & \displaystyle \boldsymbol{{\rm\nabla}}\boldsymbol{\cdot }\boldsymbol{u}=0, & \displaystyle\end{eqnarray}$$
 $$\begin{eqnarray}\displaystyle & \displaystyle \frac{\text{D}u}{\text{D}t}=-\frac{\partial p^{\ast }}{\partial x}+{\it\nu}{\rm\nabla}^{2}u, & \displaystyle\end{eqnarray}$$
 $$\begin{eqnarray}\displaystyle & \displaystyle \frac{\text{D}w}{\text{D}t}=-\frac{\partial p^{\ast }}{\partial z}-\frac{g{\it\rho}^{\ast }}{{\it\rho}_{0}}+{\it\nu}{\rm\nabla}^{2}w+A_{0}\sin ({\it\Omega}t)f(x,z), & \displaystyle\end{eqnarray}$$
 $$\begin{eqnarray}\displaystyle & \displaystyle \frac{\text{D}{\it\rho}^{\ast }}{\text{D}t}={\it\kappa}{\rm\nabla}^{2}{\it\rho}^{\ast }-w\frac{\text{d}{\it\rho}^{b}}{\text{d}z}. & \displaystyle\end{eqnarray}$$
 $\text{d}{\it\rho}^{b}/\text{d}z$
is the background density gradient.
The forcing term
 $f(x,z)$
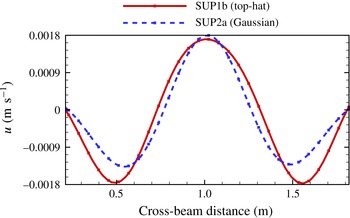
is applied far away from the sloping boundary (see schematic in figure 1) to produce a localized internal wave beam that travels towards the sloping boundary. Two choices are used for the forcing resulting in cross-beam profiles shown in figure 2. Although both profiles have the same carrier wave wavelength and similar widths, the shape of the modulation envelope is different: (a) top-hat with a constant amplitude that has a sharp cutoff to zero outside the beam, and (b) Gaussian. The forcing functions are as follows:
Cross-beam horizontal velocity profile is shown for cases SUP1b (top-hat beam) and SUP2a (Gaussian beam). The forcing parameters are chosen such that the beam width remains the same for Gaussian and top-hat beam profiles.

Top-hat
 $$\begin{eqnarray}f(x,z)=\left\{\begin{array}{@{}ll@{}}\cos k_{x,i}(x-x_{0})\exp (-b_{t}|k_{x,i}(z-z_{0})|^{3})\quad & \text{if }k_{x,i}|x-x_{0}|<n{\rm\pi},\\ 0\quad & \text{otherwise}.\end{array}\right.\end{eqnarray}$$
Gaussian
 $$\begin{eqnarray}f(x,z)=\cos k_{{\it\sigma},i}({\it\sigma}-{\it\sigma}_{0})\exp (-20b_{g}({\it\sigma}-{\it\sigma}_{0})^{2})\exp (-b_{g}(r-r_{0})^{2}).\end{eqnarray}$$
In (2.2) for the top-hat forcing that is centred around
 $(x_{0},z_{0})$
,
 $k_{x,i}$
is the horizontal wavenumber of the carrier wave, the cubic-exponential function of
 $z$
with parameter
 $b_{t}$
localizes the forcing region to a small vertical region, and
 $n$
sets the number of carrier wavelengths in the beam. The forcing, (2.3), has a Gaussian localization of the envelope in both the along-beam coordinate,
 $r=x\cos {\it\alpha}-z\sin {\it\alpha}$
, and the across-beam coordinate,
 ${\it\sigma}=x\sin {\it\alpha}+z\cos {\it\alpha}$
and a carrier wave cross-beam wavenumber
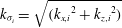 $k_{{\it\sigma}_{i}}=\sqrt{({k_{x,i}}^{2}+{k_{z,i}}^{2})}$
. The parameter,
 $b_{g}$
, is chosen such that the width of the Gaussian beam is the same as the width of the top-hat beam.
The non-dimensional parameters that govern the flow are Reynolds number
 $Re_{i}$
, incoming wave Froude number
 $Fr_{i}$
,
 ${N_{\infty }}^{2}/{\it\Omega}^{2}$
and Prandtl number
 $Pr$
, defined as follows:
 $$\begin{eqnarray}Re_{i}=\frac{u_{i}}{{\it\nu}k_{x,i}},\quad Fr_{i}=\frac{u_{i}k_{x,i}}{{\it\Omega}},\quad \frac{{N_{\infty }}^{2}}{{\it\Omega}^{2}}=-\frac{g}{{\it\rho}_{0}{\it\Omega}^{2}}\frac{\text{d}{\it\rho}^{b}}{\text{d}z},\quad Pr=\frac{{\it\nu}}{{\it\kappa}}.\end{eqnarray}$$
The Froude number
 $Fr_{i}=u_{i}k_{x,i}/{\it\Omega}$
as defined here measures the distance of wave self-advection relative to the wavelength, or fluid velocity relative to wave velocity and thus the nonlinearity of the incoming wave.
The governing equations (2.1) are written in generalized curvilinear coordinates and solved on an body conforming grid. A mixed finite difference/spectral discretization, a third-order Runge–Kutta–Wray time advancement, a fractional step method for the Navier–Stokes equations and a multigrid Poisson solver for the pressure are employed. The numerical algorithm is described by Gayen & Sarkar (Reference Gayen and Sarkar2011). The top, left and right boundaries have Rayleigh damping (sponge layer) to absorb the internal wave energy away from the region of interest. The velocity and scalar fields are relaxed towards the background state in the sponge region by adding damping functions
 $-{\it\sigma}(x,z)[(u,w)]$
and
 $-{\it\sigma}(x,z)[{\it\rho}^{\ast }]$
to the right-hand side of the momentum and scalar equations, respectively. Variable time stepping with a fixed Courant–Friedrichs–Lewy (CFL) number of 0.8 is used. No-slip boundary conditions are imposed at the sloping bottom for
 $u$
,
 $w$
and no-flux boundary condition for the density field.
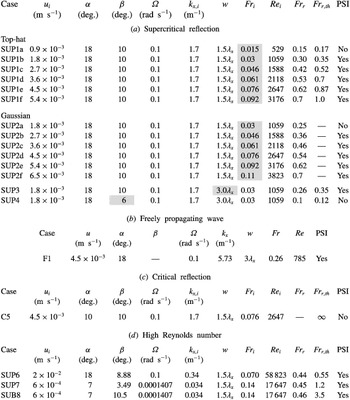
A total of nineteen simulations are performed in this study as shown in table 1. Cases SUP1a-1f (top-hat beam), SUP2a-2f (Gaussian beam) concern supercritical reflection,
 ${\it\alpha}>{\it\beta}$
. The six cases in series SUP1 and six cases in series SUP2 have fixed internal wave angle
 ${\it\alpha}=18^{\circ }$
and fixed slope angle
 ${\it\beta}=10^{\circ }$
, while the incoming wave amplitude (wave Froude number) varies. Case SUP3 with a larger beam width
 $w=3{\it\lambda}_{x}$
, relative to case SUP1b, is simulated to examine if beam width changes the growth rate of subharmonic modes. To study the effect of off-criticality (
 ${\it\alpha}-{\it\beta}$
), SUP4 has been simulated with a shallow slope angle of
 ${\it\beta}=6^{\circ }$
so that the off-criticality (
 $|{\it\alpha}-{\it\beta}|$
) increases to 12°, while all the other parameters remain identical to case SUP3. The parameter which is modified from its preceding case has been highlighted with grey shading in table 1. Case F1 is the simulation of a wave beam having the same characteristics as the reflected wave of case SUP3 that is allowed to propagate freely in the absence of a sloping boundary. Case C5 considers exactly critical reflection with
 ${\it\alpha}={\it\beta}=10^{\circ }$
and
 $Fr_{i}=0.076$
. SUP6 is a supercritical reflection case at high Reynolds number. Finally, to study reflection under oceanic conditions where wave angles are shallower, SUP7 (supercritical reflection,
 ${\it\alpha}>{\it\beta}$
) and SUB8 (subcritical reflection,
 ${\it\alpha}<{\it\beta}$
) are considered with a shallower internal wave angle of 7° and frequency corresponding to the M2 internal tide
 ${\it\Omega}=0.0001407~(\text{rad s}^{-1})$
. In cases SUP6 and SUP7, the slope angle
 ${\it\beta}$
has been chosen such that
 $\sin ({\it\beta})=0.5\sin ({\it\alpha})$
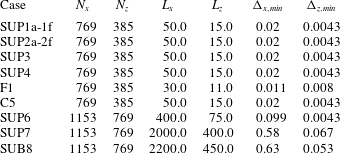
and the reason for choosing this slope angle will be explained in the subsequent sections. All cases have a minimum vertical resolution
 ${\rm\Delta}z_{min}<{\it\delta}_{s}$
, where
 ${\it\delta}_{s}=\sqrt{2{\it\nu}/{\it\Omega}}$
is the Stokes boundary-layer thickness. The smallest vertical wavelength in the instability corresponding to the subharmonic with the shallowest wave angle, e.g. 0.16 m in case SUP1e, is also well resolved by the grid. Table 2 shows grid resolution for all the simulated cases.
Properties of the imposed incident wave (subscript
 $i$
) and the resultant reflected wave (subscript
 $r$
). The beam amplitude,
 $u_{i}$
, is varied in series SUP1 (top-hat beam) and series SUP2 (Gaussian beam). All other cases have top-hat beam profiles. The background stratification is
 $N_{\infty }={\it\Omega}/\sin ({\it\alpha})$
, the kinematic viscosity is
 ${\it\nu}=10^{-6}~\text{m}^{2}~\text{s}^{-1}$
and the Prandtl number is
 $Pr=1$
.

Domain size and grid parameters for the simulated cases. All dimensions are in metres.

3. Results
Simulations start with the generation of waves near the forcing region that travel towards the slope. These incident waves impinge on the slope and reflect forward when
 ${\it\alpha}>{\it\beta}$
or backward when
 ${\it\alpha}<{\it\beta}$
. With decreasing off-criticality angle (
 ${\it\alpha}-{\it\beta}$
), the reflected wave beam has increasing energy density associated with velocity intensification and wavelength reduction after reflection. Linear theory predicts that the Froude number changes upon reflection according to
 $$\begin{eqnarray}Fr_{r,th}=Fr_{i}\left[\frac{\sin ({\it\alpha}+{\it\beta})}{\sin (|{\it\alpha}-{\it\beta}|)}\right]^{2}.\end{eqnarray}$$
Table 1 shows that the reflected beam Froude number,
 $Fr_{r}$
, measured in the simulation increases by almost an order of magnitude for low
 $Fr_{i}$
and agrees well with the theoretical prediction,
 $Fr_{r,th}$
. However, at larger values of
 $Fr_{i}$
, linear theory predictions are not accurate; e.g. table 1 shows that, at
 $Fr_{i}=0.092$
(SUP1f), the theoretical estimate is approximately 1.4 times the actual value of
 $Fr_{r}$
.
At low values of incoming wave Froude number, the reflected wave beam remains stable. A new phenomenon found in this study is the subharmonic instability of the reflected wave beam when its Froude number
 $Fr_{r}$
exceeds a value of approximately 0.3. Details about the instability of the reflected wave beam and the evolution of subharmonic wave energy are discussed in the subsequent sections. To calculate the wavenumbers of reflected and subharmonic waves, a time series of horizontal and vertical line data is extracted and then band-passed around the frequency of interest. The slope of the band-passed space–time diagram gives the horizontal (vertical) phase speed and the horizontal (vertical) wavenumber is then calculated by
 $k_{x}={\it\omega}/c_{p,x}$
,
 $k_{z}={\it\omega}/c_{p,z}$
where
 ${\it\omega}$
,
 $c_{p,x}$
,
 $c_{p,z}$
are the frequency, horizontal and vertical phase speeds, respectively.
3.1. Evolution of subharmonic waves
3.1.1. Laboratory scale simulations
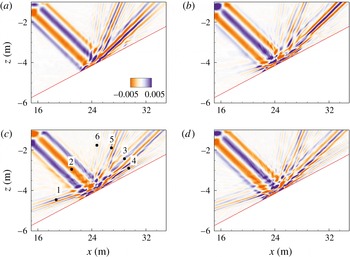
Figure 3(a–d) show contour plots of the horizontal velocity for case SUP1e. Figure 3(a) represents the initial stages of the reflection process with a decreased wavelength and an increased velocity relative to the incident wave. The vertical wavenumber of the primary reflected wave (
 $k_{z,r}=15.0$
) is approximately 2.86 times higher compared to the incident wave (
 $k_{z,i}=5.23$
). Higher harmonics with
 ${\it\omega}=2{\it\Omega}$
and
 $3{\it\Omega}$
are also formed due to nonlinear interactions during the reflection. The second harmonic is evident as the steeper of two reflected beams in figure 3(a) while the even steeper third harmonic is more prominent in the vertical velocity field (not shown here).
Case SUP1e. Contours of horizontal velocity
 $u~(\text{m s}^{-1})$
at various time instances show the evolution of PSI ((a)
 $t=9.0T$
, (b)
 $t=13.85T$
, (c)
 $t=23.4T$
, (d)
 $t=33T$
). The incident beam travels from the upper left towards the slope.

At later time, two internal waves having shallower angles compared to the primary reflected wave emerge from the reflection region. One of them propagates to the left and the other towards the right. At
 $t=23.4T$
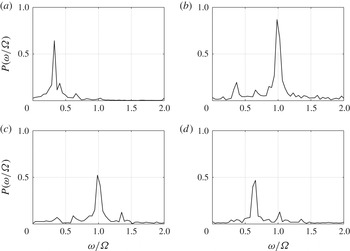
, these two waves are quite evident in the horizontal velocity field shown in figure 3(c). Since these waves have shallower angles, their footprint is weaker in the vertical velocity field (not shown here). Frequency spectra at four different locations 1–4 as specified in figure 3(c) are shown in figure 4. The left traveling subharmonic at location 1 has a peak at a frequency
 $0.33{\it\Omega}$
and the right traveling subharmonic at location 4 has a peak at frequency
 $0.67{\it\Omega}$
, as shown in figure 4. Both, location 2 (incident wave) and 3 (reflected wave) show a peak at the fundamental frequency
 ${\it\Omega}$
. Location 3 representing the reflected wave has additional peaks of substantial strength at the subharmonic frequencies (
 $0.33{\it\Omega}$
,
 $0.67{\it\Omega}$
).
Case SUP1e. Frequency spectra of the horizontal velocity: (a) location 1 (left propagating subharmonic wave
 ${\it\omega}=0.33{\it\Omega}$
), (b) location 2 (incident wave
 ${\it\omega}={\it\Omega}$
), (c) location 3 (reflected wave
 ${\it\omega}={\it\Omega}$
), and (d) location 4 (right propagating subharmonic wave
 ${\it\omega}=0.67{\it\Omega}$
). These locations are shown in figure 3(c).

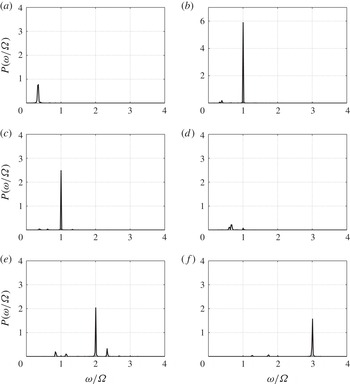
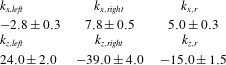
Frequencies of both the subharmonic waves add up to the primary wave frequency, satisfying one of the conditions of PSI. The wave numbers of the two subharmonic waves add up to that of the primary reflected wave, showing that it is the reflected wave and not the incident wave which undergoes the instability. For case SUP1e, the horizontal and vertical wavenumbers of the subharmonic waves are shown in table 3. Both the subharmonic waves have smaller vertical wavelengths compared to the reflected wave. Figure 5 shows kinetic energy spectra at various locations 1–6 that were specified in figure 3(c). Location 2 which represents the incident wave has the highest peak value. Locations 5 and 6 which correspond to superharmonic frequencies also have significant energy with a level comparable to the primary reflected wave (location 3). Another important point to note here is that the left traveling subharmonic mode (location 1,
 $0.33{\it\Omega}$
) has higher energy compared to the right traveling subharmonic mode (location 4,
 $0.67{\it\Omega}$
).
Kinetic energy spectra for case SUP1e compared among various locations: (a) location 1 (left propagating subharmonic wave
 ${\it\omega}=0.33{\it\Omega}$
), (b) location 2 (incident wave
 ${\it\omega}={\it\Omega}$
), (c) location 3 (reflected wave
 ${\it\omega}={\it\Omega}$
), (d) location 4 (right propagating subharmonic wave
 ${\it\omega}=0.67{\it\Omega}$
), (e) location 5 (superharmonic wave of frequency
 ${\it\omega}=2{\it\Omega}$
), and (f) location 6 (superharmonic wave of frequency
 ${\it\omega}=3{\it\Omega}$
). All these locations are shown in figure 3(c).

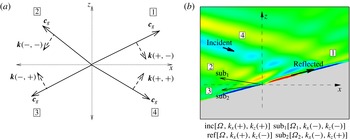
A wave undergoing critical reflection cannot undergo PSI. Panel (a) shows the four quadrants possible for the group velocity vector,
 $\boldsymbol{c}_{g}$
, of internal waves that propagate outward from the origin. The corresponding wavenumber vector,
 $\boldsymbol{k}$
, is also shown with a label where the first entry is the sign of the horizontal component,
 $k_{x}$
, and the second is the sign of the vertical component,
 $k_{z}$
. For example, a wave with
 $\boldsymbol{c}_{g}$
in the first quadrant has
 $k_{x}>0$
and
 $k_{z}<0$
. Panel (b) shows contours of velocity,
 $u$
, in the critical reflection (C5) case with energy propagation (
 $\boldsymbol{c}_{g}$
) directions shown by arrows. The reflected wave propagates in the first quadrant, grazing along the slope. The subharmonic modes (
 ${\it\Omega}_{1},{\it\Omega}_{2}$
) must have shallower angle with respect to the horizontal than the reflected wave and, therefore, are constrained to the second and third quadrants as shown (
 $\text{sub}_{1}$
,
 $\text{sub}_{2}$
). However,
 $k_{x}<0$
for both subharmonics, so that their sum cannot equal the
 $k_{x}>0$
value of the reflected wave.

Case SUP1e. Horizontal and vertical wavenumbers (
 $\text{m}^{-1}$
) of the left and right subharmonic waves add up to the corresponding values of the incident wave.

Case C5, which corresponds to exactly critical reflection, does not show any sign of PSI. The geometry and the requirements of PSI (sum of daughter wave frequencies and wavenumbers are equal to the corresponding values for the primary wave) combine to prevent the possibility of PSI after critical reflection. This is explained by figure 6 and its caption by considering all possible scenarios of subharmonic wave formation for a reflected wave in the critical angle case. Furthermore, the reflected beam becomes increasingly thinner as the slope angle approaches criticality. Although, the number of wavelengths does not change, the viscous boundary layer becomes increasingly important to the dynamics.
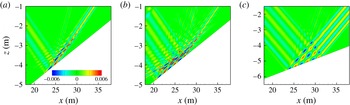
Increasing the beam width for a given value of incoming Froude number allows PSI to become stronger as predicted by Karimi & Akylas (Reference Karimi and Akylas2014). Case SUP3 with an incoming Froude number
 $Fr_{i}=0.03$
and beam width
 $w=3{\it\lambda}_{x}$
exhibits stronger PSI and higher subharmonic energy growth rate when compared to case SUP1b which has the same value of
 $Fr_{i}$
and smaller beam width
 $w=1.5{\it\lambda}_{x}$
. Figure 7 is a comparison of horizontal velocity contours for cases SUP1b, SUP3 and SUP4 at time
 $t=51$
wave cycles. The reflected waves in figure 7(a,b) show signs of PSI, however the amplitude of the subharmonics is larger when the beam width is
 $3{\it\lambda}_{x}$
(figure 7
b) relative to
 $1.5{\it\lambda}_{x}$
(figure 7
a).
Contours of horizontal velocity
 $u~(\text{m s}^{-1})$
for cases SUP1b:
 $w=1.5{\it\lambda}_{x}$
(a), SUP3:
 $w=3{\it\lambda}_{x}$
(b) and SUP4:
 $w=3{\it\lambda}_{x}$
(c) at time
 $t=51T$
. Incident wave Froude number
 $Fr_{i}=0.03$
is same for all three cases. Case SUP3 has twice the beam width of case SUP1b. All parameters are identical between cases SUP3 and SUP4, except the slope angle (SUP3:
 ${\it\beta}=10^{\circ }$
, SUP4:
 ${\it\beta}=6^{\circ }$
).

The slope angle
 ${\it\beta}$
affects the characteristics of the reflected wave and could thereby play a role in PSI, prompting an additional simulation, case SUP4. The incident wave properties of case SUP4 are identical to case SUP3 but the slope has a shallower angle of
 ${\it\beta}=6^{\circ }$
. There is no sign of PSI in case SUP4 over the simulation time of 56 wave cycles as can be inferred from figure 7(c). According to linear theory, (3.1), the nonlinearity (Froude number) of the reflected wave decreases with an increase in the off-criticality (
 ${\it\alpha}-{\it\beta}$
). Table 1 shows that the reflected wave has
 $Fr_{r}=0.1$
in case SUP4 (
 ${\it\alpha}-{\it\beta}=12^{\circ }$
) and
 $Fr_{r}=0.26$
in case SUP3 (
 ${\it\alpha}-{\it\beta}=8^{\circ }$
). Thus, in contrast to the unstable case SUP3, the amplitude of the reflected wave in case SUP4 is not sufficiently large for the wave to undergo PSI.
Numerical simulation is necessary to accurately quantify the reflected wave characteristics. This is clear from table 1 which shows that theory in the case of larger-
 $Fr$
incoming beams overpredicts the reflected wave
 $Fr$
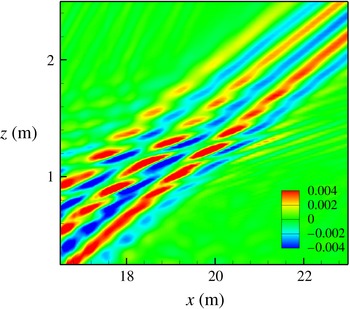
substantially, by as much as 40 % in case SUP1f. Nevertheless, it is of interest to examine if freely propagating beams can give insights into the PSI process. An additional simulation F1 (figure 8) is performed where an internal wave beam (having the same characteristics as the reflected wave of case SUP3) is generated and allowed to propagate freely in the absence of sloping boundary. Similar to the reflected wave in case SUP3, this freely propagating wave also undergoes PSI, bolstering our claim that the subharmonics found in the present reflection problem result from PSI of the reflected wave. Thus, the main role of reflection at the sloping boundary in terms of PSI could be to set the properties of the reflected wave such as wavenumber and amplitude and, thereby, the instability properties. It is however recognized that the reflection problem considered here has other elements, such as the viscous boundary layer, interaction of the propagating subharmonics with the incident, reflected and super harmonic waves, as well as the constraint of a solid boundary which would lead to quantitative differences with the free-beam problem.
Contour of horizontal velocity
 $u~(\text{m s}^{-1})$
for case F1 (
 $w=3{\it\lambda}_{x}$
) at time
 $t=46T$
. A freely propagating wave with the same characteristics as the reflected wave of case SUP3 undergoes PSI as shown in this snapshot.

In the scenario of supercritical internal wave reflection, given the constraints that wavenumbers and frequencies of subharmonic modes should add up to the corresponding values of the primary wave, it is necessary that one of the subharmonic waves propagates in the first quadrant and the other propagates in the third quadrant. This combination was evident for the subharmonic waves of case SUP1e. The reflected wave in case SUP1e undergoes PSI to generate subharmonic waves of frequencies
 $0.33{\it\Omega}$
and
 $0.67{\it\Omega}$
in contrast to the classical example of both subharmonic modes having a frequency
 $0.5{\it\Omega}$
. Equal division of frequencies among the subharmonic modes with
 ${\it\omega}=0.5{\it\Omega}$
implies that each of the two subharmonics (one propagating in the first quadrant and the other in the third quadrant) make the same angle
 ${\it\alpha}_{sub}=0.5\sin ({\it\alpha})$
with the horizontal. This imposes the following geometrical constraint on the slope angle:
 $\sin ({\it\beta})=\sin ({\it\alpha}_{sub})=0.5\sin ({\it\alpha})$
. In other words, equality of subharmonic frequencies requires that the daughter waves graze the slope as they propagate away from the reflected wave. To evaluate this scenario, we have simulated case SUP6 with a slope angle that satisfies
 $\sin ({\it\beta})=0.5\sin ({\it\alpha})$
, and also chosen a higher Reynolds number. However, in spite of satisfying the slope angle constraint and allowing a higher Reynolds number, case SUP6 still shows subharmonic instability with unequal frequency division of
 $0.33{\it\Omega}$
and
 $0.67{\it\Omega}$
. It appears that the proximity of the wall hinders PSI with equal frequency division, perhaps because the wall boundary layer interferes with the formation of a resonant wavenumber triad involving slope-grazing subharmonics by imposing viscous oscillating boundary-layer dynamics.
3.1.2. Large-scale simulations
Two large-scale simulations (cases SUP7 and SUB8) are performed with shallow internal wave angle
 ${\it\alpha}=7^{\circ }$
closer to oceanic conditions and a frequency corresponding to the M2 tide (
 ${\it\Omega}=0.0001407~\text{rad s}^{-1}$
). Rotation of the earth is not considered in these simulations for simplicity. Case SUP7 is supercritical reflection (
 ${\it\alpha}>{\it\beta}$
) and the slope angle
 ${\it\beta}=\sin ^{-1}(0.5\sin {\it\alpha})$
is chosen such that it can accommodate subharmonic waves of frequency
 $0.5{\it\Omega}$
. Case SUB8 is subcritical reflection (
 ${\it\alpha}<{\it\beta}$
) and the slope angle is chosen as 10.5° such that
 $|{\it\alpha}-{\it\beta}|\approx 3.5^{\circ }$
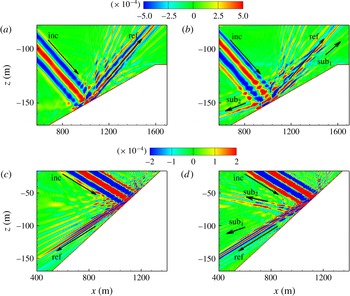
is same for both cases SUP7 and SUB8. Figure 9(a,b) show the horizontal velocity field for supercritical reflection at times
 $t=11.75T$
and
 $t=24T$
, respectively. At time
 $t=11.75T$
, the reflected wave and the superharmonic wave of frequency
 $2{\it\Omega}$
are primarily seen along with the incident wave. At a later time
 $t=24T$
, two subharmonic waves, one propagating towards the left and the other propagating towards the right, are seen. The frequency spectra show that the subharmonic modes have frequencies
 $0.33{\it\Omega}~(\text{sub}_{2})$
and
 $0.67{\it\Omega}~(\text{sub}_{1})$
, similar to the frequency division found in case SUP1e. Figure 9(c,d) show horizontal velocity contours for subcritical reflection (case SUB8) at times
 $t=11.75T$
and
 $t=24T$
. Similar to the case of supercritical reflection, subharmonic modes with frequencies
 $0.33{\it\Omega}$
and
 $0.67{\it\Omega}$
are seen at time
 $t=24T$
. In both these cases, the subharmonic mode with frequency
 $0.33{\it\Omega}~(\text{sub}_{2})$
has higher energy compared to the subharmonic mode of frequency
 $0.67{\it\Omega}~(\text{sub}_{1})$
due to the same reason (discussed for case SUP1e) that the group velocity for
 $\text{sub}_{2}$
is smaller compared to
 $\text{sub}_{1}$
, and thus
 $\text{sub}_{2}$
has more time to interact and extract energy from the reflected wave. A difference to note between the cases of supercritical and subcritical reflection is that, in the supercritical reflection case, both the subharmonic waves make shallower angle with the slope compared to the reflected wave. However, in the subcritical reflection case, both the subharmonic modes make steeper angles with the slope (compared to the reflected wave) and are not spatially constrained by the slope.
Contours of horizontal velocity
 $u$
, (
 $\text{m s}^{-1}$
) for large-scale simulations: case SUP7 (a,b) and SUB8 (c,d) at times
 $t=11.75T$
and
 $t=24T$
.

4. Energetics
Growth rates of subharmonic wave energy
 ${\it\sigma}_{sub}=(1/E_{sub})\text{d}E_{sub}/\text{d}t$
and its cycle evolution is discussed in this section. Area-averaged subharmonic energy per unit mass,
 $$\begin{eqnarray}E_{sub}=\frac{1}{A}\int \left(\frac{1}{2}(u_{sub}^{2}+w_{sub}^{2})+\frac{1}{2}\left(\frac{g{\it\rho}_{sub}^{\ast }}{{\it\rho}_{0}N_{\infty }}\right)^{2}\right)\text{d}A,\end{eqnarray}$$
is calculated in a region surrounding the interaction zone. This area is chosen such that its lateral boundaries are sufficiently far from the interaction region, and the energy flux of subharmonic waves across the boundaries is negligible. Filtered fields
 $u_{sub},w_{sub},{\it\rho}_{sub}^{\ast }$
are obtained by considering a time series data of velocity and density fields at each point inside the chosen region. FFT of time series data is performed and a filter is applied around the desired subharmonic frequency, followed by an inverse Fourier transform. Figure 10(a,b) shows cycle evolution of subharmonic wave energy
 $\text{Log}(E_{sub})$
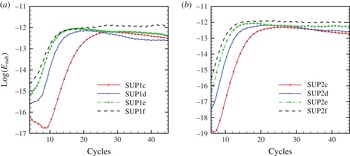
for cases SUP1c-1f and SUP2c-2f, respectively.
Cycle evolution of area-averaged subharmonic energy
 $(\text{kinetic}+\text{potential})$
for (a) top-hat beam (cases SUP1c-1f), (b) Gaussian beam (cases SUP2c-2f).

As time progresses, the subharmonic wave energy increases exponentially for all cases and a quasi-steady state with approximately constant energy is reached. The time at which the subharmonic wave energy reaches its peak value varies among the cases. When the reflected wave Froude number,
 $Fr_{r}$
, increases from SUP1c-f, the time to attain the peak value decreases for the top-hat beams as shown by figure 10(a). A similar trend is found for Gaussian wave beams (figure 10
b). In total, the available incident wave energy is distributed among various frequencies including primary reflected wave, superharmonic and subharmonic frequencies with a fraction of the energy also going into viscous dissipation near the reflection region.
The subharmonic growth rates in the simulations show a dependence on the reflected wave Froude number,
 $Fr_{r}$
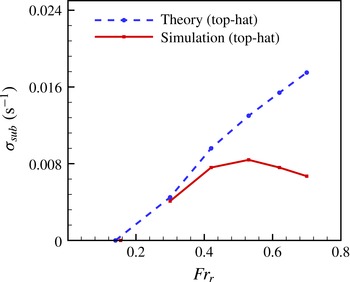
. It is of interest to place the results in the context of finite beam-width asymptotic theory (Karimi & Akylas Reference Karimi and Akylas2014) even though the assumptions of the analysis, namely, small amplitude beam and short wavelength subharmonics do not strictly apply. Details about the calculation of theoretical growth rates are given in the appendix A. Figure 11 compares growth rates for cases SUP1a-1f against theory.
Subharmonic energy growth rates as a function of reflected beam amplitude (Froude number) compared between present simulations and theory of Karimi & Akylas (Reference Karimi and Akylas2014) for a series with top-hat beam profile (series SUP1a-1f).

We start with consideration of the critical value of
 $Fr_{r}$
for onset of PSI. For a given wave of frequency
 ${\it\Omega}$
, wavenumber
 $k$
, and beam envelope (whether top-hat or Gaussian) in a fluid of given viscosity, the critical value of
 $Fr_{r}$
depends on the frequency of the subharmonic wave and the number of carrier wavelengths. As shown in figure 11, the theoretical critical value of
 $Fr_{r}$
for a top-hat wave beam with 1.5 carrier wavelengths to generate a subharmonic with
 $0.5{\it\Omega}$
is
 ${\approx}0.145$
. Now, according to the simulations, case SUP1a with reflected wave Froude number 0.15 does not undergo PSI while case SUP1b with
 $Fr_{r}=0.3$
does show PSI. Case SUP2a (Gaussian envelope) with
 $Fr_{r}=0.25$
does not exhibit PSI. Therefore, we infer that the critical Froude number for the reflected wave beam to undergo PSI in the simulations is 0.25–0.3, which is somewhat higher than the value 0.15 predicted by Karimi & Akylas (Reference Karimi and Akylas2014). However, it is important to note that the subharmonic frequencies obtained in the simulation are
 $0.33{\it\Omega}$
and
 $0.67{\it\Omega}$
in contrast to subharmonic frequency
 ${\it\Omega}_{sub}\approx 0.5{\it\Omega}$
considered by Karimi & Akylas (Reference Karimi and Akylas2014).
We now turn to the magnitude of the subharmonic growth rates,
 ${\it\sigma}_{sub}$
. At low values of
 $Fr_{r}$
, the theoretical values of
 ${\it\sigma}_{sub}$
agree well with the simulation values as shown in figure 11. When
 $Fr_{r}>0.5$
,
 ${\it\sigma}_{sub}$
saturates at a value
 ${\approx}0.008~\text{s}^{-1}$
, whereas theory predicts a continuing linear increase with increasing
 $Fr_{r}$
, thus surpassing the simulation growth rates at high
 $Fr_{r}$
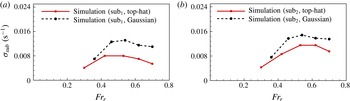
. Figure 12(a,b) compares subharmonic growth rates between top-hat (SUP1) and Gaussian (SUP2) beam profiles. There is no qualitative difference with the top-hat beam;
 ${\it\sigma}_{sub}$
increases with
 $Fr_{r}$
for low values and then saturates for the Gaussian profile also. A quantitative difference is that
 ${\it\sigma}_{sub}$
is higher for the Gaussian relative to the top-hat beam at all values of
 $Fr_{r}$
. It is worth noting that Karimi & Akylas (Reference Karimi and Akylas2014) predict that the threshold value of
 $Fr_{r}$
for the onset of PSI is smaller for the Gaussian beam profile consistent with a Gaussian beam being more unstable than the top-hat. The value of
 ${\it\sigma}_{sub}$
for the left-traveling subharmonic mode (
 $\text{sub}_{2}$
) is always higher relative to
 $\text{sub}_{1}$
. The reason is that
 $\text{sub}_{2}$
has smaller group velocity compared to
 $\text{sub}_{1}$
, has longer time to interact with the reflected wave and is, therefore, able to extract more energy.
Comparison of subharmonic energy growth rates computed from the simulations between top-hat (cases SUP1b-1f) and Gaussian beams (cases SUP2b-2f).

The effect of beam width on the subharmonic energy growth rate is evaluated by doubling the beam width (compare cases SUP1b and SUP3). Theory and experiments predict that increasing the beam width, i.e. the number of carrier wavelengths, increases the growth rate. Our simulations are consistent with this prediction. Case SUP1b, with beam width
 $1.5{\it\lambda}_{x}$
, has
 ${\it\sigma}_{sub}\approx 0.0042~\text{s}^{-1}$
, whereas SUP3 with beam width
 $3{\it\lambda}_{x}$
has
 ${\it\sigma}_{sub}\approx 0.0057~\text{s}^{-1}$
.
5. Discussion and conclusions
Through numerical simulations, we demonstrate that a stable propagating internal wave beam with small amplitude, upon reflection, leads to a reflected beam that can become unstable to PSI. Supercritical, critical and subcritical reflection with reflected wave angle larger, equal, and smaller, respectively, relative to the slope angle are simulated. Two different beam envelopes, top-hat and Gaussian, are considered. When the off-criticality (
 ${\it\alpha}-{\it\beta}$
) is small-to-moderate (e.g. 8° for wave propagation angle of 18° and 3.5° for wave propagation angle of 7°), the velocity of the reflected wave increases and the wavelength reduces such that the intensification of the reflected wave Froude number,
 $Fr_{r}=uk_{x}/{\it\Omega}$
, with respect to the incoming wave value, is sufficient for PSI. Linear theory is able to predict the intensification for small values of beam amplitude, but substantially overpredicts
 $Fr_{r}$
for larger values. PSI is found in several of the simulated cases. For example, consider case SUP1e where the beam has an incoming
 $Fr_{i}=0.076$
and a width of 1.5 wavelengths. At
 $t>12T$
(figure 3) subharmonic modes emanate from the reflection region. The left traveling wave has a frequency
 $0.33{\it\Omega}$
and the right traveling wave has a frequency
 $0.67{\it\Omega}$
, adding up to the primary wave frequency. Both the horizontal and vertical wavenumbers of the subharmonic modes add up to the corresponding quantities of the primary reflected wave showing that it is the reflected wave that undergoes the instability.
Off-criticality (
 ${\it\alpha}-{\it\beta}$
) has a non-monotone effect on PSI. Decreasing off-criticality to zero suppresses PSI. The critical reflection (
 ${\it\alpha}={\it\beta}$
) case C5 with parameters identical to case SUP1e does not show any signs of subharmonic instability. As shown in figure 6, the geometrical constraint due to the sloping bottom does not allow subharmonic modes (propagate with shallower angles than the fundamental) in quadrants 1 and 4, and the resonant wavenumber criterion for PSI does not allow subharmonic modes in quadrants 2 and 3. Thus, PSI of a critically reflected wave is suppressed. However, increasing the off-criticality (
 ${\it\alpha}-{\it\beta}$
) can be anticipated to weaken the reflected wave
 $Fr$
based on the linear theory result, (3.1). Indeed, increasing the off-criticality to 12° (SUP4) from 8° (SUP3) by changing the slope angle, keeping all other parameters fixed, decreased the value of
 $Fr_{r}$
sufficiently to suppress PSI.
PSI of the internal wave beam is found to depend on the incoming wave amplitude in series SUP1a-1f where the incoming beam amplitude is systematically varied, keeping all other parameters constant. In all cases exhibiting PSI, the subharmonic energy increases exponentially until it saturates to a nearly constant value. Subharmonic growth rates in the exponential-growth stage have been computed and compared against the theory of Karimi & Akylas (Reference Karimi and Akylas2014), based on asymptotically small beam amplitude and short subharmonic instability wave, for a freely propagating internal wave beam. For a given configuration (internal wave angle 18° and beam width
 $1.5{\it\lambda}_{x}$
), PSI of the reflected wave is found in the simulations when
 $Fr_{r}\geqslant 0.3$
, but PSI is not found for
 $Fr_{r}=0.15$
. For
 $0.3\leqslant Fr_{r}<0.5$
, the theoretical estimates of growth rate are close to the simulation values. However, for
 $Fr_{r}>0.5$
, the subharmonic growth rates obtained from the simulation data remains more or less constant, whereas the theoretical growth rates continue to increase linearly with
 $Fr_{r}$
. The reason is that, in the simulations with high
 $Fr_{r}$
, energy transfer to smaller scales becomes increasingly important and viscosity effectively dissipates energy at these scales. According to theory, increasing either the beam width or the internal wave angle (keeping the Froude number constant) increases the subharmonic growth rate. Thus, the threshold Froude number to undergo PSI is expected to be lower for wider and steeper internal wave beams. To study the effect of the beam width, case SUP3 is performed at an incoming wave Froude number
 $Fr_{i}=0.03$
identical to SUP1b and a larger beam width of
 $3{\it\lambda}_{x}$
relative to
 $1.5{\it\lambda}_{x}$
. Increasing the beam width from 1.5 to 3 carrier wavelengths is found to increase the growth rate by approximately a factor of 1.4. This result is consistent with the predictions by Karimi & Akylas (Reference Karimi and Akylas2014), however, a future parametric study that varies beam angle and beam width for given slope angle and compares the variation of critical
 $Fr_{r}$
with theory is desirable.
Varying the shape of the beam envelope, keeping all the other parameters identical, does not qualitatively change the effect of beam amplitude. However, there is a quantitative effect on the subharmonic growth rates. As shown in figure 12(b), the Gaussian beam has higher subharmonic growth rate compared to the top-hat beam for a given value of
 $Fr_{r}$
. This result is consistent with the result of Karimi & Akylas (Reference Karimi and Akylas2014) that the Gaussian beam is more susceptible to PSI compared to the top-hat beam.
From the preceding discussion, we conclude that higher-amplitude and wider incoming beams lead to reflected waves that are more prone to subharmonic instability. There is also a threshold for incoming beam amplitude for onset of PSI. These conclusions are consistent with the findings of Bourget et al. (Reference Bourget, Scolan, Dauxois, Le Bars, Odier and Joubaud2014) and Karimi & Akylas (Reference Karimi and Akylas2014) in the case of freely-propagating wave beams. The values of the subharmonic growth rate in the simulations lie in the range,
 $0.004<{\it\sigma}_{sub}<0.014~\text{s}^{-1}$
translating to 0.25–0.875 per cycle of the fundamental wave. These values are comparable to PSI growth rates in previous work.
Unlike Bourget et al. (Reference Bourget, Dauxois, Joubaud and Odier2013) and Gayen & Sarkar (Reference Gayen and Sarkar2013), increasing the Reynolds number (case SUP6) does not change the unequal frequency division among the subharmonic modes towards
 ${\it\Omega}_{sub}=0.5$
. Cases SUP7 and SUB8 with internal wave angle
 ${\it\alpha}=7^{\circ }$
and frequency corresponding to the M2 tide are performed to study reflection under more realistic oceanic conditions. Both these cases exhibit PSI with subharmonic frequencies
 $0.33{\it\Omega}$
and
 $0.67{\it\Omega}$
, similar to low Reynolds number simulations SUP1b-1f. In the case of supercritical reflection (case SUP7), the subharmonic frequency of
 $0.5{\it\Omega}$
is possible only when both the subharmonic waves move along the slope with one daughter wave moving upslope in the first quadrant and the other daughter wave moving downslope in the third quadrant, and both waves grazing the slope. There are no boundary related constraints for equal-frequency subharmonics in the subharmonic case SUB8. However, equal division of subharmonic frequencies into
 $0.5{\it\Omega}$
is absent in both cases SUP7 and SUB8 although the Reynolds number (
 $Re_{i}=u_{i}/(k_{x,i}{\it\nu})$
) is approximately 7 times larger compared to case SUP1e. It is possible that equal division of frequency in the reflection problem could occur at even higher values of
 $Re$
.
In all the simulated cases which exhibit PSI, instability of the reflected wave is initiated near its generation region at the slope because the reflected wave is strongest near its origin. As the reflected wave becomes unstable near the generation region and looses energy to subharmonic modes, it becomes weaker as it travels away from the generation region. Therefore, although at a later time the reflected wave undergoes subharmonic instability away from its generation region, the instability is not as strong as it is near the reflection zone.
The present study identifies off-critical internal wave reflection as a mechanism for nonlinear cascade of internal waves to waves of smaller vertical scale through parametric subharmonic instability. In the future, three-dimensional turbulence resolving simulations of internal wave beam reflection will be helpful to quantify the contribution of subharmonic modes to the turbulent dissipation at the bottom boundary.
Acknowledgements
We are grateful for the support of ONR grant N00014-11-1-0512 (programme manager Dr T. Paluszkiewicz).
Appendix A. Calculation of theoretical growth rates
Theoretical growth rates that are employed for comparison in this paper are calculated from the results reported in Karimi & Akylas (Reference Karimi and Akylas2014) (hereafter referred to as KA). Several non-dimensional parameters introduced by KA as part of the analysis are defined below, followed by the expression used by us to compute the dimensional subharmonic growth rate. All the dimensional quantities in the following discussion are denoted by the superscript
 $\ast$
.
The characteristic length scale of the reflected wave beam is defined as
 $$\begin{eqnarray}L^{\ast }=1/k_{ref}^{\ast },\end{eqnarray}$$
where
 $k_{ref}^{\ast }$
is the wavenumber of the reflected beam measured from the simulation data. The time scale used by KA for non-dimensionalization is given by
 $1/N^{\ast }$
, where
 $N^{\ast }$
is the buoyancy frequency. The wave amplitude parameter (also measures the degree of nonlinearity) is given by
 $$\begin{eqnarray}{\it\epsilon}=Fr/\cos {\it\alpha},\end{eqnarray}$$
where
 ${\it\alpha}$
is the angle that the group velocity vector of the reflected wave makes with the horizontal and
 $Fr=u^{\ast }{k^{\ast }}_{x}/{\it\Omega}^{\ast }$
is the Froude number of the wave (reflected wave in the simulation) undergoing PSI. The scaled beam width is given by
 $D=2{\rm\pi}N_{w}{\it\epsilon}^{1/2}$
, where
 $N_{w}$
is the number of wavelengths of the reflected wave.
The non-dimensional growth rate
 ${\it\lambda}_{r}$
(real part of the complex eigenvalue) as defined in (4.12) of KA is given by
 $$\begin{eqnarray}{\it\lambda}_{r}={\it\gamma}\frac{\hat{{\it\lambda}}_{r}}{\hat{k}}-\frac{\tilde{{\it\nu}}c^{2}}{D^{2}{\it\gamma}^{2}}\hat{k}^{2},\end{eqnarray}$$
where
 $\hat{{\it\lambda}}(\hat{k})$
is obtained by solution of a characteristic equation.
Here, the parameter
 $\tilde{{\it\nu}}$
(denoted by
 ${\it\alpha}$
in KA) is a non-dimensional viscosity,
 $$\begin{eqnarray}\tilde{{\it\nu}}=\frac{{\it\nu}^{\ast }}{2N^{\ast }{L^{\ast }}^{2}{\it\epsilon}^{2}},\end{eqnarray}$$
and
 ${\it\gamma}=\sin {\it\chi}\cos ^{2}({\it\chi}/2)$
, where
 ${\it\chi}={\it\alpha}-{\it\alpha}_{sub}$
and
 ${\it\alpha}_{sub}$
is the angle made by the subharmonic group velocity vector with the horizontal. The relation between
 ${\it\alpha}$
and
 ${\it\alpha}_{sub}$
is given by
 $\sin {\it\alpha}/\sin {\it\alpha}_{sub}={\it\Omega}/{\it\Omega}_{sub}$
, where
 ${\it\Omega}={\it\Omega}^{\ast }/N^{\ast }$
is the non-dimensional reflected wave frequency and
 ${\it\Omega}_{sub}$
is the non-dimensional subharmonic wave frequency. The non-dimensional group velocity is
 $c={\it\Omega}_{sub}(2-\text{cos}\,{\it\chi})$
and the non-dimensional subharmonic wavenumber is
 $$\begin{eqnarray}k_{sub}=L^{\ast }k_{sub}^{\ast },\end{eqnarray}$$
where
 $k_{sub}^{\ast }$
is the average of left and right subharmonic wavenumbers measured from the simulation data. The subharmonic frequencies (
 ${\it\Omega}_{1}$
and
 ${\it\Omega}_{2}$
) are unequal in the simulation in contrast to
 ${\it\Omega}_{sub}\approx {\it\Omega}/2$
assumed by KA. In order to compare with theory, we employ the average frequency,
 ${\it\Omega}_{sub}=({\it\Omega}_{1}+{\it\Omega}_{2})/2$
, which also equals
 ${\it\Omega}/2$
.
Solving the eigenvalue problem for a given beam envelope (top-hat is chosen in this paper for comparison) gives
 $\hat{{\it\lambda}}(\hat{k})$
, which is plotted in figure 3 of KA. Two asymptotic limits are discussed, one near the bifurcation point
 $\hat{k}=\hat{k}_{c}^{(0)}(=\,{\rm\pi})$
and the other when
 $\hat{k}\gg \hat{k}_{c}^{(0)}$
. The solution
 $\hat{{\it\lambda}}(\hat{k})$
in these two asymptotic limits is given by (5.7) and (5.8) of KA, respectively. The value
 $\hat{k}$
obtained from the simulation data is found to be in the range
 $2{\rm\pi}{-}6{\rm\pi}$
for cases SUP1b-1f, and all these values are within the range
 $\hat{k}_{l}<\hat{k}<\hat{k}_{u}$
as predicted by KA. Since the slope of the curve
 $\hat{{\it\lambda}}^{(0)}(\hat{k})$
(shown in figure 3 of KA) changes rapidly near the bifurcation point and remains nearly constant thereafter, and also the
 $\hat{k}$
values obtained from the simulation data for cases SUP1b-1f are always greater than
 $\hat{k}_{c}^{(0)}$
, we employ (5.8) of KA in the asymptotic limit
 $\hat{k}\gg \hat{k}_{c}^{(0)}$
. Thus, we obtain
 $\hat{{\it\lambda}}^{(0)}=\hat{k}/2$
.
Since KA define
 $\hat{k}=({\it\gamma}D/c)k$
and the maximal instability growth rate is
 $\hat{{\it\lambda}}_{r}=\hat{{\it\lambda}}^{(0)}=\hat{k}/2$
, (A 3) leads to the following non-dimensional expression for the subharmonic growth rate:
 $$\begin{eqnarray}{\it\lambda}_{r}=\frac{{\it\gamma}}{2}-\tilde{{\it\nu}}k_{sub}^{2}.\end{eqnarray}$$
Finally, the dimensional subharmonic growth rate is given by
 ${\it\epsilon}N^{\ast }{\it\lambda}_{r}$
.