Residents of the US Gulf Coast region have experienced a number of recent disasters that have affected their health and well-being. Hurricanes are an annual threat, but the region’s reliance upon the oil and gas industries manufactures other, less predictable disasters, such as oil spills (often referred to as one of the different types of technological disasters).Reference Robertson and Krauss1 Beginning on April 20, 2010, and lasting for over 3 months, the breached Deepwater Horizon wellhead unleashed nearly 5 million barrels of oil into the Gulf of Mexico.Reference Robertson and Krauss1 In the wake of the Deepwater Horizon oil spill (DHOS), significant efforts were made to document the affected communities’ behavioral and mental health.2 With population-level data both prior to and 8 to 20 months after the DHOS, the Centers for Disease Control and Prevention (CDC) and Substance Abuse and Mental Health Services Administration (SAMHSA) uncovered “modest or minimal” 3(p6) changes specific to the region; most notably, illicit drug and marijuana use increased among those ages 12 years and older (illicit drug: 7.1% to 9.7%; marijuana: 4.7% to 7.3%), as did the proportion of respondents reporting having made suicide plans (0.5% to 1.2%).Reference Gould, Teich and Pemberton3 Although other studies have used probability-based sampling strategies,Reference Osofsky, Osofsky and Hansel4, Reference Rung, Gaston and Oral5 the CDC/SAMHSA study uses representative estimates of the region both before and after the onset of the DHOS to examine the effects of the DHOS.
The CDC/SAMHSA study built upon existing research related to health and social well-being after oil spills. Many such studies are cross-sectional, with assessments occurring weeks to months after the spill. One consistent finding in this area of research is that, across contexts, resource loss attributed to oil spills is associated with adverse mental/behavioral health outcomes.Reference Arata, Picou, Johnson and McNally6–Reference Palinkas, Petterson, Russell and Downs15 In the CDC/SAMHSA study, self-reported decreased income attributed to the spill was associated with frequent mental distress, and losing a job and decreased income attributed to the spill was associated with depression.Reference Fan, Prescott and Zhao16 In a study of Louisiana coastal parish residents, life disruption resulting from the oil spill was correlated with posttraumatic stress disorder symptoms,Reference Osofsky, Osofsky and Hansel4 and, in a study of women in Louisiana coastal parishes, bodily exposure to the spill was correlated with both overall poor mental health and depression symptoms.Reference Rung, Gaston and Oral5 Such disruptions were also a common theme raised in focus groups among mental health care professionals in Alabama after the spill, indicating that oil-spill-related disruptions are thought to be relevant to health outcomes.Reference Werner and Locke17
In response to the DHOS, the Institute of Medicine (IOM) recommended that research give special attention to health effects among vulnerable populations. The IOM anticipated that, in the Gulf region, certain populations would be more at risk of developing mental/behavioral health issues than others. Certain industrial occupations more likely to experience resource loss (eg, those working in oil/gas, fishing, and tourism industries) may be disproportionately affected by the DHOS.Reference Cope, Slack, Blanchard and Lee10 Furthermore, there may be important differences by demographic characteristics and by region. For example, the CDC/SAMHSA study found that increases in marijuana use after the spill were seen only among adults 26 and older, and there was no examination of differences between the affected states.Reference Gould, Teich and Pemberton3 They also did not examine differences by those who identify as lesbian, gay, or bisexual (LGB). This is of importance because all 5 states – Louisiana (LA), Texas (TX), Florida (FL), Alabama (AL), Mississippi (MS) – have laws that either permit the discrimination of LGB individuals or criminalize same-sex behaviors,Reference Warbelow and Diaz18 creating social and legal environments associated with worse mental health outcomes for LGB persons.Reference Hatzenbuehler, Keyes and Hasin19
This paper presents the results of a population-representative study of coastal residents. Its purpose is 2-fold. First, it is to assess the longer term effects of the DHOS. With few exceptions,Reference Hansel, Osofsky, Osofsky and Speier20, Reference Rung, Oral and Fontham21 there have not been many studies to examine the longer term impacts of oil spills, measured years after the event, though many have stressed the importance of doing so.Reference Gould, Teich and Pemberton3, Reference Hansel, Osofsky, Osofsky and Speier20 Research on long-term impacts of other disasters and mass trauma events (eg, the DHOS,Reference Rung, Oral and Fontham21 September 11 attacks,Reference Caramanica, Brackbill, Liao and Stellman22 and Hurricane SandyReference Schwartz, Gillezeau and Liu23) suggests that most exposed individuals recover from immediate mental health effects. However, for some, these mental health problems may become chronic, whereas others may develop late-onset symptoms.Reference Bonanno and Mancini24 Second, given the persistent threat of disasters in the region, this paper presents baseline data that regional planners can use to identify populations that, based on the presence of existing symptoms, may be particularly vulnerable to disasters.
Given the extant literature on the relationships between mental/behavioral health, resource loss, and oil spills, identifying vulnerable populations in the disaster-prone US Gulf Coast region is critical. Disaster impacts may linger for years after the initial event, and they may be compounded by subsequent disasters. This manuscript examines the relationship between resource loss attributed to the oil spill and mental/behavioral health outcomes 6 years after the DHOS. It also examines variability in mental/behavioral health outcomes across demographic characteristics, ties to oil spill-affected industries, and across the 5 coastal (Gulf) states.
METHODS
The Survey of Trauma, Resilience, and Opportunity in Neighborhoods in the Gulf (STRONG) collected data from a representative sample of adults currently living on or near the Gulf of Mexico coast. Fifty-six coastal counties/parishes across the 5 coastal states were included (LA = 12, TX = 16, FL = 23, AL = 2, MS = 3). For the landline sample, LA, TX, and FL counties were stratified into strata within each state to ensure adequate representation from non-urban residents. Random digit dialing was used to ensure representation of both listed and unlisted phone numbers, and an adult was randomly selected from each household. For the cell phone sample, phone numbers were drawn from regional wireless service phone banks across the 56 counties, without stratification.
Interviews were conducted between April 22 and August 6, 2016. Up to 8 attempts were made per landline phone number, and up to 4 attempts per cell phone number. Calls were staggered over the time of day and days of the week, including weekends.
The final sample consisted of 2520 adult respondents (1617 for the landline sample and 903 for the cell phone sample). Response rates varied by state (AL = 16.3%, FL = 11.6%, LA = 17.8%, MS = 18.0%, TX = 1.3%), with much lower response rates in TX, according to the American Association of Public Opinion Research, Definition 3.25 The range of response rates is similar to that observed in other random digit dial and cell phone surveys.26
Weighting
Survey weights were designed to increase generalizability of the results. Different sets of weights were created to generalize to the (1) entire region and (2) coastal region within each state. For each, a base weight was computed to account for probability of selection into the study based on population density of the county and the number of adults in the household (for landline respondents). Next, the base weight was adjusted using rakingReference Battaglia, Hoglin and Frankel27 and ethnicity, race, education, household income, sex, and age, all taken from the 2012–2016 American Community Survey 5-year estimates.28 Proper random sampling and rigorous efforts to contact sampled persons, as we have done here, combined with accepted weighting techniques, have a strong record of yielding unbiased results.
Imputation
Several of the sociodemographic characteristics exhibited low rates of item nonresponse ranging from 0.20% to 4.76%. To mitigate concerns about nonresponse bias and to make efficient use of all completed cases, we conducted model-based imputation to fill in missing values.Reference Little and Rubin29
Measures
The main outcome measures relate to mental/behavioral health and health care utilization. Primary covariates (aside from state) are affected industry and resource loss, sex, age, race/ethnicity, and sexual orientation.
Mental/Behavioral Health
Depression was measured with the Patient Health Questionnaire (PHQ-2), which asks 2 questions about frequency of depressive symptoms in the past 2 weeks. The scale ranges from 0 to 6, with ≥ 3 indicating a positive screen (sensitivity = 0.83, specificity = 0.90).Reference Kroenke, Spitzer and Williams30 Anxiety was measured with the similarly worded Generalized Anxiety Disorder Questionnaire (GAD-2) (sensitivity = 0.86, specificity = 0.83).Reference Kroenke, Spitzer and Williams31 Alcohol misuse was assessed with 3 questions from the Alcohol Use Disorders Identification Test (AUDIT),Reference Bush, Kivlahan and McDonell32 which ask how frequently the respondent drinks alcohol, the amount the respondent drinks, and how often the respondent has more than 6 drinks on 1 occasion. Summed scores range from 0 to 12, and scores ≥ 3 for women (sensitivity = 0.66, specificity = 0.94) and ≥ 4 for men (sensitivity = 0.86, specificity = 0.72) indicate risk for alcohol abuse (but we consider this a screen for “alcohol misuse”).Reference Bush, Kivlahan and McDonell32 For examining health care utilization (see the next section), we identified “those in need” as those who screened positive for any of the 3 mental/behavioral health conditions.
Health Care Utilization
All respondents were asked about health care coverage, usual source of care (and if not, reasons why), and then questions about the number of visits they made in the past year to an emergency room (ER)/urgent care facility, as well as to mental health professionals, using a series of questions taken directly from the National Health Interview Survey.33
Affected Industry and Exposure
For persons who lived in the affected region at the time of the spill (89.6% of the unweighted and 85.5% of the weighted sample), separate questions were asked if anyone in their immediate families were employed by the oil and gas, fishing and seafood, or tourism industries at the time of the DHOS. Resource loss attributed to the spill was captured in 6 separate questions that asked about (1) property that was lost or damaged because of the DHOS or cleanup; (2) any economic and property damages claims filed in response to the DHOS; and whether the DHOS (3) caused any damage to the areas where they fish commercially; (4) directly affected their hunting, fishing, or gathering activities; (5) led them to lose money; or (6) led them to lose their job or work fewer hours. The responses to these 6 questions were summed to create a composite score labeled “total resource loss,” which ranged from 0 to 6.
Demographics
Questions on sex (male/female), age (open-ended), ethnicity (Spanish, Hispanic, or Latino origins), and race (white, black/African American, American Indian, Alaska Native, Asian, Native Hawaiian, or other Pacific Islander) were modeled after questions in the American Community Survey.34 Age was collapsed into 3 categories: 18–34, 35–64, and 65 and over. Race/ethnicity was collapsed into the following categories: Hispanic, white, non-Hispanic, black, non-Hispanic, and other (including mixed-race) non-Hispanic. Respondents were also asked whether they consider themselves to be heterosexual/straight, gay or lesbian, or bisexual.35
Analysis
Weighted prevalence estimates were produced for all outcomes specific to each state. Weighted logistic regression was implemented to examine differences across states, including indicators of state as predictors, with the state with the most observations (TX) treated as the reference state. Unadjusted logistic regression models were estimated to examine differences by affected industry and each of the resource loss items, as well as the composite total resource loss on outcomes (which was, by definition, restricted to those who lived in the region at the time of the spill). Multivariate models were then estimated, including both the industry and total resource loss on mental/behavioral health outcomes. Unadjusted logistic regression models were used to examine demographic differences in outcomes across the entire sample. Statistically significant differences are based on testing conducted using these regression models. High percentages on mental/behavioral health status and ER visits and low percentages on health care utilization measures indicate those at risk. All analyses were conducted using SAS software, version 9.4.36
RESULTS
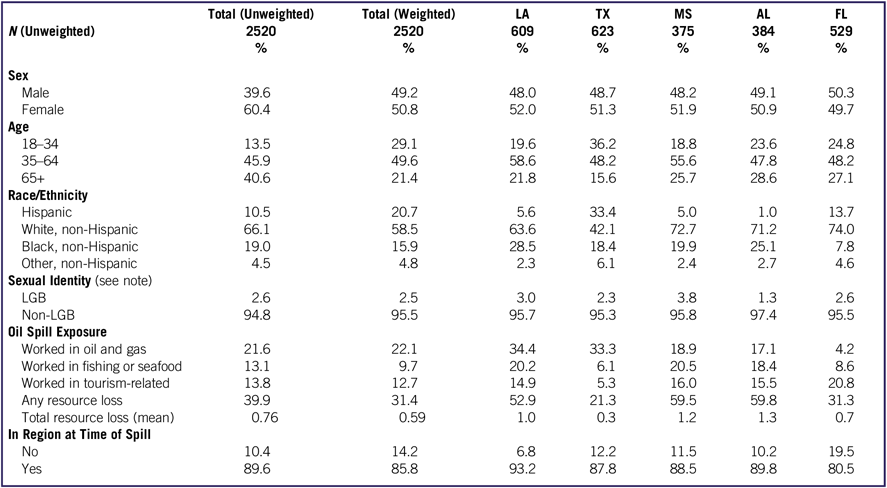
Descriptive characteristics of the sample are presented in Table 1. After weighting, the percentage of males and females is roughly equal; around half of the sample is between 35 and 64 (with 29% young adults and 21% elderly residents), and close to 60% of the entire sample is white (followed by Hispanics and then blacks). After weighting, 2.5% of the sample self-identified as LGB. Nearly a quarter of the sample reported that they themselves or someone in their family worked in the oil and gas industry at the time of the DHOS; fewer (∼10%) worked in commercial fishing and 13% in tourism. Over 31% reported having any of the 6 resource loss categories (estimates ranged from 21.3% in TX to 59.5% in MS); the mean total was 0.59 (SE = 0.04). The most frequently endorsed item was that the spill disrupted hunting, fishing, or gathering activities (endorsed by 20.9%), and the least frequently endorsed item was lost or damaged property as a result of the spill (endorsed by 3.3%).
Descriptive Characteristics of STRONG Survey Respondents, Weighted Except When Otherwise Noted

Note: Percentages may not add up to 100 due to some nonresponses to this item.
Mental/Behavioral Health
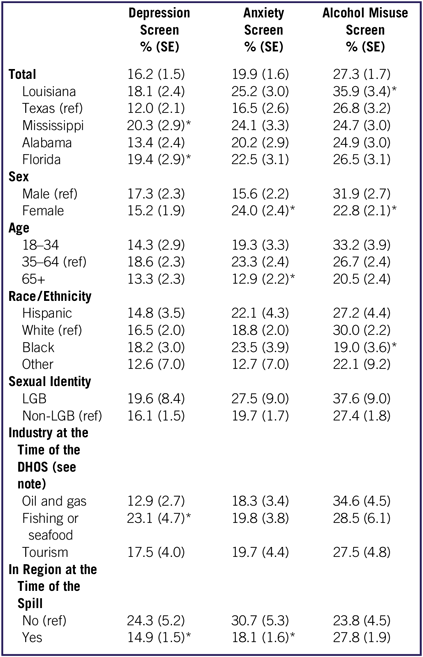
Data on mental/behavioral health outcomes are presented in Table 2. Sixteen percent of residents screened positive for depression, 20% for anxiety, and 27% for alcohol misuse. Although prevalence of anxiety was consistent across the states, prevalence of depression was elevated in FL (odds ratio [OR] = 1.85, 95% CI = 1.10, 3.10) and MS (OR = 1.73, 95% CI = 1.05, 2.83), and alcohol misuse was elevated in LA (OR = 1.59, 95% CI = 1.06, 2.38).
Mental/Behavioral Health Among Residents in Gulf Coast Region

Note: *Statistically significant difference with reference category, indicated by 95% CIs that do not contain the null value (= 1.00). Reference for industry at the time of the DHOS is not participating in each of the industries.
Resource Loss and Industry
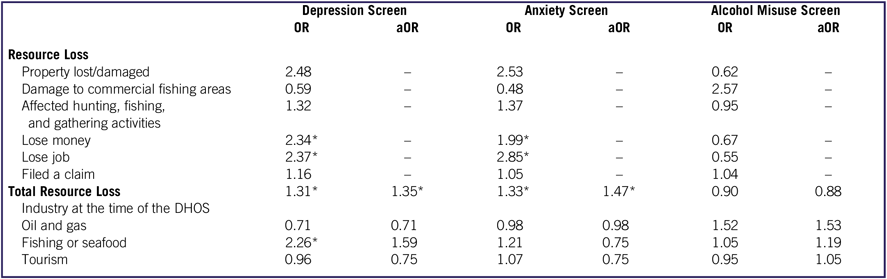
Mental/behavioral health status by resource loss and industry is presented in Table 3. Total resource loss, which was the sum of the 6 individual items, was associated with both positive screens for depression (OR = 1.31, 95% CI = 1.10, 1.57) and anxiety (OR = 1.33, 95% CI = 1.12, 1.58). We also estimated unadjusted models for each of the 6 individual resource loss items; loss of money and loss of a job were each significantly associated with increased risk for positive screens of both depression and anxiety. Persons themselves or their immediate family who worked in the fishing and seafood industry at the time of the DHOS were more likely than non-fishers to screen positive for depression in models that also controlled for having been in the oil and gas and tourism industries (OR = 2.26, 95% CI = 1.27, 4.02).
Mental/Behavioral Health Among Gulf Coast Residents, by Resource Loss and Industry

Note: OR = odds ratio; aOR = adjusted odds ratio.
* P < 0.05. Adjusted models include total resource loss and industry at the time of the DHOS.
In multivariate models with industry and resource loss variables as covariates, total resource loss remained associated with depression (adjusted OR [aOR] = 1.35, 95% CI = 1.09, 1.66), but the fishing industry did not (aOR = 1.59, 95% CI = 0.84, 3.03).
Demographic Differences
As shown in Table 2, women were more likely to screen positive for anxiety (OR = 1.71, 95% CI = 1.13, 2.57) and less likely to screen positive for alcohol misuse (OR = 0.63, 95% CI = 0.45, 0.89). Elderly residents had a lower prevalence of anxiety relative to young adults (OR = 0.49, 95% CI = 0.30, 0.78). Black and non-Hispanic residents had significantly lower prevalence of alcohol misuse than whites (OR = 0.55, 95% CI = 0.33, 0.90). Those in the fishing and seafood industry had elevated rates of depression (OR = 2.26, 95% CI = 1.27, 4.02), and those who lived in the region at the time of the spill were less likely to screen positive for depression (OR = 0.54, 95% CI = 0.30, 0.99) and anxiety (OR = 0.50, 95% CI = 0.29, 0.85) than those who did not.
Health Care Utilization
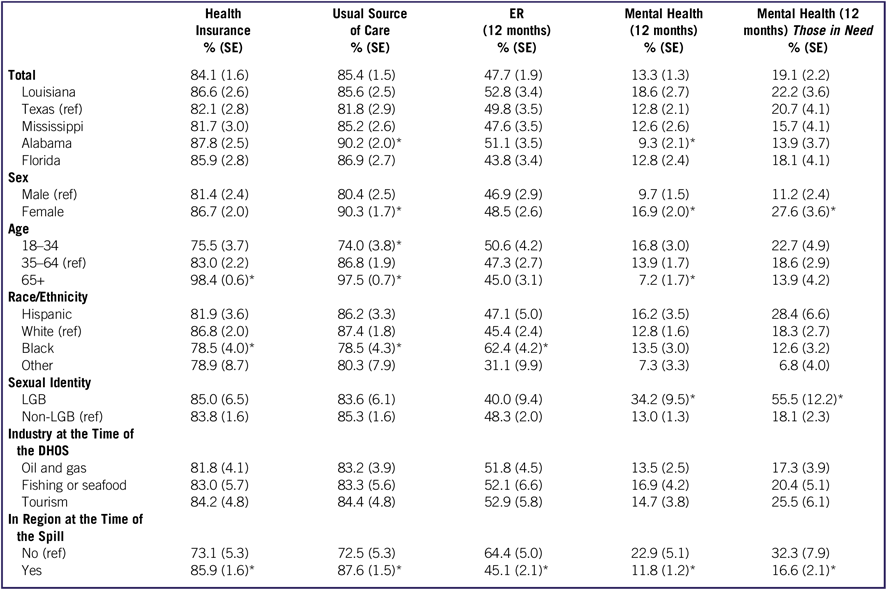
Data on health care utilization are presented in Table 4. There was little variation across states for most measures of health care utilization. Eighty-four percent had health care coverage, 85% had a usual source of care, 48% had visited an ER, and 13% had visited a mental health care provider in the past 12 months. Forty-seven percent of sampled adults screened positive for either depression, anxiety, or alcohol misuse; of these, only 19% had seen a mental health care provider in the past 12 months.
Health Care Coverage and Utilization Among Residents in the Gulf Coast

Note: *Statistically significant difference with reference category, indicated by 95% CIs that do not contain the null value (= 1.00). Reference for industry at the time of the DHOS is not participating in each of the industries. “Those in need” refers to individuals who screened positive for depression, anxiety, or alcohol misuse.
Among the 15% of residents without a usual source of care, the most common reason endorsed was that the respondent was seldom or never sick (69%). Forty-nine percent reported that care was too expensive, 34% reported that care was not convenient or unavailable, 28% reported insurance reasons, 26% reported that they had recently moved, and 23% reported that they did not trust or like doctors. There were no differences across states in the percentage endorsing each category.
Industry and Resource Loss
There were no statistically significant differences across industries with respect to health care coverage and utilization. Total resource loss was associated with a decreased likelihood of having health insurance (OR = 0.82, 95% CI = 0.68, 0.99) and an increased likelihood of visiting the ER in the past 12 months (OR = 1.22, 95% CI = 1.04, 1.43).
Demographic Differences
As shown in Table 4, elderly residents were more likely to have health insurance than adults (OR = 12.32, 95% CI = 5.45, 27.85), and black residents were less likely than white residents to have health insurance (OR = 0.56, 95% CI = 0.31, 0.99). Elderly residents were also more likely than adults to have a usual source of care (OR = 6.00, 95% CI = 3.12, 11.54), whereas young adults were less likely than adults (OR = 0.44, 95% CI = 0.26, 0.72). Women were more likely than men (OR = 2.26, 95% CI = 1.38, 3.69), and black residents were less likely than white residents (OR = 0.52, 95% CI = 0.29, 0.96) to have a usual source of care. Black residents were more likely than white residents to report having visited the ER in the past 12 months (OR = 2.00, 95% CI = 1.34, 2.99).
With respect to use of mental health services, elderly residents were less likely than adults (OR = 0.48, 95% CI = 0.27, 0.85) to have visited a mental health provider in the past 12 months, whereas women were more likely than men (OR = 1.90, 95% CI = 1.22, 2.96), and LGB residents were more likely than non-LGB residents (OR = 3.48, 95% CI = 1.47, 8.21), to have visited a mental health provider in the past 12 months. When restricted to those who screened positive for depression, anxiety, or alcohol misuse, the difference between elderly and adults was no longer statistically significant, though it was strengthened for women (OR = 3.04, 95% CI = 1.67, 5.53) and for LGB residents (OR = 5.62, 95% CI = 2.04, 15.45).
DISCUSSION
The STRONG study provides representative data on the health and well-being of residents along the US Gulf Coast and how these outcomes relate to their exposure to and resource loss associated with the DHOS. Consistent with past research, increasing levels of resource loss attributable to the spill were positively correlated with current depression and anxiety symptoms. This may suggest that the shock to a family’s financial security caused by the oil spill impacted their mental/behavioral health and persists over time. This may be likely given the relatively low rates of mental health care treatment among those in need reflected in this study; if those who developed symptoms at the time of the spill were treated, some are likely to have improved. Alternatively, the financial shock of the DHOS may have persisted over time (ie, people never retained employment at pre-spill levels),Reference Aldy37 and the effects on mental/behavioral health may reflect an association between current resource availability and mental/behavioral health symptoms. However, one cannot discount at least 2 alternative possibilities given the cross-sectional nature of the data: (1) that persons more likely to have mental/behavioral health conditions prior to the spill were more likely to experience disruptions caused by the spill, or (2) that persons with mental/behavioral health conditions self-report greater disruptions caused by the spill. The Consortium for Resilient Gulf Communities (see www.resilientgulf.org) is continuing to conduct research to untangle some of these effects.
In addition to self-reported resource loss, those employed in fishing and seafood production at the time of the spill were more likely to meet current criteria of depression. Results suggest that this is driven by high levels of perceived resource loss attributed to the spill. It is worth noting that fishers have one of the highest suicide rates nationally, which may suggest further underlying differences that impact mental/behavioral health among this population.Reference McIntosh, Spies and Stone38–Reference Tiesman, Konda and Hartley40 Although workplace-based strategies for promoting mental/behavioral health and preventing suicide exist for industries like constructionReference Carson41 and law enforcement,42 further efforts may be needed to better understand depression among fishers in the Gulf Coast and to create interventions specific to this group.
Several findings are relevant for planning to mitigate the mental and behavioral effects of future disasters. State-level estimates are helpful for states to develop plans specific to their coastal communities, because state-level policies typically guide disaster response planning. But findings consistent across the entire region are worth noting. Estimates of positive screens of depression in the region (16%) are much higher than the 6.7% of adults nationwide who meet criteria for a past year major depressive episode, which was an estimate consistent with the regional estimates produced by SAMHSA/CDC immediately after the spill.Reference Gould, Teich and Pemberton3, 43 This, in part, may be due to the screening tool we used (ie, the PHQ-2), which results in a significant number of false positives.Reference Kroenke, Spitzer and Williams30 Nonetheless, although it is recommended that anyone who screens positive on the PHQ-2 receive a more thorough mental health assessment, only 13% of the sample had seen a mental health provider in the past year, a percentage that does not change dramatically when restricted to persons in need for care (though our screening tools provide a liberal, though sensitive, threshold for defining those “in need”). The prevalence estimate of depression is also consistent with what was observed in the CDC/SAMHSA study immediately after the spill, but lower than national estimates.Reference Gould, Teich and Pemberton3, Reference Wang, Lane and Olfson44 By most metrics, access to mental health care lags in the 5 states included in our sample relative to the rest of the United States,45 so reducing stigmatized attitudes toward seeking mental health treatment could be a potentially successful aim of regional interventions.Reference Clement, Schauman and Graham46
This study also sheds light on a major concern for this region: the high levels of alcohol misuse. Across the region, more than 1 in 4 adults report misusing alcohol; in Louisiana, it is more than 1 in 3. This is consistent with, or perhaps higher than, rates seen nationally and much higher than the 6% meeting criteria for heavy drinking and 15% meeting criteria for binge drinking in the SAMHSA/CDC study.Reference Gould, Teich and Pemberton3, 47 Like mental health, there is some evidence that alcohol use increases after disastersReference Stewart48 – drinking behaviors among those currently engaged in problematic use may be exacerbated, though evidence of increased incidence of alcohol use disorders after a disaster is mixed.Reference Keyes, Hatzenbuehler and Hasin49 Alcohol misuse is linked with adverse outcomes in both the near and long term (eg, traffic crashes, cirrhosis, losses in work productivity, and crime),Reference Bouchery, Harwood and Sacks50 so it poses significant costs to communities where resources may already be strained due to disasters.
When examining differences by demographic categories, the results by sex and age are by-and-large consistent with what is observed nationally.Reference Kanny, Liu, Brewer and Lu51, Reference Moonesinghe, Chang and Truman52 However, access to and engagement in care among black residents is significantly lower in the region than that of their peers, and visits to ERs are greater. There have been some efforts to reduce such disparities. For example, the Affordable Care Act has increased insurance rates nationally among blacks who had historically been more likely to be uninsured.53, Reference Artiga, Foutz and Damico54 Expanding Medicaid, which only occurred in LA among the 5 states in our sample, is 1 of many options that may increase insurance coverage for black residents and further engage them in care.Reference Artiga, Foutz and Damico54, Reference Chin, Walters, Cook and Huang55 However, reducing ER visits may require more than just ensuring that black residents have health insuranceReference Zuckerman and Shen56 or a usual source of careReference Weber, Showstack and Hunt57; unfortunately, interventions to reduce emergency department visits are not well researched.Reference Raven, Kushel and Ko58
Our study is also 1 of a growing number of studies that asks directly about sexual identity; 2.5% of the population identifies as LGB, which is somewhat smaller but of the same magnitude as national estimates.Reference Gates and Newport59 Very few statistically significant differences were found between the LGB-identifying residents and those who do not identify this way, potentially due to low statistical power to detect small to moderate effect size differences. Due to an anticipated low number of positive endorsements, we did not ask about transgender identity. This study, nonetheless, contributes to a growing literature examining differences in mental/behavioral health outcomes by sexual identity and does so across states with legal environments known to contribute to poor mental/behavioral health outcomes among LGB individuals.Reference Warbelow and Diaz18, Reference Hatzenbuehler, Keyes and Hasin19 It is noteworthy that, consistent with national surveys,Reference Kim and Fredriksen-Goldsen60 very few respondents refused to answer the question (< 2%). It is feasible for other health surveillance studies, including those from which national estimates of health and well-being derive, to add questions about sexual identity to their standard demographic batteries to monitor the health and well-being of this group.
Though this study provides unique insight into the mental/behavioral health and well-being of coastal communities, there are limitations worth noting. First and foremost, our survey has an overall response rate of 4.5%, driven by a particularly low rate in TX. Probability sampling and weighting can be combined to yield generalizable inferences, but they do not fully prevent against nonresponse bias. Results, especially those for TX, should be interpreted with these potential biases in mind. Telephone response rates are declining nationally, and our effort is therefore not unique in this regard.26, Reference Curtin, Presser and Singer61 Furthermore, the procedure used to generate weights is designed to mitigate some nonresponse bias attributed to systematic differences in the observed variables used in the raking. Also, because we designed the survey to be short and we wanted to include information about a variety of topics, we used short screeners to measure mental/behavioral health outcomes. These instruments are less precise than other, longer assessments, but they are still validated approaches with clinical relevance, as described earlier.
CONCLUSIONS
The results from the STRONG study present a snapshot of the health and well-being of coastal residents and communities that have been recently exposed to major natural and technological disasters. Given the heightened prevalence of alcohol misuse in the region, policy-makers should tackle the issue directly by establishing aspirational goals like those put forth in Healthy People 2020, which seeks to reduce national binge drinking among adults from 27.1% in 2008 to 24.4% by 2020.62 States have increased flexibility to craft their own local health care plans, and the data from this study suggest the critical need for the Gulf States to develop policies and programs to engage black residents in care.Reference Chin, Walters, Cook and Huang55
Because of the seasonal nature of hurricanes and the volume of offshore oil drilling in the region, communities should be prepared to respond to future disasters. The details provided here can help communities better understand specific risks in the region to help tailor specific resources to potentially vulnerable residents.
Funding
This research was supported by a grant from The Gulf of Mexico Research Initiative. Data are publicly available through the Gulf of Mexico Research Initiative Information and Data Cooperative (GRIIDC) at https://data.gulfresearchinitiative.org (10.7266/N76971Z0).
Conflict of Interest Statement
The authors have no conflicts of interest to declare.