



1. Introduction
Schematic of the development and advection of the starting vortex at the trailing edge of a flat plate in an unbounded quiescent fluid. This is shown in the moving frame of the plate, which moves to the right in the laboratory frame. The fluid impinges on the moving plate with speed,
 $U$
. The chord length,
 $c$
, and angle of attack,
 $\alpha$
, are also shown. The starting vortex at the leading edge is ignored.

A canonical problem in aerodynamics is the development of a vortex at the trailing edge of a two-dimensional flat plate of chord length,
 $c$
, which is impulsively set into motion at time,
 $t=0$
, with constant rectilinear velocity,
 $U \hat {\boldsymbol{x}}$
, and constant small angle of attack,
 $\alpha$
, relative to the direction of motion specified by the Cartesian basis vector,
 $\hat {\boldsymbol{x}}$
;
 $U$
is the plate speed. The flow that develops from this motion, shown schematically in figure 1 in a reference frame attached to the plate, has been widely studied in classical aerodynamic theory and unsteady airfoil analysis, e.g. see Theodorsen (Reference Theodorsen1934), Küssner (Reference Küssner1936), Bisplinghoff et al. (Reference Bisplinghoff, Ashley and Halfman1955), Katz & Plotkin (Reference Katz and Plotkin2001), Fung (Reference Fung2002) and Eldredge (Reference Eldredge2019). Over long convective times, the circulation of the shed vorticity and the accompanying lift are succinctly captured by Wagner’s classical model for a flat plate (Wagner Reference Wagner1925). Numerous experimental studies on both flat plates and airfoils have confirmed Wagner’s prediction of lift and, through particle image velocimetry (PIV), the circulation. This confirmation has been reported directly for bodies impulsively started from rest (Beckwith & Babinsky Reference Beckwith and Babinsky2009; Babinsky et al. Reference Babinsky, Stevens, Jones, Bernal and Ol2016; Goyal & Nedić Reference Goyal and Nedić2025), or indirectly as the indicial response to an incremental change in motion via convolution with a more complex body motion (Stevens & Babinsky Reference Stevens and Babinsky2017; Sedky et al. Reference Sedky, Gementzopoulos, Andreu-Angulo, Lagor and Jones2022).
It is important to note that, to remain analytically tractable, Wagner’s model (Wagner Reference Wagner1925) employs a flat vortex sheet – an inviscid approximation of a shear layer – that convects downstream from the trailing edge, tangent to the plate. Such a vortex sheet does not physically remain flat, with its free end rolling up into a growing core (Kaden Reference Kaden1931; Pullin Reference Pullin1978). The resulting starting vortex is indicated schematically in figure 1. In the wake downstream of the trailing edge, the growth of this vortex is governed by the entrainment of circulation into the core at a rate determined by the velocity of the feeding shear layer relative to the convective speed of the core itself. This growth process terminates when the relative velocity changes sign, as explored in the recent experimental study of an accelerating airfoil by Goyal & Nedić (Reference Goyal and Nedić2025). That work measured the circulation within the core of the starting vortex, distinguishing it from the shear layer using a vortex-identification criterion. They identified the instant at which the core ceases to accept circulation from the shear layer as the detachment time of the starting vortex. However, that detachment is associated with the emergence of new vortices from a Kelvin–Helmholtz instability of the shear layer. The present study is concerned with an earlier detachment of the nascent starting vortex from the plate itself, and thus an alternative definition will be used for detachment time.
The lack of an explicit representation of the vortex core has not been a significant deficiency in Wagner’s model (Wagner Reference Wagner1925), as its favourable agreement with experimental studies makes clear. The shedding and advection of vorticity into a flat wake serve as a reasonable surrogate for predicting lift over long times, e.g.
 ${\sim}1{-}10$
chord lengths of travel. To underscore this point, Tchieu & Leonard (Reference Tchieu and Leonard2011) developed a simplified unsteady aerodynamics model with a discrete vortex of variable strength (reminiscent of a vortex core) and showed that it reproduces Wagner’s lift prediction well for impulsive motion.
However, it is important to emphasise that the entrainment of circulation into the core begins at the very instant the airfoil is set into motion. In the inviscid approximation of this earliest stage of development, the initial vortex growth is not governed by an intrinsic length scale (such as the chord length), but instead by the attached flow local to the trailing edge (Pullin Reference Pullin1978). This starting vortex is therefore formally described by the self-similar roll-up of a vortex sheet rooted at the trailing edge (Pullin Reference Pullin1978; Pullin & Wang Reference Pullin and Wang2004; Pullin & Sader Reference Pullin and Sader2021). This self-similar core remains on the leeward side of the trailing edge, along a line that extends nearly normal to the plate surface, as illustrated in figure 1 by the (black) vortex at the earliest time. This configuration differs substantially from the tangent vortex sheet assumed in Wagner’s model (Wagner Reference Wagner1925) and the tangential motion of the point vortex in the model of Tchieu & Leonard (Reference Tchieu and Leonard2011).
This paper seeks to reconcile these two distinct regimes of near normal and tangential vortex motion. These motions respectively correspond to the initial formation and growth of a vortex at the trailing edge, and its subsequent advection downstream that leads to a steady state and constant lift. The lift coefficient during the initial (self-similar) vortex growth is predicted to scale as
 $C_L \sim (Ut/c)^{-1/3}$
(Graham Reference Graham1983; Pullin & Wang Reference Pullin and Wang2004), following the inertial reaction force at
 $t = 0^+$
associated with the impulsive start; the inertial reaction force corresponds to a Dirac delta function in time. This behaviour contrasts sharply with Wagner’s theory (Wagner Reference Wagner1925), which for small angle of attack,
 $\alpha$
, predicts a monotonic increase in lift from an initial value of
 $C_{L,\infty }/2$
to its steady-state value,
 $C_{L,\infty } = 2\pi \alpha$
, over an interval
 $ \textit{Ut}/c \sim 10$
. The evolution of circulation in these two regimes also differs.
The scarcity of prior studies reconciling these two regimes is not surprising. As we will show, the self-similar regime ends after a very short time interval – only a small fraction of a chord length of travel at all angles of attack – which may easily fall within a single time step of a high-fidelity Navier–Stokes simulation or between successive snapshots in PIV. Nevertheless, this early regime can be made observable (e.g. on a time and length scale accessible to experiments) in an experimental set-up with large chord length and small flow speed, provided the acceleration completes before the detachment time. More generally, the short-time lift that decreases with time following the Dirac delta function is yet to be reconciled with the monotonically increasing lift predicted by Wagner.
A previous attempt to reconcile the disagreement between these two regimes was made by Graham (Reference Graham1983), who used a discrete vortex model to capture aspects of both regimes. However, that study did not examine the physical processes that mark the transition from one regime to the next. The present study, which employs a discretised vortex-sheet model, provides a more comprehensive investigation of this flow transition and the mechanisms that govern it. It is anticipated that the transition should be triggered when the self-similar assumption begins to fail due to the influence of the plate chord length. In the irrotational flow that emerges at
 $t = 0^+$
– commonly referred to as the ‘attached flow’ (Pullin Reference Pullin1978) – a flat plate at an angle of attack,
 $\alpha$
, develops a stagnation point on its upper surface. This stagnation point is located a distance,
 $c\sin ^2 (\alpha /2)$
, from the trailing edge (Milne-Thomson Reference Milne-Thomson1996), which, for small angles of attack,
 $\alpha \ll 1$
, is approximately
 \begin{align} L_s(\alpha ) \equiv \frac {1}{4}\alpha ^2 c. \end{align}
As we will show, this length scale imposes itself on the early vortex development and terminates the self-similar regime. The starting vortex at very small time possesses its own (and distinct) stagnation point nearer the trailing edge, associated with reattachment of the streamline encircling the vortex. The distance of this stagnation point from the trailing edge along the upper surface is denoted by
 $s_1$
, while the corresponding distance for the aforementioned stagnation point is denoted by
 $s_2$
. The time evolution of these two stagnation points and particularly, their approach toward one another, is examined. Their collision and annihilation naturally demarcate the transition between the self-similar regime and the wake-advection regime described by Wagner’s model. As will be shown, this collision causes the vortex’s closed streamlines to detach from the plate surface.
2. Evolution of the trailing-edge vortex
2.1. Numerical method
The numerical computations of the inviscid flow development are performed with a regularised vortex-sheet method (Jones Reference Jones2003; Darakananda & Eldredge Reference Darakananda and Eldredge2019). To enforce the Kutta condition, a vortex sheet is rooted at the trailing edge; in a few cases, where specified, we do the same at the leading edge, as well. Starting from rest, a vortex-sheet element is placed at the edge, perpendicular to the plate, and each subsequent new element is added to the existing sheet’s root at the edge, once per time step
 $\Delta t$
. The strength of each new element is determined by the Kutta condition. Vortex elements on the sheet advect with a velocity computed from the Biot–Savart integral over the sheet(s) in the fluid and the bound vortex sheet on the plate; the strength distribution of the latter is calculated from the no-penetration condition by discretising the plate with 2048 panels distributed at Chebyshev nodes. The velocity induced by each vortex-sheet element is algebraically regularised, with a blob radius
 $\delta = \min (100U\Delta t,10^{-2}c)$
.
A filtering algorithm is applied at each time step to redistribute the sheet’s elements uniformly and eliminate length scales smaller than
 $4U\Delta t$
. The time step size is generally constant for most cases, and chosen for each case to ensure converged results in the time range of interest. For the simulations that cover larger ranges (i.e. many orders of magnitude of time scales) of the development process, we use a time step size that increases exponentially up to a maximum of
 $U\Delta t/c = 10^{-2}$
. All results reported in table 1 and figures 2–5 are obtained using this numerical vortex-sheet method unless specified otherwise.
2.2. Approximate analytical model
For purposes of rationalising some of the results obtained with our numerical method, we use a small-time asymptotic model in which the trailing-edge vortex is represented by a single point vortex of variable strength, based on the work of Rott (Reference Rott1956). This point-vortex model is reported in Appendix A.
The time evolution of the streamlines near the trailing edge of a flat plate moved impulsively at constant velocity with fixed angle of attack,
 $\alpha$
. Results are shown in the moving frame of the plate. In each plot,
 $s_1$
and
 $s_2$
are denoted by open circles (left and right, respectively), and a single open circle when they coincide. The vortex sheet is shown in green in the insets when
 $s_1$
and
 $s_2$
coincide.

2.3. Streamlines and stagnation points
Figure 2 shows the time evolution of the streamlines, and the above-mentioned stagnation points on the flat plate, as a function of the convective time,
 $U t/c$
, and the angle of attack,
 $\alpha$
. Our objective is to calculate the ‘detachment time’,
 $\textit{Ut}_{d} / c$
, at which the trailing-edge vortex detaches from the plate, which we define as the time at which the two above-mentioned stagnation points collide on the plate surface. Subsequent to this time, the stagnation point moves off the plate surface and the streamlines enclosing the vortex centre separate and move away from the plate. The times,
 $\textit{Ut}_{d}/c$
, at which these stagnation points collide are collected for several angles of attack in table 1, and plotted in figure 3(a). To ensure that these results are independent of numerical parameters, we reduce the time step size in each case – while keeping the regularisation and filtering parameters in the same proportions to the time step as reported above, to maintain a well-resolved sheet – until
 $t_{d}$
becomes invariant. For example, reducing the time step size for the
 $\alpha = 20^\circ$
case by a further factor of two, the shedding time remains unchanged to three significant digits.
Numerical dataset of vortex detachment time,
 $U{t_{d}}/c$
, as a function of the plate angle of attack,
 $\alpha$
.

Table 1. Long description
A table with two columns and six rows. The first column is labeled ‘α (degrees)’ and the second column is labeled ‘Ut/d/c’. The table presents the following data: Row 1: α (degrees), 5; Ut/d/c, 1.417 x 10^-4. Row 2: α (degrees), 10; Ut/d/c, 5.745 x 10^-4. Row 3: α (degrees), 15; Ut/d/c, 1.310 x 10^-3. Row 4: α (degrees), 20; Ut/d/c, 2.367 x 10^-3. Row 5: α (degrees), 25; Ut/d/c, 3.785 x 10^-3. Row 6: α (degrees), 40; Ut/d/c, 1.089 x 10^-2. Row 7: α (degrees), 50; Ut/d/c, 1.908 x 10^-2.
(a) Plot of convective detachment time,
 $\textit{Ut}_{d} / c$
, as a function of the angle of attack,
 $\alpha$
, arising from the data reported in table 1. Circles: numerical data. Line: best fit of a quadratic function to the numerical data for
 $\alpha \ll 1$
. (b) Bifurcation diagram showing the dynamics of the two stagnation points,
 $s_1$
and
 $s_2$
, on the plate surface following start up, at various angles of attack. The vortex detachment time given in (2.1) is specified by the saddle-node bifurcation point which is denoted by a vertical dotted line.

Results for the detachment time in figure 3(a) exhibit a quadratic dependence on the angle of attack,
 $\alpha$
, provided
 $\alpha$
is small. This
 $\alpha$
-dependence aligns with (1.1), from which we determine that
 $t_{d}$
obeys the universal detachment time
 \begin{align} \frac {U{t_{d}}}{L_s(\alpha )} \approx 0.076, \qquad \alpha \ll 1, \end{align}
where
 $\alpha$
is expressed in radians, or equivalently,
 \begin{align} \frac {U{t_{d}}}{c} \approx 0.019\alpha ^2, \qquad \alpha \ll 1; \end{align}
see figure 3(a). The results in figure 3(a) show that the universal detachment time in (2.1) applies up to angles of attack of approximately 20
 $^\circ$
, and remains reasonably accurate up to 50
 $^\circ$
. We note that such agreement at larger parameter values is often observed in self-consistent asymptotic solutions like (2.1), e.g. Stokes drag experienced by a sphere at moderate Reynolds numbers. We also find that (2.1) is unaffected by the presence or suppression of a leading-edge vortex (data not shown). This is not unexpected because the stagnation points collide very near the trailing edge. We also note that, although we have not reported results at non-zero angles of attack smaller than
 $\alpha = 5^\circ$
, there is no challenge in exploring such angles provided a correspondingly smaller time step size is used; these results follow the same trend.
Figure 3(b) shows the time evolution of the two stagnation points,
 $s_1$
and
 $s_2$
, on the upper plate surface for several angles of attack;
 $s_1 = 0$
and
 $s_2 = L_s(\alpha )$
when
 $t=0^+$
, which arise from the starting vortex and the attached flow, respectively. These stagnation points are plotted as a function of reciprocal time,
 $L_s(\alpha )/(U t)$
, in accordance with (2.1), to highlight their collision and annihilation as a standard saddle-node bifurcation. By scaling spatial positions by
 $L_s(\alpha )$
and time by
 $L_s(\alpha )/U$
, the evolution of these stagnation points exhibits a nearly universal collapse for all angles of attack reported. This collapse confirms that
 $L_s(\alpha )$
is the governing characteristic length scale in this process, and furthermore, shows that the effect of angle of attack on the process is completely described by
 $L_s(\alpha )$
.
Universal trailing-edge detachment process at small angle of attack,
 $\alpha$
, computed here for
 $\alpha = 15^\circ$
; indistinguishable results are found for
 $\alpha \le 20^\circ$
(data not shown). Plots of instantaneous streamlines with the vortex centre highlighted as a blue circle; insets give the corresponding vortex sheet in green.

The (independent) point-vortex model in Appendix A produces the following expression for the vortex detachment time:
 \begin{align} \frac {\textit{Ut}_{d}}{c} = \frac {1}{4} \big (5 \sqrt {2}-7\big ) \alpha ^2 \approx 0.018 \alpha ^2, \end{align}
which agrees well with (2.2). This point-vortex model also predicts that bifurcation occurs at
 $s_1 = s_2 = \alpha ^2/8$
; see (A5) in Appendix A. This is precisely half-way between the initial values of
 $s_1$
and
 $s_2$
, which is also in close agreement with the full numerical vortex-sheet result; see figure 3(b).
To complete the investigation of the flow evolution, figure 4 gives an array of plots showing the universal vortex detachment process, in which the coordinate system is oriented with the plate; the spatial coordinates are scaled by
 $L_s(\alpha )$
while time is scaled by the dimensional detachment time,
 $t_{d}$
, given in (2.1). Although figure 4 is generated for
 $\alpha = 15^\circ$
, its results are indistinguishable for
 $\alpha \le 20^\circ$
(data not shown). Once the two stagnation points,
 $s_1$
and
 $s_2$
, collide on the plate, the resulting single stagnation point detaches from the plate. This generates a gap between the streamlines encircling the vortex and the plate, which leads to downstream advection of the vortex and the emergence of the flow regime described by Wagner’s model.
2.4. Lift and circulation evolution
The results of the previous section reveal a distinct change in flow evolution at the time of vortex detachment,
 $t_{d}$
. In this section, we examine the lift force experienced by the plate and the net circulation of the trailing-edge vortex, again for
 $\alpha = 15^\circ$
over a time range that includes
 $t_{d}$
. The dimensionless lift coefficient (defined in (2.4)) over the entire time history (up to
 $ \textit{Ut}/c = 20$
) of the developing flow is shown in figure 5(a). Two parallel time axes are used: the lower one in which time is scaled by
 $t_{d}$
, i.e.
 $t/{t_{d}}$
, and the upper one in standard convective time units, i.e.
 $U t / c$
. The relationship between these scales is specified by (2.1).
Time dependence of the (a) lift coefficient,
 $C_L(t)$
, and (b) total circulation in the shed trailing-edge vortex,
 $\varGamma (t)$
, for an angle of attack of
 $\alpha = 15^\circ$
(blue solid line). Panel (a) also depicts the long-time steady-state result of
 $C_L = 2 \pi \alpha$
(black dashed line) and the time-dependent Wagner solution (black solid line) for reference, along with the early-time fit function in (2.4) (red solid line). Panel (b) shows the Wagner solution (black solid line) for reference, along with the early-time fit function in (2.5). In the latter function, the power law is fixed at
 $1/3$
and the leading coefficient is adjusted to fit the numerical data for
 $t \ll {t_{d}}$
using a least-squares fit; this yields the displayed value of 0.36 in (2.5). In both panels, the spurious oscillation at around
 $t/{t_{d}} = 10^2$
is due to a change of scheme for vortex-sheet resolution.

Figure 5. Long description
Panel A: A line graph shows the lift coefficient over time. The x-axis represents time normalized by a characteristic time, and the y-axis represents the lift coefficient. The graph includes multiple lines: a blue solid line for the vortex sheet, a black dashed line for the long-time steady-state result, a black solid line for the Wagner solution, and a red solid line for the early-time fit. Panel B: Another line graph shows the total circulation in the shed trailing-edge vortex over time. The x-axis represents time normalized by a characteristic time, and the y-axis represents the circulation. The graph includes a blue solid line for the vortex sheet, a black solid line for the Wagner solution, and a red solid line for the early-time fit.
The change in lift behaviour as a function of time is clear, with this change beginning at
 $t \approx {t_{d}}$
. Numerical data for the dimensionless lift coefficient,
 $C_L(t)$
, generated for
 $t \ll {t_{d}}$
, are fit to the functional form
 \begin{align} C_{L}(t) \equiv \frac {2 L}{\rho U^2 c} \approx a \left (\frac {Ut}{c}\right )^{-1/3} + b, \end{align}
where
 $L$
is the lift per unit length experienced by the plate and
 $\rho$
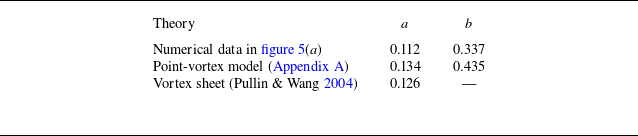
is the fluid density. Equation (2.4) is motivated by the lift generated by a starting vortex sheet (Pullin & Wang Reference Pullin and Wang2004). This fit is included in figure 5(a), with the fit values for
 $a$
and
 $b$
reported in table 2. These fit values are compared with those mathematically derived using the point-vortex model and the leading-order coefficient of the self-similar vortex-sheet model reported by Pullin & Wang (Reference Pullin and Wang2004). Good agreement is observed throughout, demonstrating the veracity of the results obtained using the numerical vortex-sheet method described in § 2.1. Time dependence of the lift predicted by the numerical simulation in
 $0 \lt t \ll {t_{d}}$
is evidently consistent with the self-similar starting vortex regime.
Parameters
 $a$
and
 $b$
in (2.4) for the lift coefficient, obtained using a least-squares fit to numerical data in figure 5(a) and derived mathematically for the point-vortex model in Appendix A and a vortex sheet (Pullin & Wang Reference Pullin and Wang2004).

Table 2. Long description
A table comparing parameters for the lift coefficient across different models. The table has three rows and three columns. The columns are labeled ‘Theory’, ‘a’, and ‘b’. The rows are labeled ‘Numerical data in figure 5(a)’, ‘Point-vortex model (Appendix A)’, and ‘Vortex sheet (Pullin & Wang 2004)’. Row 1: Numerical data in figure 5(a), a: 0.112, b: 0.337. Row 2: Point-vortex model (Appendix A), a: 0.134, b: 0.435. Row 3: Vortex sheet (Pullin & Wang 2004), a: 0.126, b: —.
For reference, the time-dependent lift from the Wagner function is also reported in figure 5(a), where the initial Wagner lift force of
 $C_{L,\infty } = \pi \alpha$
is evident. This initial lift force does not apply for
 $t \lesssim {t_{d}}$
; it is inaccurate for
 $t \lt 1000 {t_{d}}$
. A transition region is initiated at
 $t \approx {t_{d}}$
, i.e. once the starting vortex detaches from the plate, which continues up to
 $t \approx 1000 {t_{d}}$
at a time where the starting vortex predominantly moves downstream with the flow. After this time, the lift begins to approach the Wagner lift; this corresponds to a convective time of
 $ \textit{Ut}/c \gtrsim 0.2$
at this angle of attack. Qualitatively similar results are obtained for
 $\alpha \le 20^\circ$
(data not shown).
The time evolution of the net dimensionless circulation in the shed vortex,
 $\varGamma (t)$
, is reported in figure 5(b); the circulation is scaled by
 $U c$
. As with the lift coefficient,
 $C_L(t)$
, the behaviour of
 $\varGamma (t)$
changes after
 $t \approx {t_{d}}$
. For early times, i.e.
 $t \ll {t_{d}}$
, the circulation computed using the present numerical method is well represented by the fit function
 \begin{align} \varGamma (t) \approx 0.36 \left (\frac {Ut}{c}\right )^{1/3} \!, \end{align}
which is also shown in figure 5(b). In this time regime, the self-similar vortex-sheet calculation (Pullin & Wang Reference Pullin and Wang2004) gives
 $\varGamma (t) = 0.398 (Ut/c)^{1/3}$
, while the point-vortex model in Appendix A yields
 $\varGamma (t) = 0.411 (Ut/c)^{1/3}$
. Both of these independent calculations are in close agreement with (2.5). At later times, the circulation closely follows Wagner’s predicted circulation, which is also included in figure 5(b). Note that the early-time behaviour of Wagner’s solution gives
 $\varGamma (t) \sim (Ut/c)^{1/2}$
(Wagner Reference Wagner1925) whose time power law differs from those of the above expressions. This is not unexpected, because Wagner’s solution assumes that the wake is shed downstream rather than normal to the plate, an assumption that does not hold at early times, i.e.
 $t \ll {t_{d}}$
.
3. Conclusions
We have investigated the evolution of the vortex generated at the trailing edge of a flat plate that moves impulsively at a small angle of attack, at time
 $t = 0^+$
. This reconciles a longstanding disparity between the classical Wagner solution (Wagner Reference Wagner1925) for this start-up flow, in which the shed wake is advected downstream, and the self-similar starting vortex (Pullin Reference Pullin1978) that moves almost perpendicular to the plate. Both solutions are conventionally stated to correctly model the start-up flow for
 $t \gt 0$
.
This study shows that the self-similar starting vortex must first detach from the plate and advect substantially downstream before the Wagner solution becomes applicable. Specifically, the defined detachment time,
 $t_{d}$
, coincides with the annihilation of two stagnation points on the plate in the vicinity of the trailing edge. For
 $t \ll {t_{d}}$
, the starting vortex is found to move predominantly perpendicular to the plate, whereas for
 $t \gg {t_{d}}$
it is advected downstream away from the trailing edge. Even after detachment, a substantial time is required for the vortex to move sufficiently far downstream for its impulse to be accurately approximated by Wagner’s flat vortex-sheet representation.
The early-stage dynamics,
 $t \lesssim {t_{d}}$
, is found to be universal when rescaled by the length scale,
 $L_s(\alpha ) \equiv \alpha ^2 c/4$
. This length scale corresponds to the distance between the trailing edge and the initial position of the stagnation point in the attached flow. It leads to a general expression for the detachment time in (2.1) and (2.2), valid for small angles of attack.
These results reconcile an apparent contradiction between two well-known theoretical predictions and provide new quantitative insight into the starting flow in this canonical problem. The present analysis, based on inviscid theory, remains to be verified by experiment and by direct numerical simulations of the Navier–Stokes equations. The latter could be achieved using the lattice Green’s function method for the Navier–Stokes equations (Hou & Colonius Reference Hou and Colonius2024), which was recently employed to study the short-time, self-similar starting vortices generated by translating and rotating flat plates (Sader et al. Reference Sader, Hou, Hinton, Pullin and Colonius2024). It is also noted that the transition between the short-time, self-similar regime and the long-time advection regime is expected to be insensitive to the initial acceleration ramp-up of the plate, which is inevitable in any experiment, provided that the ramp-up time is short relative to the vortex detachment time.
Acknowledgements.
The authors thank A. Leonard for stimulating discussions.
Declaration of interests.
The authors report no conflicts of interest.
Appendix A. Point-vortex model
In this appendix, the starting vortex generated at the trailing edge of a flat plate lying along the
 $x$
-axis,
 $-c/2 \le x \le c/2$
, in the complex
 $\tilde {z} = x + i y$
plane, where
 $i$
is the imaginary unit, is calculated using the point-vortex model of Rott (Reference Rott1956). The plate is stationary and at a small angle of attack,
 $\alpha$
, to a uniform flow; all symbols are defined above.
The velocity field of the attached flow in the vicinity of the trailing edge is
 \begin{align} u_a -iv_a = -\,U\cos \alpha + \frac {1}{2}\,U\sin \alpha \sqrt {\frac {c}{z}} + O\! \left (|z|^{\tfrac {1}{2}}\right ) \!, \end{align}
where the real and imaginary parts are components in the
 $x$
and
 $y$
directions, respectively, and
 $z \equiv \tilde {z}-c/2$
, with the stagnation point on the upper side of the plate occurring at
 \begin{align} x = s_2 = \frac {c}{4} \sin ^2\alpha , \end{align}
which is the
 $t=0^+$
result for
 $s_2$
.
The point-vortex model of Rott (Reference Rott1956) then gives the following position,
 $z_v$
, and net circulation,
 $\bar {\varGamma } \equiv U c \varGamma$
, of the shed vortex as a function of time
 \begin{align} z_v(t) =i \, 2^{-\tfrac {5}{3}} c^{\tfrac {1}{3}} (U t\sin \alpha )^{\tfrac {2}{3}} , \qquad \bar {\varGamma }(t) = 2^{-\tfrac {1}{3}} c^{\tfrac {2}{3}} (U\sin \alpha )^{\tfrac {4}{3}} t^{\tfrac {1}{3}} , \end{align}
where the point vortex is seen to move in the
 $y$
-direction, i.e. perpendicular to the plate.
The tangential velocity along the upper side of the plate that results from the attached flow,
 $u_a$
, and that induced by the point vortex,
 $u_v$
, in the immediate vicinity of the trailing edge (
 $r \equiv |z|/c \ll 1$
) is
 \begin{align} u_a + u_v = - U \!\left (\! \cos \alpha - \frac{\sin\alpha}{2}\!\left [\frac{1}{r^{1/2}}- \!\left(\!r^{1/2} -\frac{2^{4/3}r}{(Ut\sin\alpha/c)^{1/3}}+\frac{2^{5/3}r^{3/2}}{(Ut\sin\alpha/c)^{2/3}}\!\right)^{\!-1}\right ]\right )\! , \end{align}
whose derivation is involved and omitted for brevity. The stagnation points are then calculated by equating (A4) to zero, giving
 \begin{align} s_{1,2} = \frac {\alpha ^2 c}{16} \left (1+2^{\tfrac {2}{3}} \tau ^{\tfrac {1}{3}}\mp \sqrt {1-2^{\tfrac {5}{3}} \tau ^{\tfrac {1}{3}}-2^{\tfrac {4}{3}} \tau ^{\tfrac {2}{3}}}\right )^2 \! , \end{align}
for
 $\alpha \ll 1$
, where
 $\tau \equiv U t/(\alpha ^2 c)$
with the upper (minus) sign giving
 $s_1$
and the lower (positive) giving
 $s_2$
, which can be re-expressed as
 \begin{align} s_{1,2} = \frac {L_s(\alpha )}{4} \left (1+\tau _s^{\tfrac {1}{3}}\mp \sqrt {1-2 \tau _s^{\tfrac {1}{3}}-\tau _s^{\tfrac {2}{3}}}\right )^2 \! , \end{align}
where
 $\tau _s \equiv Ut/L_s(\alpha )$
. The vortex detachment time,
 $t_{d}$
, then follows from setting
 $s_1=s_2$
, giving
 \begin{align} \frac {\textit{Ut}_{d}}{c} = \frac {1}{4}\big (5\sqrt {2}-7\big )\alpha ^2 \approx 0.017767\alpha ^2. \end{align}
The corresponding dimensionless lift coefficient,
 $C_L$
, can be calculated using equations (3.28) and (3.29) of Pullin & Wang (Reference Pullin and Wang2004), yielding
 \begin{align} C_L = \frac {\pi }{3} \left (\frac {2 c \sin ^5 \! \alpha }{ U t}\right )^{-\tfrac {1}{3}} + \frac {\pi }{7}\sin (2\alpha ) + O\!\left (\left (\frac {U t}{c}\right )^{\tfrac {7}{3}}\right ) \!. \end{align}

 U
 c
 α

 α
 s1
 s2
 s1
 s2

 Utd/c
 α

 Utd/c
 α
 α≪1
 s1
 s2

 α
 α=15∘
 α≤20∘

 CL(t)
 Γ(t)
 α=15∘
 CL=2πα
 1/3
 t≪td
 t/td=102
 a
 b


