


Introduction
Scholars have written extensively on social movements for full woman suffrage and the 1920 ratification of the Nineteenth Amendment. These analyses consider the factors that shaped organizational success (and failure), efforts to mobilize and build support among an often reluctant and disinterested citizenry, and direct and indirect lobbying techniques used to secure the franchise.Footnote 1 Other studies consider what women did (or did not do) with the right to vote after 1920. These accounts are significant in their attempts to debunk the myth of the woman voter; shed light on how political, social, and economic contexts affect women’s electoral participation; and provide insights on the roots of the gender gap and sex and gender stereotypes in modern elections.Footnote 2
Although it is undeniable that the Nineteenth Amendment was an important victory for women seeking the ballot on terms equal to those of men, it was not most American women’s first opportunity to vote. Various forms of partial suffrage were adopted by state governments throughout the late nineteenth and early twentieth centuries. The most notable and widespread of these types of participation was school suffrage, or the ability to vote in elections for municipal and county school officials. More than half of states adopted this policy. By 1900, school suffrage was the only form of suffrage available to women in 19 states.Footnote 3
But to date, scholars know very little about women as voters in school elections. We propose several reasons for this omission. First, because leaders of the National Woman Suffrage Association and other pro-suffrage groups were ambivalent at best about partial suffrage, these incremental gains are often decentered in histories of woman suffrage, including the eponymous account written by National Woman Suffrage Association leaders.Footnote 4 Second, empirical data documenting women voters’ participation is not available in most jurisdictions. Finally, existing studies emphasize schoolhouse reforms and women’s roles as elected and appointed officials rather than women’s participation as voters. Thus, we argue that school suffrage, which provided millions of women an opportunity to directly engage in public affairs and influence policy in an area where they had expertise, is overlooked as a component of late nineteenth and early twentieth century women’s political socialization.
To support this claim, we analyze quantitative and qualitative data on women voters’ participation in Massachusetts school committee elections and Minnesota county superintendent elections. These data reveal that despite the low salience of most school elections, many women took advantage of the opportunity to vote in these contests. Women at times were 10% to 20% of all voters on election day, and turnout above 50% of registered women was not uncommon. The timing of elections, type of school office, and political culture of each state also appears to have affected women’s participation. Minnesota women, voting for a countywide school superintendent in the November general elections, typically outvoted Massachusetts women, who were limited to voting for local school committee members chosen in municipal elections in January, March, or December. These data suggest that scholars of both gender and politics and political participation should more closely consider women’s engagement in school elections prior to the adoption of the Nineteenth Amendment.
Adopting and Implementing School Suffrage
Keyssar’s ground-breaking political history of voting rights notes that “No history of any form of partial suffrage has yet been written.” He further states that details on the adoption and implementation of these policies can be “difficult to pin down.”Footnote 5 Nevertheless, he provides timelines for the adoption of partial voting rights for women, including those that guaranteed the franchise in school elections. Kentucky was the first state to allow school suffrage for “widows and unmarried women who owned property subject to taxation for school purposes” in 1838; Michigan allowed school suffrage for taxpaying women in 1855, followed by Kansas in 1861. Beginning with Colorado in 1876, 14 additional states enacted school suffrage by 1889, with six more states doing so during the 1890s.Footnote 6
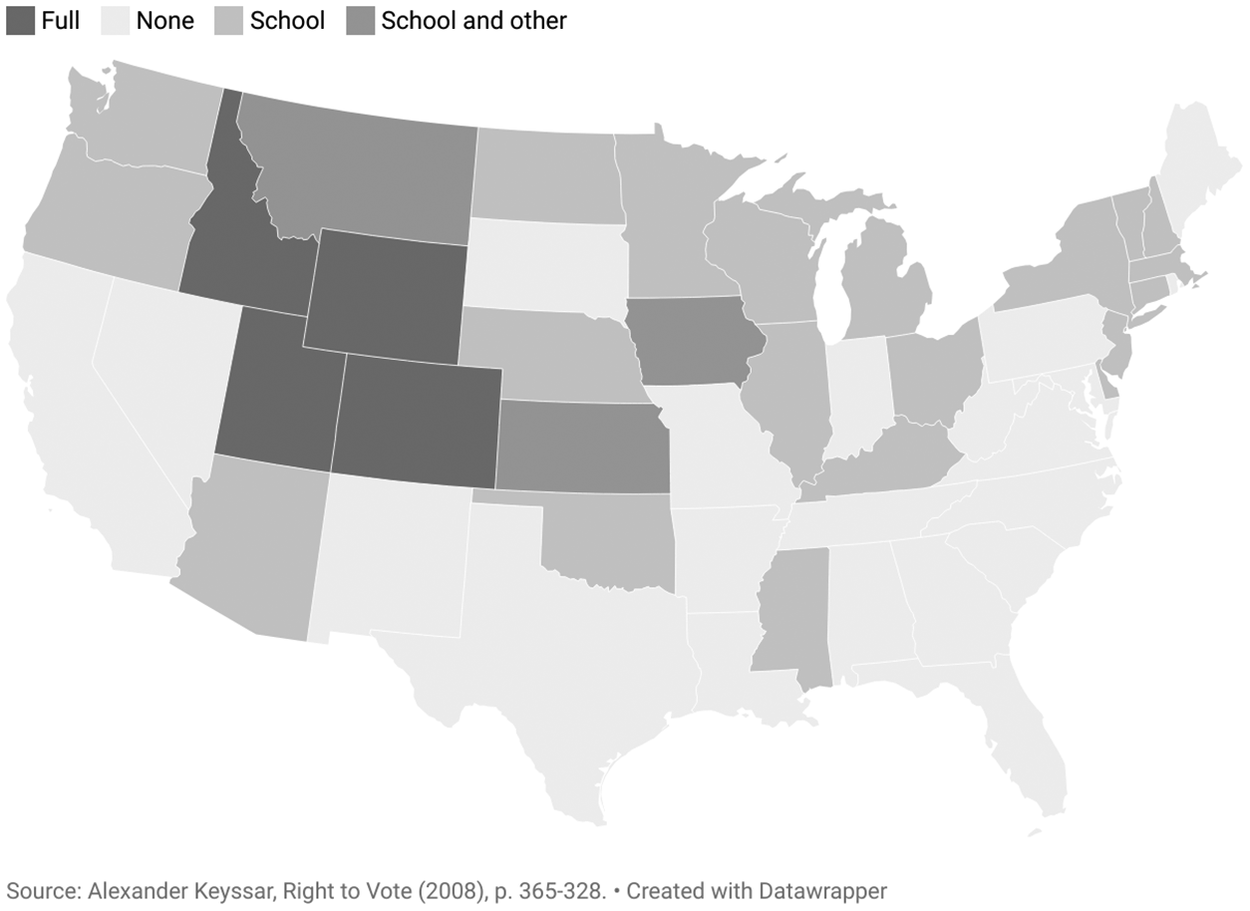
By 1900, school suffrage was available to women in more than half of the states (see Figure 1). Critically, in 19 of these states, representing almost half of the total American female population, school suffrage was the only form of suffrage available to women.Footnote 7 Some post-1876 adoptees (e.g., Mississippi, Iowa, and Delaware) placed restrictions including property ownership, having school-age children, and being the head of the family on women’s ability to vote. But, by the early twentieth century, adult white women in most states could participate without any major restriction.Footnote 8
Women’s Voting Rights, 1900.

Figure 1. Long description
A legend at the top identifies four categories. Full (darkest gray), None (lightest gray), School (medium-light gray), and School and other (medium-dark gray).
* Full voting rights are concentrated in the West, specifically Idaho, Utah, Wyoming, and Colorado.
* School and other rights are found in the Northwest (Washington, Montana), the Midwest (North Dakota, South Dakota, Iowa, Illinois), and parts of the Northeast (New York).
* School-only rights are distributed across the West (Oregon, Nevada, Arizona), the North Central region (Minnesota, Wisconsin, Michigan), and the Northeast (Vermont, New Hampshire, Massachusetts, Connecticut, New Jersey).
* No voting rights (None) cover the largest area, including the entire South (from Texas east to Florida and north to Virginia), the Southwest (New Mexico), and several states in the East and Midwest (California, Nebraska, Kansas, Missouri, Indiana, Ohio, Pennsylvania, West Virginia, Maryland, Delaware, Maine, and Rhode Island).
The adoption of school suffrage, however, was not driven by democratic urges to expand the electorate. Instead, the movement to extend school suffrage to women was “more closely linked to education policies than to election laws”; the primary supporters of these laws were women and others “interested in improving their local schools, not suffragists.”Footnote 9 Advocates argued that granting women the right to vote in school elections would provide another way to improve public education when, particularly in the Midwest and West, schools were rapidly expanding.Footnote 10 They believed that women, who were approximately 80% of teachers by 1910, had unique expertise on the issue.Footnote 11 This was exemplified by women’s efforts in voluntary and community organizations, including the National Education Association, American Federation of Teachers, and parent–teacher associations. Through these organizations, women promoted many educational reforms including compulsory attendance, restructuring school finances, updating and revising curricula, and implementing new methods for classifying and tracking students.Footnote 12 In addition, even before the adoption of school suffrage, women in some jurisdictions served on local and county school boards and as superintendents of schools. Backers believed that school suffrage would only expand these opportunities. Research supports this claim, revealing that school suffrage both expanded the pool of eligible (women) candidates and provided electoral support necessary to bring them to office.Footnote 13
As a result of its roots in education reform, the motivations for the adoption of school suffrage were not always consistent with other attempts to expand women’s right to vote during this period. Suffrage groups were at best ambivalent about the policy; some resisted it outright. Many suffrage leaders saw school suffrage as a distraction and deterrent to full suffrage and the ratification of a national constitutional amendment.Footnote 14 In her account of school suffrage in New York state, Welch notes that school suffrage “lacks a significant place within the [four volume] History of Woman Suffrage,” written by leaders of the National (American) Woman Suffrage Association, even though suffrage groups played a role in its passage in many states.Footnote 15 Further underscoring the complexity of the issue, even anti-suffrage women took an interest in school elections, both as voters and candidates. In Massachusetts, Elizabeth Cabot, president of the Massachusetts Association Opposed to the Further Extension of Suffrage to Women, served on the Brookline school committee for 12 years.Footnote 16
This internal conflict has led historians and scholars of electoral politics to dismiss the importance of school elections. Most accounts assume that voters’ participation in school elections was quite low and that these contests were low-salience, uncompetitive contests.Footnote 17 Much of this derives from Massachusetts, where best available estimates suggest that just 4% of eligible women in the state voted in a nonbinding 1894 municipal suffrage referendum open to any woman able to vote in school elections.Footnote 18 Furthermore, as Thomas notes, “While any election contest could become heated and controversial, there were not usually major campaigns for the right to be on school committees. Often, there was no real contest at all, with voters being asked to vote for three of the following, when only three names appeared on the ballot.”Footnote 19
Why Study Women as Voters in School Elections?
A closer look at school elections during the Gilded Age and the Progressive Era paints a more detailed picture. Although the elections themselves were not highly contested, they often dealt with important issues including school funding, construction, and curricula. At times, they intersected with ethnic and religious divides in communities, encouraging new women to register to vote and shifting the composition of the electorate.Footnote 20 These effects were particularly visible in high-profile elections, including the contentious 1888 Boston school elections that pitted white Protestants against Catholics and led to record levels of mobilization and engagement.Footnote 21 This contest represented the first time that a confluence of forces—religious communities, voluntary associations, and suffrage groups, including the Massachusetts School Suffrage Association—took a deep interest in a school committee election.Footnote 22 Evidence also suggests that women’s turnout was affected by the presence of civil society groups. One study suggests that women’s participation in Massachusetts school committee elections from 1900 to 1909 was higher in smaller urban areas where the Woman’s Christian Temperance Union, the largest politically oriented women’s voluntary association of the late nineteenth century, was organizationally present and had greater per capita membership.Footnote 23
Even more important for democratic governance, school elections provided most women with their first opportunities to vote—that is, to formally and directly participate in government and authorize representatives to speak on their behalf.Footnote 24 Women who voted (or who consciously chose not to vote) were engaging in an activity that affected voice, representation, and, potentially, policy outcomes. The franchise may have also empowered individuals to participate in politics in other ways, including through voluntary associations with broader social agendas and other pathways to civic engagement.Footnote 25
Studying women as voters in school elections also provides an important baseline for studies of women’s political participation after the ratification of the Nineteenth Amendment, which explore the mythology of the woman voter and shed light on how political, social, and economic contexts affect women’s electoral participation.Footnote 26 It also underscores the (sometimes unintended) incremental gains necessary to achieve major changes in public policy, particularly those at the scale of a constitutional amendment. Thus, there is a substantial need to properly describe and evaluate school suffrage and women voters, specifically when, where, and how many women came out to vote.
Measuring Women Voters’ Participation
We must begin by acknowledging that modern measures of turnout based on voting-age or voting-eligible populations are flawed for studying women’s participation in school elections. First, voter registration and eligibility were set by state laws but were implemented at the local level. Even among male voters, eligibility and the registration practices of local administrators are the subjects of much consternation; variations across communities almost certainly arose for women, too.Footnote 27 For example, some jurisdictions arbitrarily enforced “literacy tests” and others maintained inconsistent poll tax records and police lists of eligible voters. In addition, populations shifted frequently due to migration, immigration, and urbanization.Footnote 28 Second, women were only able to register and vote in what are generally regarded as low-salience contests. These contests were often held during local elections, which were not held at the same time as balloting for national and state representatives. Finally, although it was rare, some women faced obstacles to voting. In New York, at least one woman reported having rocks and potatoes thrown at her after she voted in a school election.Footnote 29 And, in Superior, Wisconsin, news accounts suggested that women were “opposed to voting in the tobacco and liquor permeated polls used by men.”Footnote 30
Thus, women’s participation in school elections is better measured using two alternate indicators: the percentage of voters who were women and the percentage of women who were registered to vote who cast a ballot on election day. The former measure directly compares women’s participation with limited suffrage with men’s participation under universal suffrage. Recasting turnout in this way better emphasizes women voters’ presence and potential influence at the polls. The latter measure is how Massachusetts state government and the city of Boston measured turnout during this era for both men and women.Footnote 31 Thus, it is a period-appropriate measure that also has the advantage of focusing only on women prepared to vote.
Method: A Case Study Approach
The most significant obstacle to studying women’s participation in school elections is data, which is not readily available for most states or localities. However, there are systematic data that separates registrants and voters by gender for Massachusetts and Minnesota. The next two subsections describe the data collected for each state, and the third subsection compares the cases. We supplement this quantitative data with qualitative evidence from historical newspaper accounts archived on the Library of Congress’s Chronicling America site and newspapers.com.
Massachusetts
The legislature of the commonwealth of Massachusetts—the first state to require cities and towns with more than 500 residents to establish schools (1827), create a board of education (1837, led by Secretary Horace Mann), and require compulsory public education (1852)—passed a law extending school suffrage to women in 1879. This law restricted voting for school committee members to women, age 21 or over, who owned property or paid a poll tax and met the state’s residency requirements; property requirements or poll taxes were eliminated by 1892.Footnote 32 Like men, women in most communities registered to vote in person, and they voted for school committee elections on ballots designated “For school committee, only.”Footnote 33 The Secretary of the Commonwealth began publishing reports on registration and voting for local elections by 1890 for both men (all races) and women (school committee contests only). These data are available until 1920, when reporting by sex ended with the ratification of the Nineteenth Amendment.Footnote 34
Massachusetts school committee members were nominated by party caucuses (open only to men) and elected for 3-year terms.Footnote 35 These elections aligned with town meetings or local government elections, which were held in March for towns and December or January for cities.
Minnesota
The state of Minnesota adopted school suffrage in a constitutional amendment approved by voters in 1875; subsequent legislation established separate ballot boxes for women (1877) and clarified that women could also vote for county superintendents of schools (1885).Footnote 36 Starting in 1892 and continuing through 1914, tables of election returns printed in various issues of the biennial Legislative Manuals and Minnesota Election Results are provided online by the Minnesota Legislative Reference Library. These tables list a numeric count labeled “Total Names on Register of Electors-Females” (1892) or “Total Number of Ballots Cast and Counted-Females” (1894–1914).Footnote 37 These almost certainly pertain to county superintendent elections; data are not available on local school board elections. All women aged 21 or over who met the state’s residency requirements were able to register and cast a ballot in these contests. Both women and men could register on election day in communities with 12,000 or fewer residents.Footnote 38 As a result, turnout among registered women approached or surpassed 100% in some cases because state records reflect only individuals who were registered prior to election day.
In Minnesota, county superintendents of schools were elected in November of even numbered years for 2-year terms. (In 1914, these became 4-year terms.) These contests were partisan until 1912, when the state moved to nonpartisan county officials. County school superintendents only held authority over common schools outside city and district school systems. The scope of county superintendents’ powers, then, was more limited in some places than others.Footnote 39
Comparing Massachusetts and Minnesota
There are several important differences in the cultural and institutional characteristics that define school elections in Massachusetts and Minnesota. In terms of political culture, Minnesota is an archetypical moralistic state. According to Elazar, moralistic states emphasize citizen participation in elections and the importance of good governance.Footnote 40 Massachusetts generally has an individualistic political culture with some moralistic elements; citizens’ participation is more motivated by personal gain than a concern for good government. Studies of school suffrage in the state observe this tendency. For example, women participated in large numbers in the contentious 1888 Boston school election but at other times women were much less engaged.Footnote 41 This difference in political culture leads us to expect higher levels of participation among women voters in Minnesota than in Massachusetts.
Institutionally, the first major point to note is that Massachusetts reported participation in local school committee elections conducted at annual town or city elections, whereas Minnesota reported participation in contests for county superintendents elected alongside congressional and presidential candidates. Again, this leads us to expect greater participation in Minnesota than in Massachusetts. County-level officials were more prominent and had greater influence and responsibility than those at the local level. Turnout in November elections is also typically higher than in contests held at other times. In addition, women could not participate directly in the selection of candidates at party caucuses in Massachusetts. In Minnesota, women had the ability to vote in primaries for county superintendents by 1906.Footnote 42
Another institutional factor, but one we cannot pinpoint with precision, is the ease of registration and the voter experience. Massachusetts prioritized election integrity during this era, including an 1884 law that stated that no polling place could operate in a building where liquor was sold or had been sold in the past 30 days; this was potentially appealing to women voters. But some localities enacted other policies that restricted women’s participation and representation in government.Footnote 43 For example, to limit the influence of Catholics and Democrats, Boston enacted reforms in 1905 that made school committee elections nonpartisan and reduced the size of the school committee from 25 to five members. This policy had the practical effect of eliminating entirely women’s presence on the school board (and reducing their turnout in city elections) from 1906 to 1917.Footnote 44 For Minnesota, we have found no such evidence. Efforts to restrict access in Massachusetts may reflect the state’s individualistic tendencies and growing partisan, religious, and ethnic divisions, but there is no systematic way to assess this.
Finally, we do not consider the degree to which elections were competitive. There are no data for individual candidates’ vote totals for most Massachusetts school committee elections, so we cannot make comparisons. Certainly, however, competitiveness incentivized or deterred women voters’ participation in particular years. In Minnesota, newspapers occasionally mentioned that women did not vote because there was only a single male candidate running unopposed.Footnote 45 Studies of these race-specific dynamics would be an excellent topic for future study (See Discussion and Conclusion.).
Quantitative Analysis
How Many Women Were Voters?
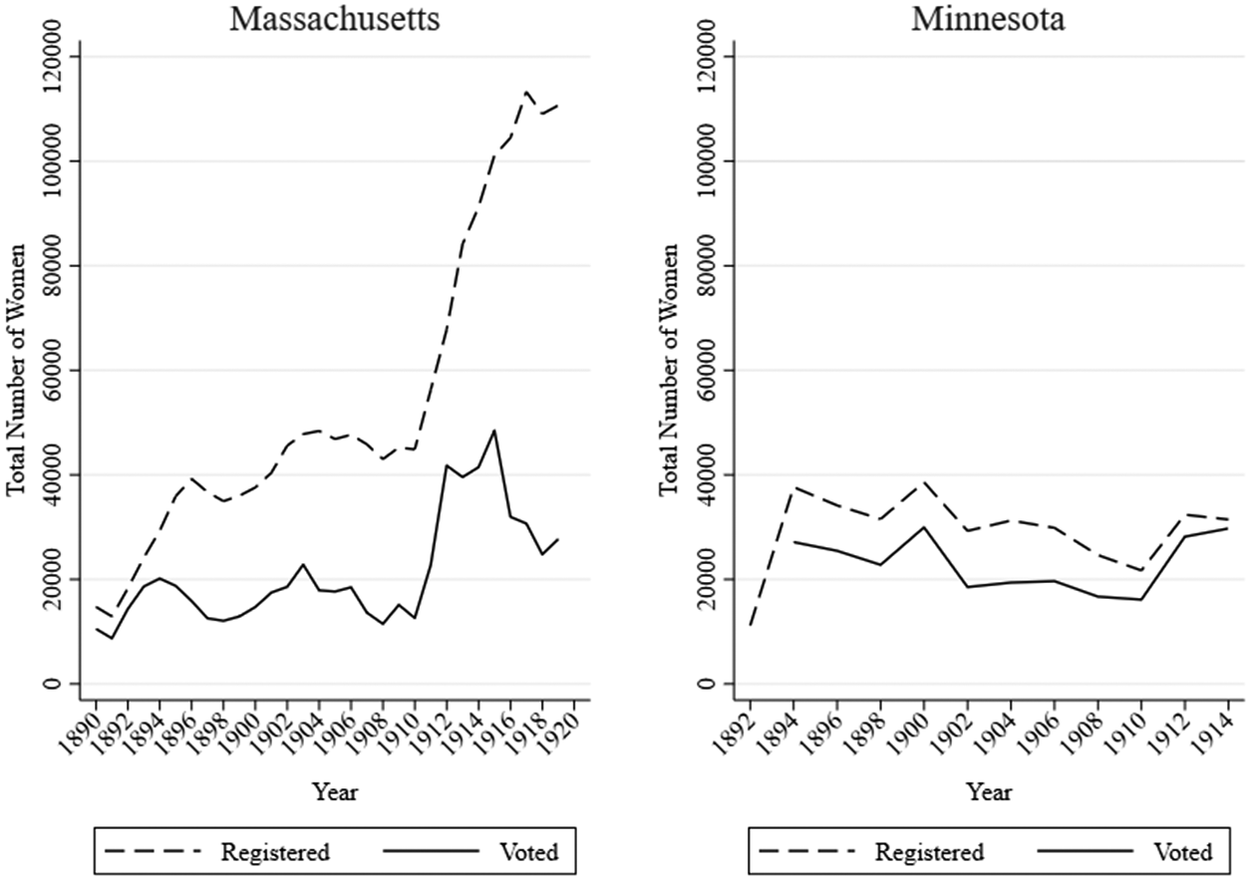
We begin by exploring the number of women registered to vote and voting in Massachusetts (1890–1919, annually) and in Minnesota (1892–1914, biennially). As Figure 2 illustrates, significant numbers of women in these states registered to vote and cast ballots throughout the late nineteenth and early twentieth centuries, even if these were a small portion of the total female population. In Massachusetts, which had just over a million women residents over age 20 in 1900, approximately 1%–2% of the female population voted in the average year. This compares to approximately 35% of the total male population voting in the 1900 presidential election; smaller percentages of men typically voted in state and municipal elections. The largest increases in women’s registration (and, to a lesser extent, voting) began in 1910. Prior to 1910, between 10,000 and 20,000 women voted annually in school elections. Twice, more than 20,000 women voted (1894 and 1903); only once did less than 10,000 women cast ballots (1891).
Total Number of Women Registered to Vote and Voting in Massachusetts School Committee (1890–1919) and Minnesota County Superintendent of Schools (1892–1914) Elections.

Figure 2. Long description
A two-panel line graph. Both panels share a Y-axis titled Total Number of Women, ranging from 0 to 120,000 in increments of 20,000. The X-axis is titled Year. A legend at the bottom indicates a dashed line for Registered and a solid line for Voted.
* Left Panel (Massachusetts): Covers years 1890 to 1920. Registration (dashed line) starts near 15,000, fluctuates between 35,000 and 50,000 until 1910, then sharply increases to over 110,000 by 1918. Voting (solid line) remains lower, fluctuating between 10,000 and 20,000 until 1910, peaking near 50,000 in 1916, and ending near 30,000.
* Right Panel (Minnesota): Covers years 1892 to 1914. Registration (dashed line) starts at 10,000, peaks near 40,000 in 1900, and fluctuates between 20,000 and 35,000 for the remainder of the period. Voting (solid line) follows a similar pattern but at a lower volume, starting near 25,000 in 1894 and fluctuating between 15,000 and 30,000 through 1914.
In Minnesota, the number of women voters always totaled at least 15,000 of approximately 240,000 female inhabitants over age 20, or at least 6% of the female population. Men’s turnout was also higher in Minnesota than in Massachusetts. In the 1900 presidential election, about 50% of the male population cast a ballot. In five of the years shown here, the number of women voters in Minnesota was between 15 and 20,000. And, in 6 years, more than 20,000 women voted, with two of these years recording just below 30,000 women voters; this represents more than 10% of the total female population.
These data reveal that, despite substantial constraints, tens of thousands of women consistently participated in school elections in both Minnesota and Massachusetts. An argument can be made that if male franchise was restricted to only certain low-salience, off-cycle contests, their turnout would be quite similar.
What Proportion of Voters Were Women?
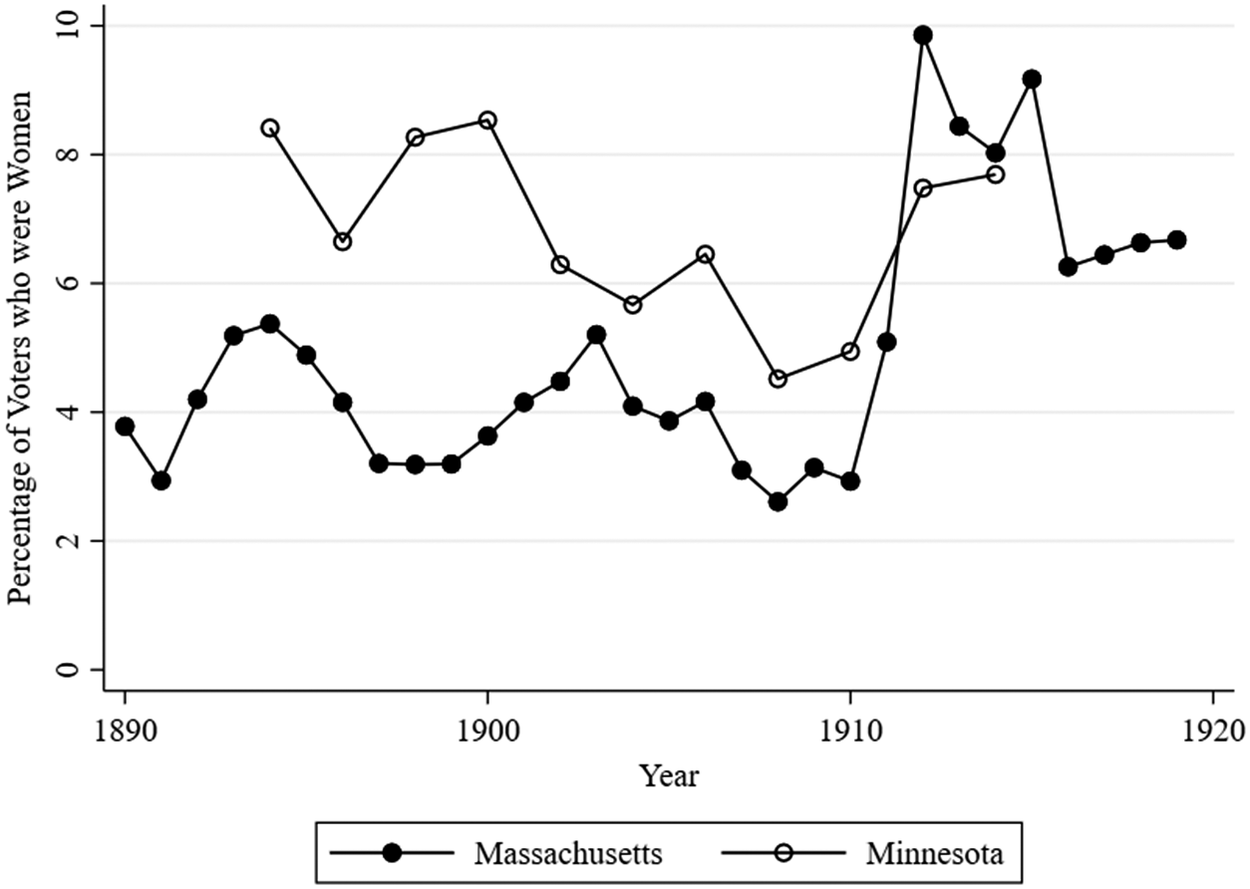
The next step is to evaluate the degree to which women voted relative to men. Figure 3 displays the percentage of all voters in each of these contests who were women. Approximately 4% of voters in Massachusetts school elections from 1890 to 1900 were women, 3.77% from 1901 to 1910, and 7.4% from 1911 to 1919—almost double that of the previous decade. In Minnesota, 7.97% of all voters in county superintendent contests from 1894 to 1900 were women, 5.57% from 1902 to 1910, and 7.58% in the 1912 and 1914 elections.
Percentage of Voters who were Women in Massachusetts School Committee (1890–1919) and Minnesota County Superintendent of Schools (1892–1914) Elections.

Figure 3. Long description
The X-axis is labeled Year, ranging from 1890 to 1920 in increments of 10. The Y-axis is labeled Percentage of Voters who were Women, ranging from 0 to 10 in increments of 2.
Two data series are plotted:
* Massachusetts (solid black circles): Starts at approximately 3.8 percent in 1890. It fluctuates between 3 and 5.5 percent until 1910. After 1910, it shows a sharp spike, peaking at nearly 10 percent around 1912, before dropping and stabilizing between 6 and 7 percent toward 1919.
* Minnesota (open circles): Data begins in 1894 at approximately 8.5 percent. It follows a general downward trend with significant volatility, reaching a low of about 4.5 percent in 1908. It then rises to nearly 8 percent by 1914, where the data series ends.
Horizontal grid lines are present at every 2-percent interval on the Y-axis.
Figure 4 illustrates the significant variations in women as a percentage of all voters across states and jurisdictions. In this strip plot, each hollow circle represents a town (Massachusetts) or county (Minnesota). As is evident, in many Massachusetts towns, and especially after 1910, more than 10% (1 in 10) of voters were women. Likewise, in some Minnesota counties, women consistently comprised 20% (1 in 5) or more of all voters.
Voters who were Women in Massachusetts (1890–1919) and Minnesota (1892–1914), by Town or County and Year.

Figure 4. Long description
A two-panel dot plot.
Left Panel: Massachusetts.
The x-axis is labeled Percentage of Voters who were Women, ranging from 0 to 60. The y-axis is labeled Year, listing every year from 1890 at the bottom to 1919 at the top. For each year, a horizontal row of open circles represents individual towns or counties. The data is heavily clustered between 0 and 10 percent for all years. A few outliers extend toward 40 percent in the early 1900s, with one significant outlier reaching nearly 60 percent in 1916.
Right Panel: Minnesota.
The x-axis is labeled Percentage of Voters who were Women, ranging from 0 to 60. The y-axis is labeled Year, listing even-numbered years from 1894 at the bottom to 1914 at the top. The data points are more sparse than the Massachusetts panel. Most data is clustered between 0 and 20 percent. In 1896, there is a notable outlier at 50 percent. By 1914, the distribution is more spread out between 0 and 35 percent compared to the earlier years in the same panel.
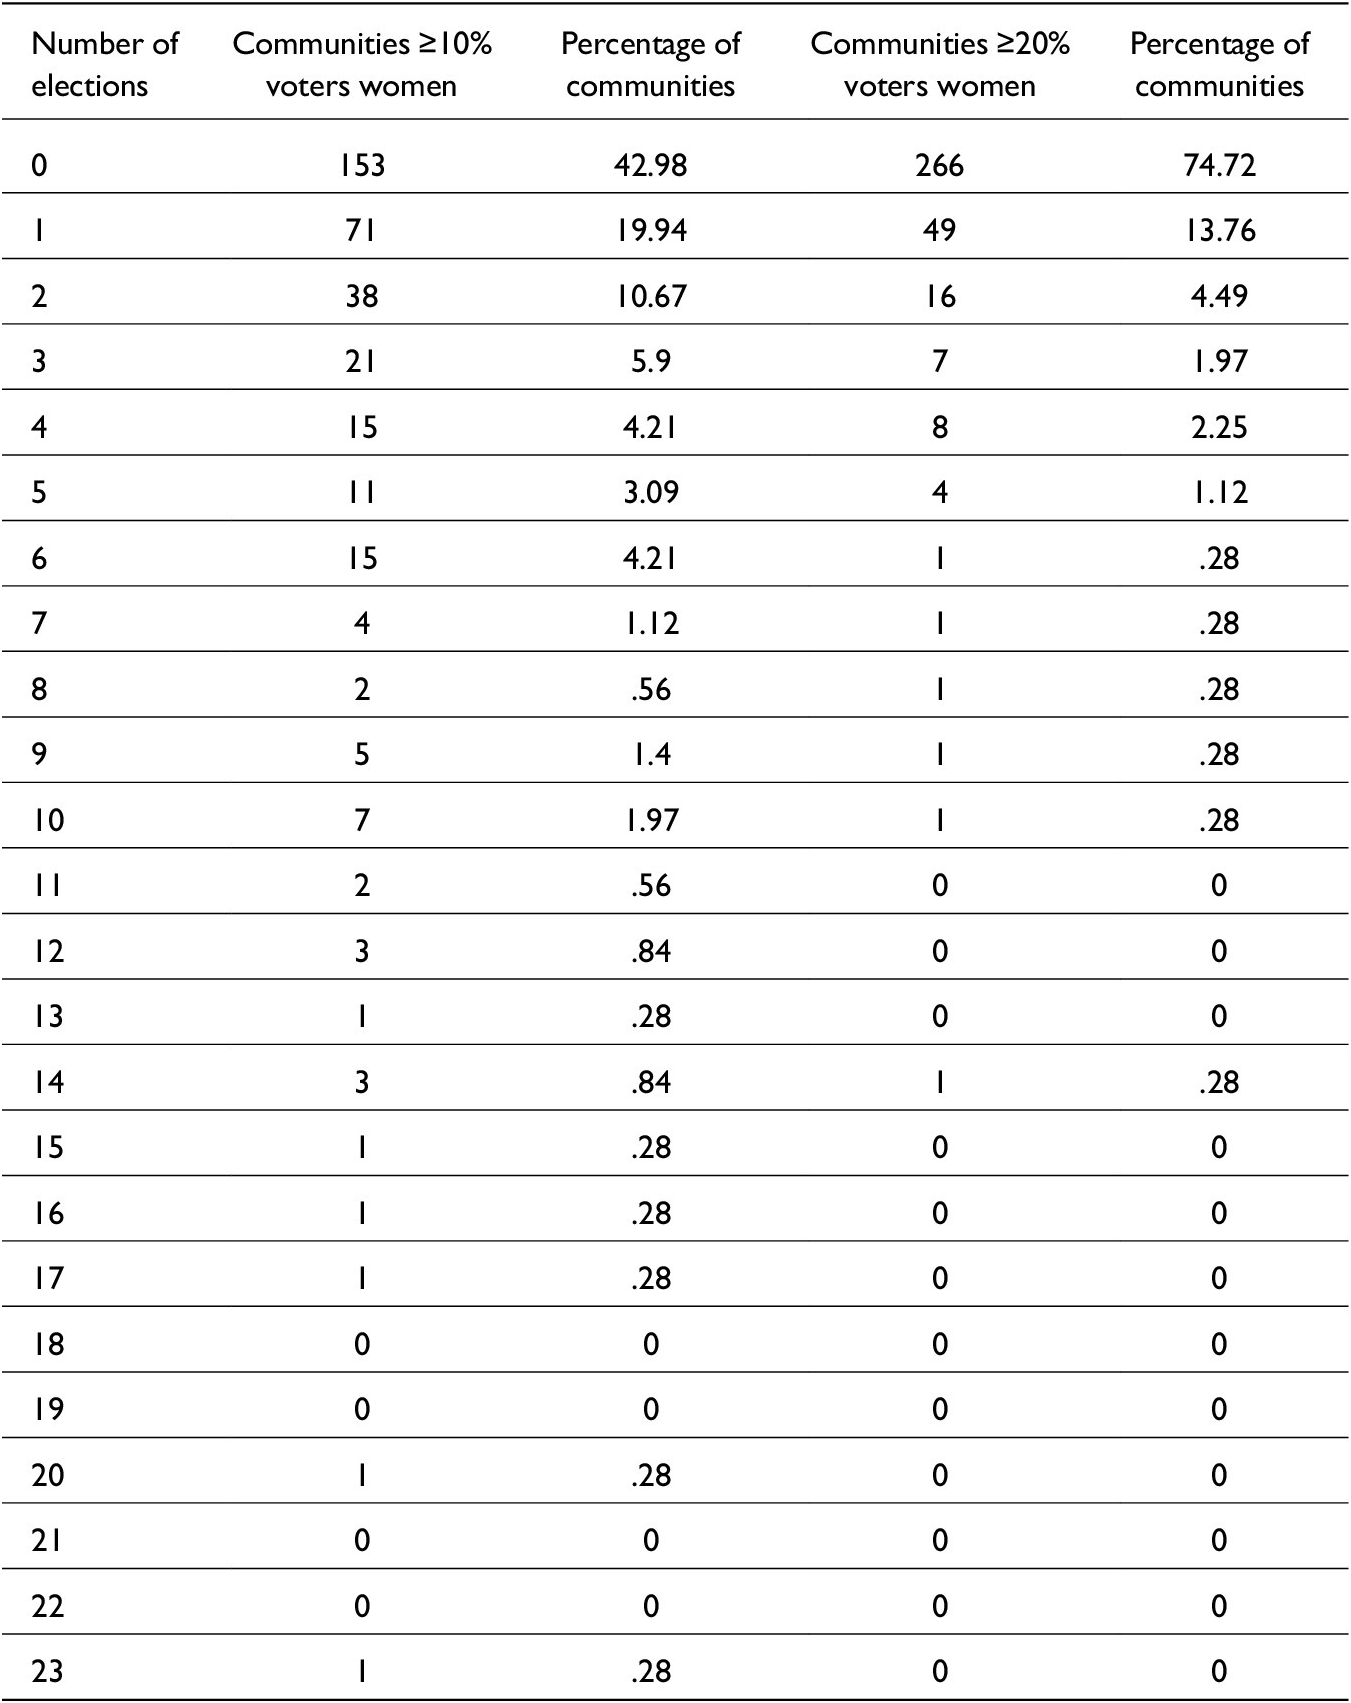
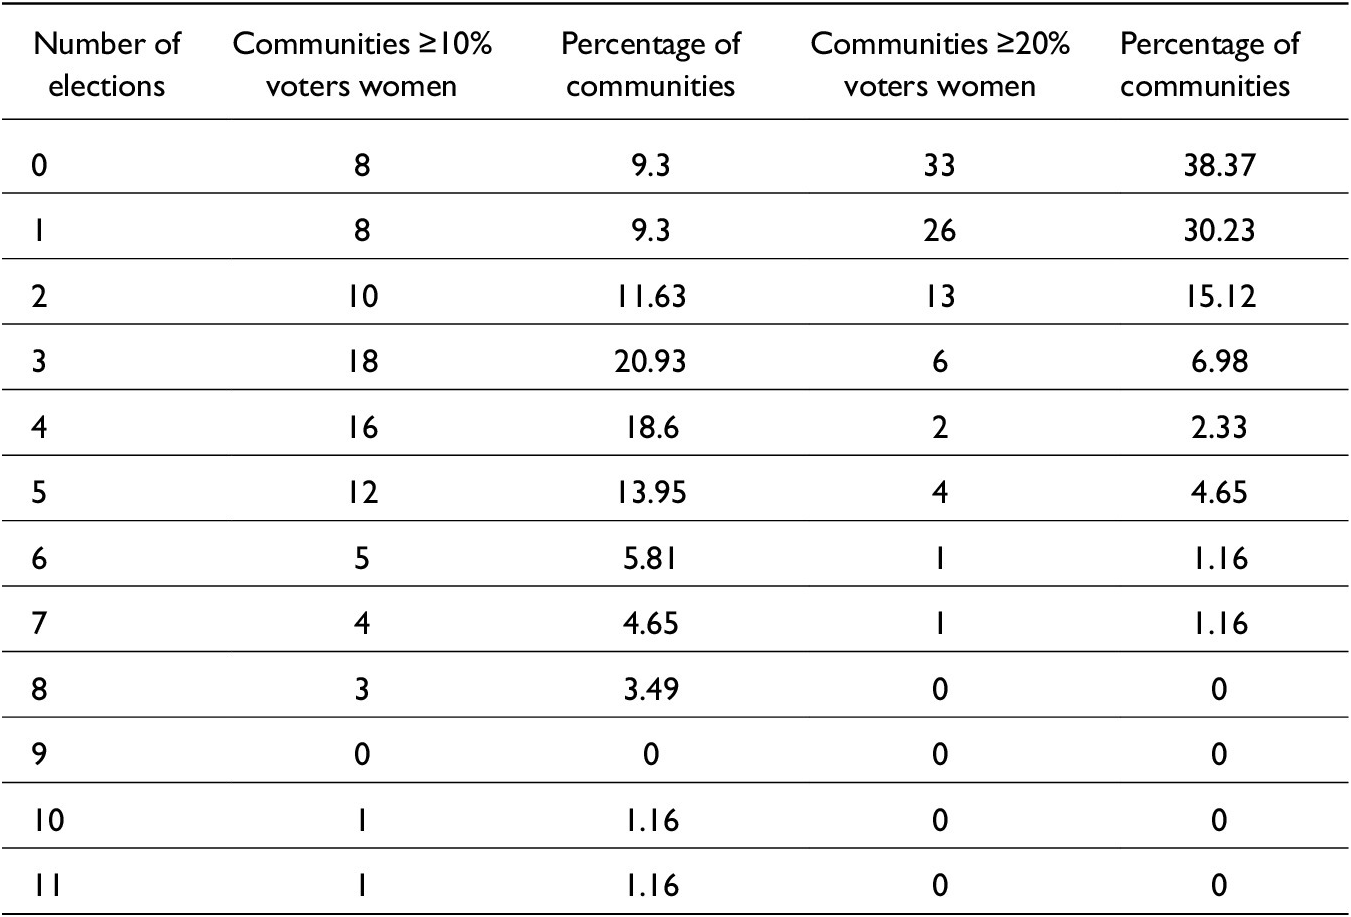
The proportion of voters who were women clearly varied within jurisdictions and over time. As shown in Table 1 (Massachusetts) and Table 2 (Minnesota), most communities had at least one election where 10% or more of voters were women: 57.02% of communities over 30 elections in Massachusetts and 90.7% of counties over 11 elections in Minnesota. Nearly 20% of Massachusetts communities met the 10% threshold only once; an additional 10.67% met this threshold just twice. In contrast, in Minnesota, 53.48% of counties met or exceeded the 10% threshold three to five times; an additional 20.93% met the threshold once or twice. There continue to be variations in women’s participation across states at the 20% or more threshold; 27.28% of Massachusetts communities met this threshold at least once, versus to 61.63% of Minnesota counties.
Number of Massachusetts Communities with 10% and 20% or More of Voters Being Women, by Number of Elections, 1890–1919

Table 1. Long description
The table consists of five columns: Number of elections, Communities greater than or equal to 10 percent voters women, Percentage of communities, Communities greater than or equal to 20 percent voters women, and Percentage of communities.
Key data points include:
* 0 elections: 153 communities (42.98 percent) had at least 10 percent women voters; 266 communities (74.72 percent) had at least 20 percent women voters.
* 1 election: 71 communities (19.94 percent) at the 10 percent threshold; 49 communities (13.76 percent) at the 20 percent threshold.
* 2 elections: 38 communities (10.67 percent) at the 10 percent threshold; 16 communities (4.49 percent) at the 20 percent threshold.
* 5 elections: 11 communities (3.09 percent) at the 10 percent threshold; 4 communities (1.12 percent) at the 20 percent threshold.
* 10 elections: 7 communities (1.97 percent) at the 10 percent threshold; 1 community (0.28 percent) at the 20 percent threshold.
* 20 elections: 1 community (0.28 percent) at the 10 percent threshold; 0 communities at the 20 percent threshold.
* 23 elections: 1 community (0.28 percent) at the 10 percent threshold; 0 communities at the 20 percent threshold.
The data shows a sharp decline in the number of communities as the frequency of elections with high female turnout increases, with most communities never reaching the 20 percent threshold in any election.
Number of Minnesota Communities with 10% and 20% or More of Voters Being Women, by Number of Elections, 1894–1914

Table 2. Long description
The table consists of five columns: Number of elections, Communities greater than or equal to 10 percent voters women, Percentage of communities (for the 10 percent group), Communities greater than or equal to 20 percent voters women, and Percentage of communities (for the 20 percent group).
* 0 elections: 8 communities (9.3 percent) at the 10 percent threshold; 33 communities (38.37 percent) at the 20 percent threshold.
* 1 election: 8 communities (9.3 percent) at 10 percent; 26 communities (30.23 percent) at 20 percent.
* 2 elections: 10 communities (11.63 percent) at 10 percent; 13 communities (15.12 percent) at 20 percent.
* 3 elections: 18 communities (20.93 percent) at 10 percent; 6 communities (6.98 percent) at 20 percent.
* 4 elections: 16 communities (18.6 percent) at 10 percent; 2 communities (2.33 percent) at 20 percent.
* 5 elections: 12 communities (13.95 percent) at 10 percent; 4 communities (4.65 percent) at 20 percent.
* 6 elections: 5 communities (5.81 percent) at 10 percent; 1 community (1.16 percent) at 20 percent.
* 7 elections: 4 communities (4.65 percent) at 10 percent; 1 community (1.16 percent) at 20 percent.
* 8 elections: 3 communities (3.49 percent) at 10 percent; 0 communities at 20 percent.
* 9 elections: 0 communities at both thresholds.
* 10 elections: 1 community (1.16 percent) at 10 percent; 0 communities at 20 percent.
* 11 elections: 1 community (1.16 percent) at 10 percent; 0 communities at 20 percent.
How Many Registered Women Voted?
Finally, we consider the percentage of women registered to vote who cast a ballot. This measure reflects turnout among women who had already overcome the potential obstacles of knowledge, access, and eligibility required to register. We expect these percentages to be much higher than previous indicators of women’s turnout. In interpreting these data, readers should also keep in mind that Massachusetts did not permit same-day registration, but most locations in Minnesota allowed women to register on the day of the election. Thus, turnout among “registered” voters (prior to election day) could surpass 100%.
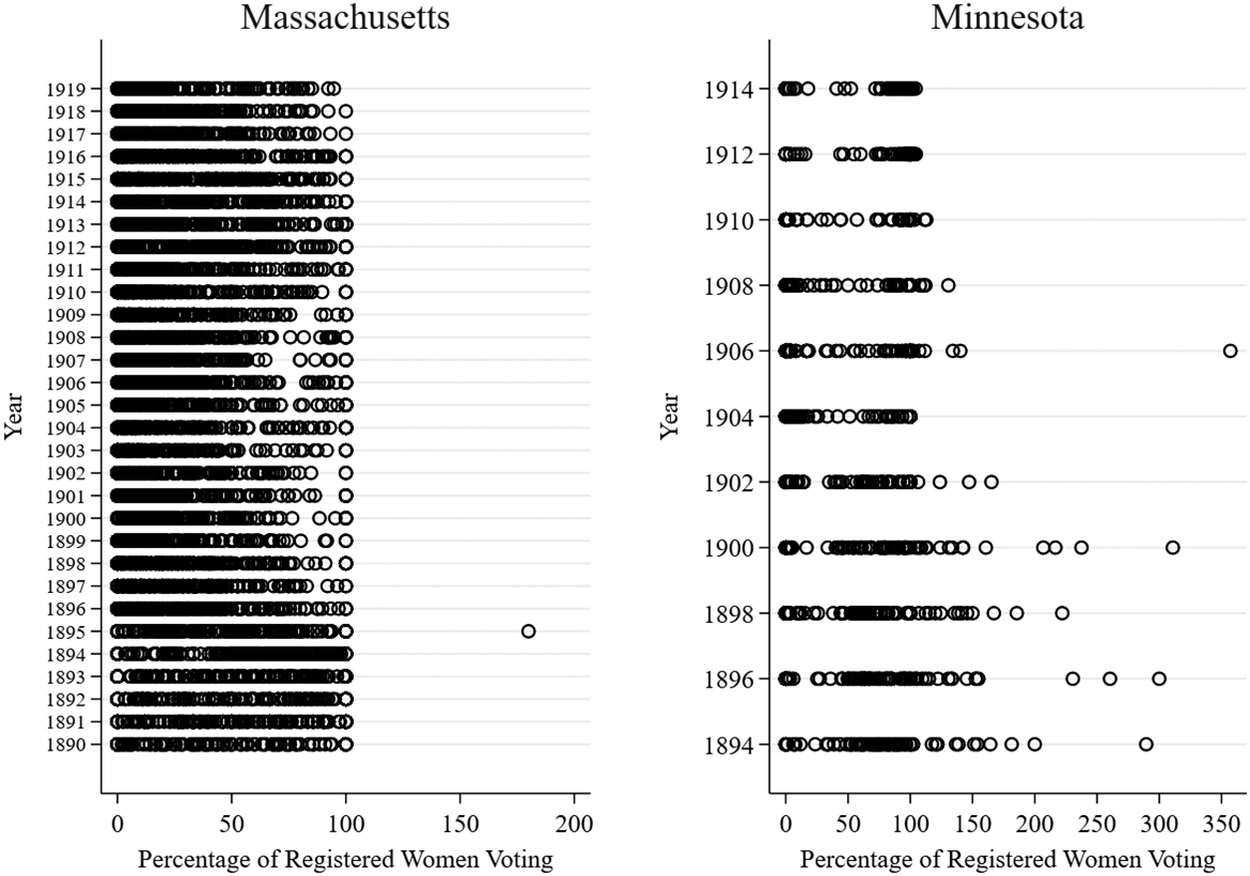
Paralleling Figure 4, Figure 5 illustrates the significant variations in the percentage of registered women who voted across states and jurisdictions. This strip plot makes clear that the percentage of registered women who cast a ballot was relatively high in both states. In Massachusetts, it was not uncommon for turnout to be between 50% and 100% of registered women.Footnote 46 And in Minnesota, because of same-day registration, over 200% of registered women voted in some elections, particularly in the 1890s. These numbers suggest that—when implemented in a way that maximized accessibility—school suffrage was not only used but was occasionally in demand. Turnout among registered women could be quite high.
Percentage of Registered Women Voters in Massachusetts (1890–1919) and Minnesota (1892–1914), by Town or County and Year.

Figure 5. Long description
The figure consists of two side-by-side dot plots.
Left Panel: Massachusetts.
The y-axis is labeled Year and ranges from 1890 at the bottom to 1919 at the top in one-year increments. The x-axis is labeled Percentage of Registered Women Voting and ranges from 0 to 200. For every year, there is a dense horizontal cluster of open circles concentrated between 0 and 100 percent. A single outlier is visible in 1895, positioned far to the right at approximately 180 percent.
Right Panel: Minnesota.
The y-axis is labeled Year and ranges from 1894 at the bottom to 1914 at the top in two-year increments. The x-axis is labeled Percentage of Registered Women Voting and ranges from 0 to 350. The data points are more dispersed than in the Massachusetts panel. While the majority of circles are clustered between 0 and 100 percent, there are numerous outliers extending to the right in almost every year shown. Notable extreme outliers appear at approximately 300 percent in 1894 and 1896, and one reaching over 350 percent in 1906.
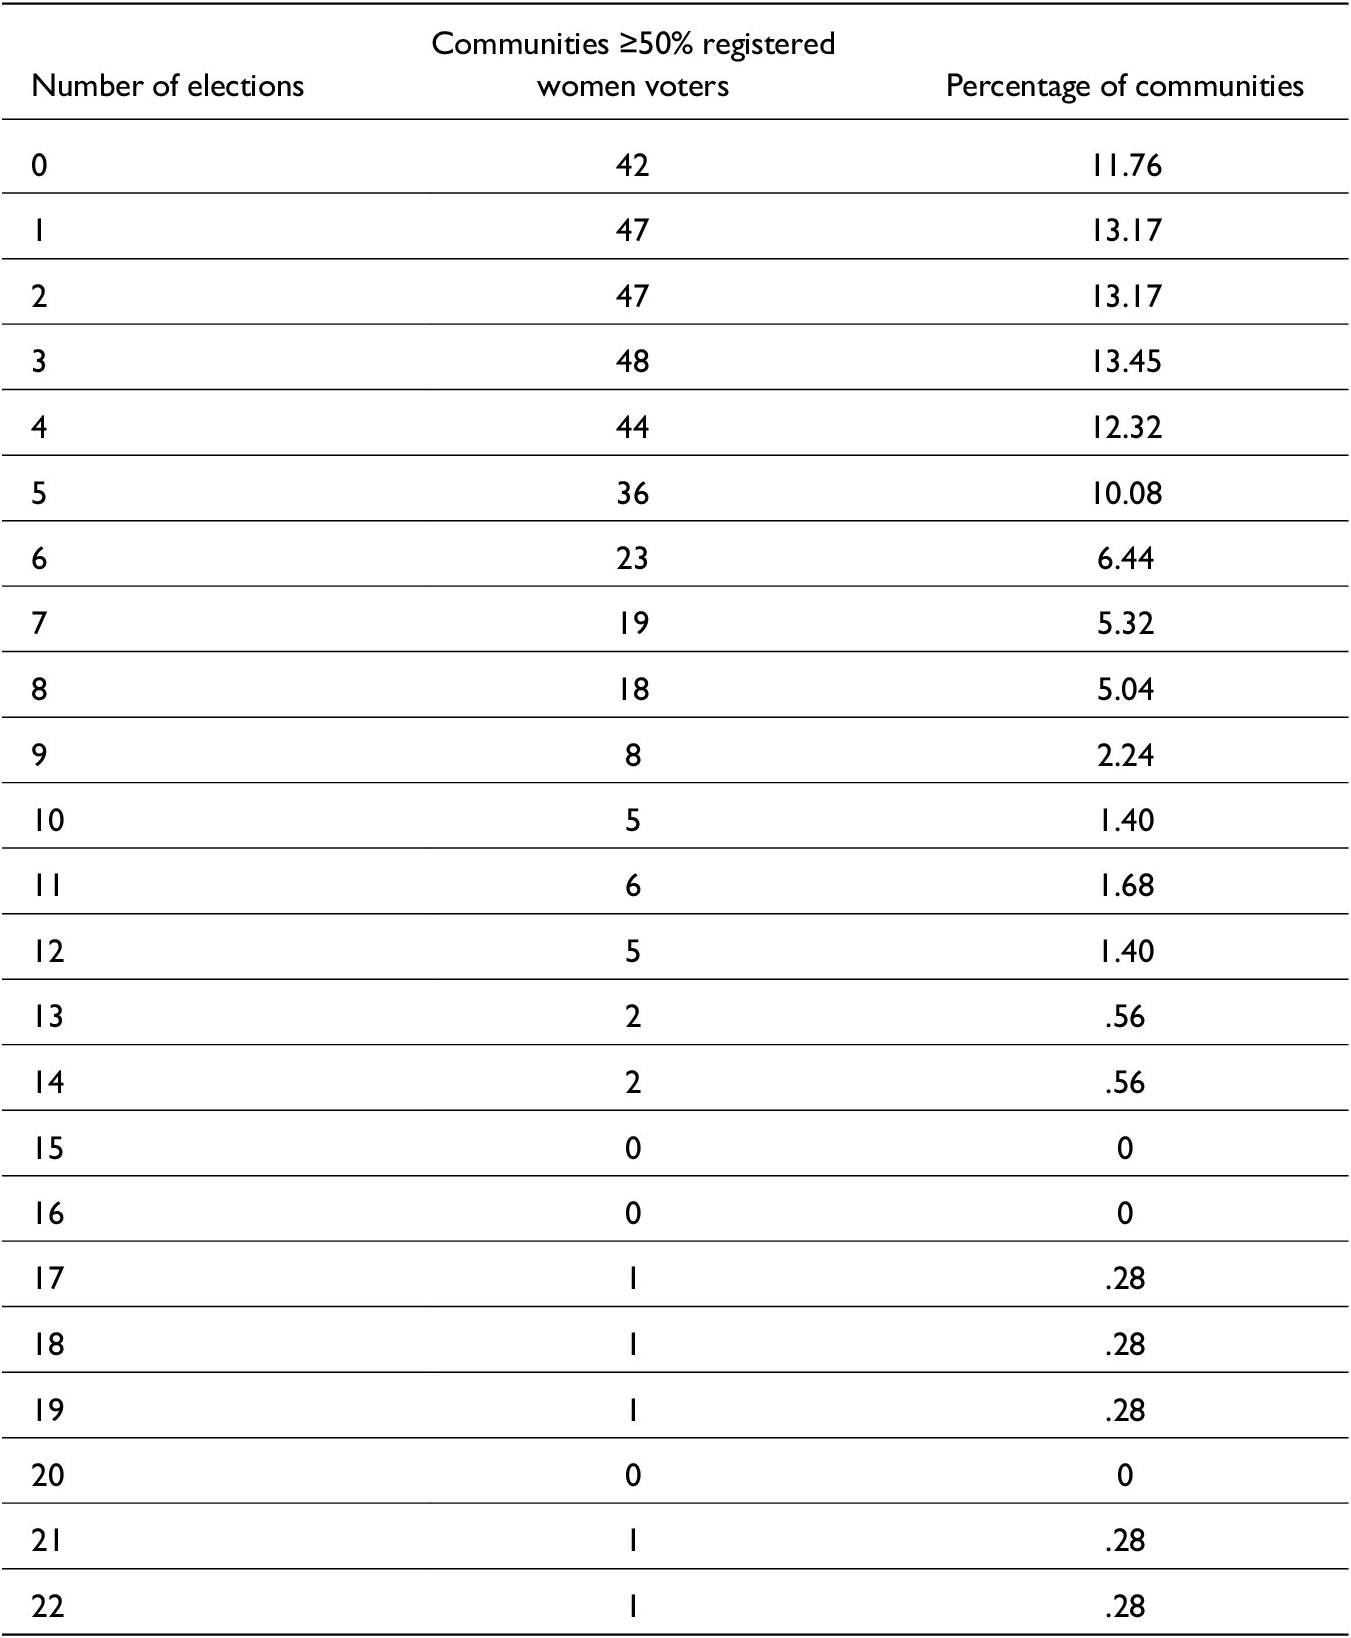
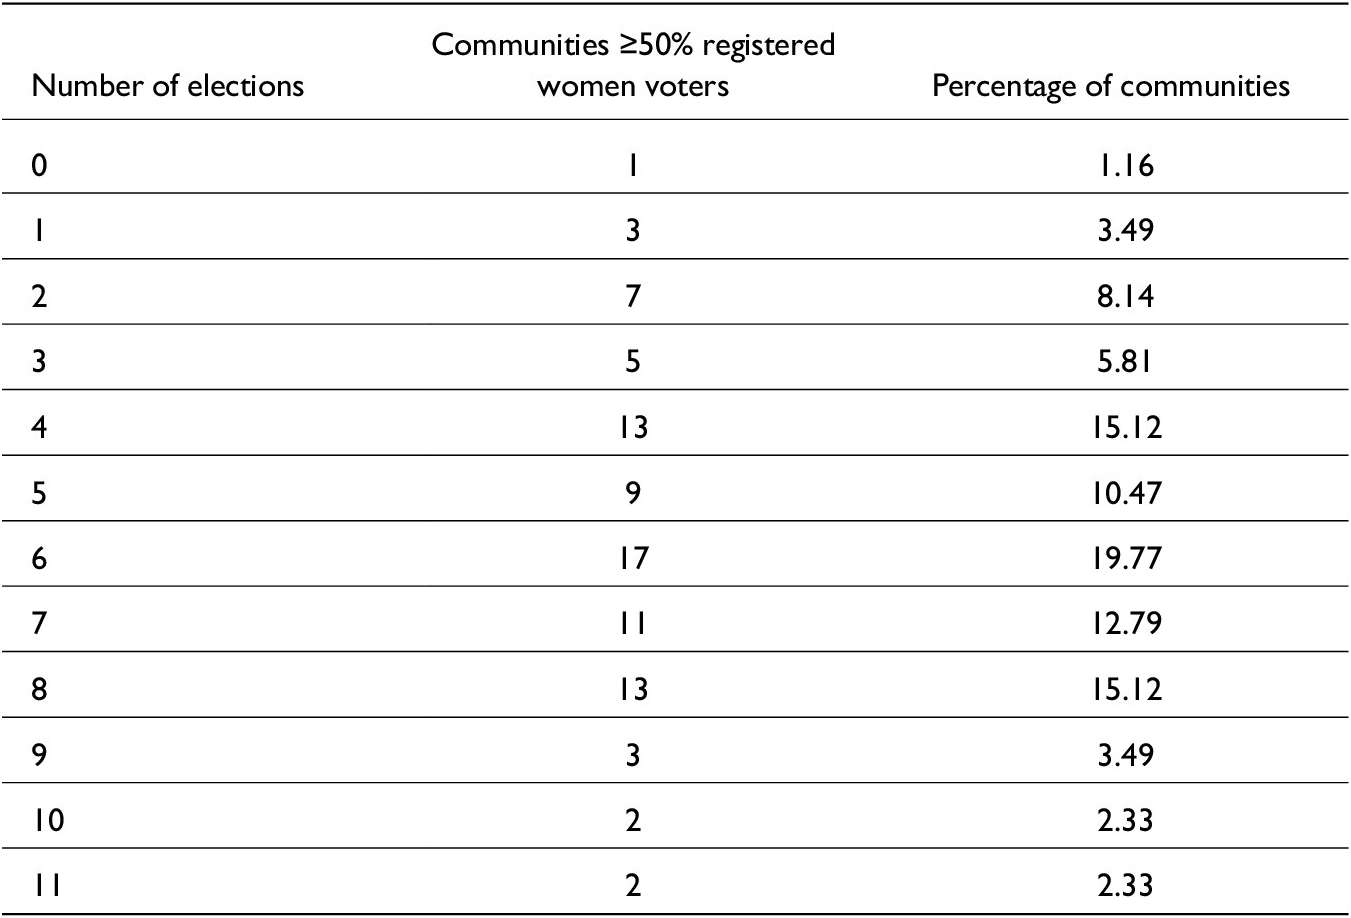
To understand how turnout was distributed across communities, Table 3 (Massachusetts) and Table 4 (Minnesota) provide counts of the number of elections in a community where 50% or more of registered women voted. In Massachusetts, most communities (88.24%) had at least one election in which 50% or more of registered women voted, with most towns and cities (62.19%) hitting this mark between one and five times. Seven percent of communities had 10 or more elections where more than half of registered women cast a ballot. In Minnesota, only one county of the 86 studied never had 50% turnout among registered women. Critically, more than half (55.83%) of all counties had 50% or higher turnout in most election years. Registered women in Minnesota frequently turned out to vote for county superintendents.
Number of Massachusetts Communities with 50% or More of Registered Women Voted, by Number of Elections, 1890–1919

Table 3. Long description
The table consists of three columns: Number of elections, Communities with greater than or equal to 50 percent registered women voters, and Percentage of communities.
* 0 elections: 42 communities (11.76 percent)
* 1 election: 47 communities (13.17 percent)
* 2 elections: 47 communities (13.17 percent)
* 3 elections: 48 communities (13.45 percent)
* 4 elections: 44 communities (12.32 percent)
* 5 elections: 36 communities (10.08 percent)
* 6 elections: 23 communities (6.44 percent)
* 7 elections: 19 communities (5.32 percent)
* 8 elections: 18 communities (5.04 percent)
* 9 elections: 8 communities (2.24 percent)
* 10 elections: 5 communities (1.40 percent)
* 11 elections: 6 communities (1.68 percent)
* 12 elections: 5 communities (1.40 percent)
* 13 elections: 2 communities (0.56 percent)
* 14 elections: 2 communities (0.56 percent)
* 15 elections: 0 communities (0 percent)
* 16 elections: 0 communities (0 percent)
* 17 elections: 1 community (0.28 percent)
* 18 elections: 1 community (0.28 percent)
* 19 elections: 1 community (0.28 percent)
* 20 elections: 0 communities (0 percent)
* 21 elections: 1 community (0.28 percent)
* 22 elections: 1 community (0.28 percent)
The data shows a peak at 3 elections and a general decline in the number of communities as the number of high-turnout elections increases.
Number of Minnesota Communities with 50% or More of Registered Women Voted, by Number of Elections, 1894–1914

Table 4. Long description
The table consists of three columns and twelve data rows.
* Row 1: 0 elections, 1 community, 1.16 percent.
* Row 2: 1 election, 3 communities, 3.49 percent.
* Row 3: 2 elections, 7 communities, 8.14 percent.
* Row 4: 3 elections, 5 communities, 5.81 percent.
* Row 5: 4 elections, 13 communities, 15.12 percent.
* Row 6: 5 elections, 9 communities, 10.47 percent.
* Row 7: 6 elections, 17 communities, 19.77 percent.
* Row 8: 7 elections, 11 communities, 12.79 percent.
* Row 9: 8 elections, 13 communities, 15.12 percent.
* Row 10: 9 elections, 3 communities, 3.49 percent.
* Row 11: 10 elections, 2 communities, 2.33 percent.
* Row 12: 11 elections, 2 communities, 2.33 percent.
Contextualizing the Data
Across the three measures of women’s voting (total number, as a percentage of all voters, and as a percentage of registered female voters), we provide clear evidence that women used their school suffrage rights. Participation was noticeably higher in Minnesota than in Massachusetts, likely dictated by a host of factors, including the type of school officer being elected, the timing of elections, ease of registration, and political culture.
Newspaper accounts from both Massachusetts and Minnesota provide insights beyond the data. However, accounts are more limited than one might expect. It appears that women voters were not a topic that especially animated newspaper editors. This may be testimony to the fact that by the early twentieth century, women’s participation was not considered especially novel or newsworthy in these states. For example, one 1912 account in the New Bedford (Massachusetts) Standard-Times noted that more than 2,000 women from all walks of life had cast ballots in the city’s school elections, remarking that the “arrival of the feminine voters arised no undue attention.”Footnote 47
Beyond this, the Boston Globe routinely mentioned women’s turnout in ward reports at city elections and noted at times when women poll workers were present.Footnote 48 Although it is significant that women’s participation merited note, it is equally important to underscore that this coverage was not a special headline or news story. It was reported as a matter of fact in broader content about municipal elections.
Outside Boston, many cities and towns celebrated women’s participation and attributed it to the strong civil society (such as women’s colleges and clubs) present in these communities. This suggests that in areas where the state’s moralistic tendencies were more prevalent than its individualistic urges, women were welcomed and celebrated as voters. For example, an 1897 article on Nantucket women documented the island’s many women’s clubs, including one prominent group affiliated with Sorosis (the precursor to the General Federation of Women’s Clubs). The article noted that these groups were not purely social: “181 women vote for school committee and for several years there have been two or three of their number working acceptably on the board.”Footnote 49 And, in Holyoke, a 1915 report noted that “women are taking politics seriously” and that more than 600 additional women were likely to register to vote in the upcoming, highly competitive school committee contest.Footnote 50
Still, much of the time, Massachusetts women’s participation remained low. As a newspaper article by prominent women’s rights activist Mary Livermore suggested, this was perhaps because women were kept from the political processes of nominating candidates and able to vote only in low-salience, often uncompetitive, local school committee elections. Of women’s limited franchise, Livermore wrote, “Before they can use this fragment of a right they are required to observe all the usages and forms which give men the full ballot. How many men could be dragooned to the polls under similar circumstances?”Footnote 51 Indeed, the Boston Globe articles noted above also highlight the disappointing participation of men in early twentieth century city elections relative to their participation in congressional and presidential contests.Footnote 52 This may be attributable to the partisan (including political machines), religious, and ethnic cleavages in city politics, highlighting both cultural and institutional reasons why fewer women voted in Massachusetts than Minnesota.
In Minnesota, coverage of women’s participation was even more straightforward. When newspapers printed ballots for the upcoming county elections, the women’s ballot was included; it was an accepted feature of the general elections and, by 1906, primary contests.Footnote 53 When women did not vote, their low turnout was occasionally noted, with the common reason being that there was no competition for county superintendent. For example, one 1906 report noted, “There was no contest for superintendent and therefore nothing to call the women out, however much interest they might take in the schools.”Footnote 54
Generally speaking, though, women’s participation in Minnesota was common enough that in 1893, one Chicago company used women voting in school elections as a hook for a soap advertisement!Footnote 55 “Women Will Vote as usual at the next school election—but for many candidates,” the ad noted. But “They give a unanimous vote—every day in the week—in favor of KIRK’S WHITE RUSSIAN SOAP.” This underscores the idea that women’s school suffrage in the moralistic state of Minnesota was routine and accepted, reflecting closely the patterns observed in the data.
Discussion and Conclusion
This article explores how the adoption of school suffrage contributed to late nineteenth and early twentieth-century women’s political socialization by providing women with, in many cases, their first opportunities to participate directly in democratic governance. Placing an emphasis on voting is a critical step forward. Researchers studying education policy in this era generally focus on women’s roles in school offices or as leaders and members of teachers’ organizations, not at the ballot box. Likewise, scholars examining early women voters often dismiss contests prior to the ratification of the Nineteenth Amendment, asserting that women’s participation was negligible and difficult to document.
Systematic quantitative data and qualitative evidence from news accounts add nuance to these claims. Although women voted at a lower rate than their male counterparts, tens of thousands of women participated in annual Massachusetts school committee elections and biennial Minnesota county school superintendent elections. In some Minnesota counties, women consistently were one out of every five voters. In Massachusetts, most communities had at least one election where women were one out of every 10 voters. In addition, turnout among registered women often topped 50% in Massachusetts and, especially in the 1890s, surpassed 100% (due to same-day voter registration) in Minnesota. Although some women were certainly disinterested in or ambivalent about the right to vote, for other Gilded Age and Progressive Era women, voting was likely a standard practice. The generalized acceptance of women voters is reflected in the way they are discussed (or, in some cases, not discussed) in period news coverage.
We offer several institutional and cultural explanations for variations in women’s participation in these two states. Much like in modern elections, turnout was higher in on-cycle presidential and midterm elections in Minnesota than in off-cycle city and town elections in Massachusetts. Contests for higher profile, more influential county superintendents of schools in Minnesota were more likely to attract participation than local school committee contests in Massachusetts. Women in Minnesota also had greater ability to choose and nominate candidates through primary elections than in Massachusetts, where party caucuses were open only to men. Same-day voter registration reduced barriers to participation and increased turnout in Minnesota relative to Massachusetts, where the registration deadline was usually several weeks prior to the election. Political culture may have played a role too. Minnesota’s moralistic political culture likely fostered broader engagement and a stronger sense of community and linked fate than Massachusetts’s more individualistic society.
Future work should build on these findings. Where quantitative and qualitative evidence are available, scholars should continue to explore how school suffrage affected women’s political socialization and participation.Footnote 56 One possible direction is to learn more about why women chose to register and vote (or not) and consider how women’s choices relate to demographics, politics, and election- or candidate-specific factors. For example, did some women face greater barriers to registration than others, perhaps because of local officials or procedures? When women voted, what did they encounter at the polls? The violence and inhospitable smoke- and alcohol-filled rooms of the mid-1800s seem to have become less prominent (whether by practice or by law), but perhaps threats were still present in some places?Footnote 57 To what degree did women voters support women candidates, resulting in greater representation of women on school committees?Footnote 58 Finally, did the presence of women as candidates and officeholders inspire more women to vote?
Second, research should also consider how the adoption of school suffrage affected election administration. Scholars might consider the ways that local governments either facilitated or resisted women registering to vote in school elections. We know that some male registrars turned away or resisted registering women, including Susan B. Anthony, in other types of contests. What was this like in school elections? Were there some registrars or jurisdictions that went out of the way to recruit women? How did women’s groups organize to counter or take advantage of these efforts?
Third, greater attention should be paid to how women voters used the ballot to affect education policy. For example, did school committees in areas where there were greater numbers of women voters spend money differently or adopt different curriculum? Did women’s groups with clear educational goals (e.g., Sorosis/the General Federation of Women’s Clubs; the Woman’s Christian Temperance Union) mobilize members to vote in school elections, as an account from Nantucket seems to suggest? Did religious communities and/or groups of professional women (e.g., teachers’ associations) systematically organize women to go to the polls, as suggested in New Bedford? What were their goals in school elections?
In summary, this study uses data that were not previously compiled by scholars to study the relationship between school suffrage and women’s political participation and socialization during the Gilded Age and Progressive Era. Although the adoption of school suffrage is often dismissed or ignored outside education research, women consistently used the right to vote in school elections during this period. Quantitative data on women voting in Massachusetts and Minnesota show that women voted at rates that are reasonable (and at times higher than one would expect) given the limited nature of their rights, the political cultures of their states, and the type and timing of school elections. Qualitative evidence underscores the importance of school suffrage as an incremental policy reform; newspapers in both states generally viewed women’s participation at the polls as routine by the early 1900s. Thus, school suffrage was clearly central to many late nineteenth and early twentieth-century women’s political socialization. It, and other forms of partial suffrage, merit greater attention as an electoral reform, a means of influencing public policy, and a method of increasing women’s political agency.


 Open access

