





1. Introduction
Credibility theory is an experience rating method that combines information from the collective and individual risks to obtain an accurate estimation of the premium of an insurance contract. In a situation where exact credibility can be obtained, the credibility theory is determined how much weight should be assigned to the claim history of an individual. However, in the Bayesian credibility theory, we restate our belief on risk parameters in terms of the prior distribution. Then, given the past risk experience, our belief has been updated and restated in terms of the posterior distribution. Finally, using such a posterior distribution, we derive a predictive distribution to make inferences about the future claim. In cases where the measurable space
 $\mathcal{X},$
or alternatively say population, is heterogeneous and can be partitioned into some finite homogenous populations, the posterior distribution and consequently the predictive distribution cannot represent in a closed form. Therefore, any inferential statistics, including the Bayesian credibility mean, about future claims cannot derive explicitly.
The history of the credibility theory began with Mowbray (Reference Mowbray1914)’s and Whitney (Reference Whitney1918)’s papers. They suggested a convex combination
 $P=\zeta{\bar X}+(1-\zeta)\mu,$
of collective premium,
 $\mu,$
and individual premium,
 ${\bar X},$
with credibility factor
 $\zeta,$
as an appropriate premium of an insurance contract. In 1950, Bailey restated this premium (well-known as an exact credibility premium) in the language of parametric Bayesian statistics. Bühlmann (Reference Bühlmann1967) and Bühlmann & Straub (Reference Bülmann and Straub1970) extended the idea of the exact credibility premium to the model-based approach. After the seminal works of Bühlmann (Reference Bühlmann1967) and Bühlmann & Straub (1970), the credibility theory has become very popular in most actuarial aspects. For a comprehensive discussion on various developments and methodologies in credibility theory, see Bühlmann & Gisler (Reference Bühlmann and Gisler2005) and Payandeh (2010). The classical credibility theory provides a relatively simple, but inflexible to mean of that predictive distribution. Hong & Martin (Reference Hong and Martin2017, Reference Hong and Martin2018) introduced a Dirichlet process mixture model as an alternative approach to the classical credibility theory. They studied several theoretical properties and the advantages of their approach. Moreover, they compared it with the classical credibility theory. The precise choice of prior distribution in the Bayesian credibility theory has been studied by Hong & Martin (Reference Hong and Martin2020, Reference Hong and Martin2022).
The Bayesian credibility mean under mixture distributions has been studied by several authors such as Lau et al. (Reference Lau, Siu and Yang2006), Cai et al. (Reference Cai, Wen, Wu and Zhou2015), Hong & Martin (Reference Hong and Martin2017, Reference Hong and Martin2018), Zhang et al. (Reference Zhang, Qiu and Wu2018), Payandeh & Sakizadeh (Reference Payandeh Najafabadi and Sakizadeh2019, Reference Payandeh Najafabadi and Sakizadeh2023), Li et al. (Reference Li, Lu and Zhu2021), among others. All of their approaches are derived based on an approximation. For instance, (1) Payandeh & Sakizadeh (2019) approximated the complicated posterior distribution by a mixture distribution, and then, they derived an approximation for the Bayesian credibility means. Unfortunately, their approximation error rises as the number of past experiences increases; (2) Lau et al. (Reference Lau, Siu and Yang2006) following Lo (Reference Lo1984) restated the predictive distribution of
 $X_{n+1}$
given the past claim experience
 $X_1,\cdots, X_n$
as a finite sum over all possible partitions of the past claim experience. Then, using the credibility premium, which is a convex combination of the collective premium (the prior mean) and the sample average of the past claim experience, to derive the Bayesian credibility mean. Certainly, under the class of the exponential family of distributions such a credibility premium coincides with the Bayesian credibility mean, see Payandeh (Reference Payandeh Najafabadi2010) for more details.
This article considers a random sample observation
 $X_1,\cdots,X_n$
from a K-component mixture distribution whit the cdf
 $F_X({\cdot})=\sum_{l=1}^{K}\omega_lG_{l}({\cdot}),$
where
 $\sum_{l=1}^{K}\omega_l=1.$
Moreover, it assumes that for a random variable
 $X_i,$
 $i=1,\cdots,n,$
there is additional information
 $Z_{i,1},\cdots, Z_{i,m},$
such that given such additional information, one may probabilistically determine the random variable
 $X_i$
belongs to which component of the K-component mixture distribution, i.e.,
 $P(X_i\sim G_{l}({\cdot})|Z_{i,1},\cdots, Z_{i,m})=\omega_l.$
Under these assumptions, this article provides (1) the Bayesian credibility premium for such a finite mixture distribution, (2) the exact credibility premium for such finite mixture distributions, whenever populations’ claim distribution belongs to the exponential family of distributions and their corresponding prior distribution conjugates with such a claim distribution, (3) a Logistic Regression Credibility model for a situation that a 2-component mixture family of distributions is an appropriate choice for data modelling, and (4) a comparison between the Logistic Regression Credibility and well-known Regression Tree Credibility model.
The rest of this article develops as the following. Section 2 collects some useful preliminaries and provides technical notations and symbols that we will use hereafter now. The main results are represented in section 3. The exact credibility mean under the class of single-parameter exponential family of distributions along with several examples has been given in section 4. For a situation that a 2-component mixture family of distributions is an appropriate choice for data modelling, section 5 suggests a probabilistic model to formulate such additional information and derive the Bayesian credibility mean for a finite mixture of distributions. Moreover, a comparison between the LRC model and its competitor, the Regression Tree Credibility (RTC) model, has been given in section 5.1. Conclusion and suggestions are given in section 6.
2. Preliminaries
A single-parameter exponential family is a family of probability distributions whose probability density/mass function can be restated as
 \begin{eqnarray}f(x|\theta) = a(x)e^{\left\{\phi(\theta)t(x)\right\}}/c(\theta)\,\,\forall\,x\in S_X,\end{eqnarray}
where
 $a({\cdot}),$
 $\phi({\cdot}),$
and
 $t({\cdot})$
are given functions, and the normalising factor
 $c({\cdot})$
is defined based on the fact that
 $\int_{S_X} f(x|\theta)dx=1.$
By setting
 $\eta=-\phi(\theta),$
Jewell (Reference Jewell1974) showed that, based upon random sample
 $X_1,\cdots,X_n,$
and under the conjugate prior distribution
 \begin{eqnarray*}\pi^{conj}(\eta) = [c(\eta)]^{-\alpha_{0}} e^{\left\{-\beta_{0}\eta \right\}}/d(\alpha_{0},\beta_{0}),\end{eqnarray*}
the Bayesian credibility can be expressed based on the sufficient statistic
 $t({\cdot})$
as
 \begin{eqnarray}E(t(X_{n+1})|X_1,\cdots,X_n) = \zeta_n{\bar t}_n+(1-\zeta_n)\beta_0/\alpha_0,\end{eqnarray}
where the credibility factor
 $\zeta_n=n/(n+\alpha_0)$
and
 ${\bar t}_n=\sum_{i}^{n}t(x_i)/n.$
For example, for the normal distribution with given mean
 $\mu_0$
and unknown variance
 $\sigma^2.$
To imply Jewell (Reference Jewell1974)’s findings, one may define the precision
 $\theta$
as
 $\theta=1/\sigma^2$
and
 $t(x)=(x-\mu_0)^2/2.$
Now by considering the Gamma conjugate prior (with parameters
 $\alpha_0$
and
 $\beta_0$
) for
 $\theta$
then get
 \begin{eqnarray}E\!\left(\frac{\left(X_{n+1}-\mu_0\right)^2}{2}|X_1,\cdots,X_n\right) = \zeta_n\frac{\sum_{i=1}^{n}\!(x_i-\mu_0)^2/2}{n}+(1-\zeta_n)\frac{\beta_0}{\alpha_0}.\end{eqnarray}
Therefore, the Bayesian credible prediction for the variance of
 $X_{n+1}$
is the linear combination of sample variance and mean of the conjugate prior.
A random variable X, given parameter vector
 $\boldsymbol{\Psi},$
has a K-component finite mixture distribution if it’s corresponding cdf can be reformulated as
 \begin{eqnarray} F_X(x|\boldsymbol{\Psi}) = \sum_{l=1}^{K}\omega_lG_l(x|\boldsymbol{\Psi}),\end{eqnarray}
where
 $G_l(x|\boldsymbol{\Psi})$
-s are some given the cdfs,
 $\omega_l\in[0,1],$
for
 $l=1,\cdots,K,$
 $\sum_{l=1}^{K}\omega_l=1.$
The finite mixture distributions have proved remarkably useful in modelling an enormous variety of phenomena in a wide range of branches in climatology, demographics, economics, actuarial science, statistics, healthcare, and a mixture of expert models and engineering. Indeed, the shape of a finite mixture distribution is flexible, being able to capture, many aspects of the collected data, such as multimodality, heavy-tailed, truncated, skewness, and kurtosis, see Miljkovic & Grün (Reference Miljkovic and Grün2016), Blostein & Miljkovic (Reference Blostein and Miljkovic2019) and de Alencar et al. (2021), among others, for more details. Moreover, one of the most advantages of finite mixture distributions is that they illustrate most aspects of complex systems which cannot be done by a single distribution, see McLachlan & Peel (Reference McLachlan and Peel2004), among others, for more details on mixture models. A finite mixture distribution is a simple and elementary model, but unfortunately, such simplicity does not extend to the derivation of either the maximum likelihood estimator or Bayes estimators (Lee et al., Reference Lee, Marin, Mengersen and Robert2009). In fact, based upon a random sample observation
 $X_1,\cdots, X_n,$
the likelihood function of a K-component mixture distribution is a product of a summation, which can be turned into a sum of
 $K^n$
terms. Therefore, it will be computationally too expensive to be used for more than a few observations. To overcome this problem, several attractive approaches have been introduced by the authors. For instance, Keatinge (Reference Keatinge1999) used the Karush-Kuhn-Tucker theorem to provide a maximum likelihood estimator algorithm to estimate the weights of a finite mixture of exponential distributions. Other authors employed a demarginalisation argument (or missing data approach) to assign a random variable
 $X_i$
to a subgroup, using a random latent variable. Then using an EM algorithm (Dempster et al., Reference Dempster, Laird and Rubin1977) or the data augmentation algorithm (Carvajal et al., Reference Carvajal, Orellana, Katselis, Escárate and Agüero2018) to derive an estimation. Some authors came up with an approximation technique; for instance, Payandeh & Sakizadeh (2019) approximated the Bayesian likelihood function for a mixture distribution by a practical and appropriate distribution. Unfortunately, the accuracy of their approximation technique dramatically reduces as the number of observations increases. All of these methods are time-consuming (Frühwirth-Schnatter, Reference Frühwirth-Schnatter, Celeux and Robert2019) or suffer from low accuracy.
A class of K-component finite mixture distributions is said to be identifiable whenever the equality of any two members
 $F({\cdot})$
and
 $F^*({\cdot})$
of this class implies: (1) equality of their components, (2) theirs weights, and (3) their cdfs. Identifiability problems for finite and countable mixtures have been widely investigated. Teicher (Reference Teicher1960, Reference Teicher1963) established a necessary and sufficient condition for the identifiability of the class of finite mixture distributions. Moreover, he proved the identifiability of a class of mixture Normal (or Gamma) distributions. Atienza et al. (Reference Atienza, Garcia-Heras and Munoz-Pichardo2006) showed that a class of all finite mixtures distributions generated by a union of Lognormal, Gamma, and Weibull distributions is identifiable. Unfortunately, most mixture distributions are not identifiable because they are invariant under permutations of the indices of their components. This problem is well-known as the “ label-switching problem.” The posterior distribution may also inherit such the “ label-switching problem” from its prior distribution (Rufo et al., Reference Rufo, Pérez and Martín2006 and Reference Rufo, Pérez and Martín2007). Under the “ label-switching problem,” there is a positive probability that at least one of the components in a finite mixture distribution does not contribute to any of the observations. Therefore, the random sample
 $x_1,\cdots,x_n$
does not carry any information on this component. Consequently, unknown parameter(s) of such a component cannot be estimated under either classical or Bayesian frameworks. A naïve solution to the “ label-switching problem” is to impose some constraint on the parameter space for the classical approach (Maroufy & Marriott, Reference Maroufy and Marriott2017), and for the Bayesian approach, some constraints have been added to the prior distribution that leads to a posterior distribution that does not suffer from the “ label-switching problem” (Marin et al., Reference Marin, Mengersen and Robert2005). Unfortunately, insufficient care in the choice of suitable identifiability constraints can lead to other problems (Rufo et al., Reference Rufo, Pérez and Martín2006 and Reference Rufo, Pérez and Martín2007).
It is worthwhile to mention that if random variable X, given
 $\boldsymbol{\Psi}$
, has the cdf function (4), one may not conclude that
 $P(X\in PoP_k|\boldsymbol{\Psi})=\omega_k,$
where
 $X\in PoP_k$
stands for “
 $X|\boldsymbol{\Psi}\sim F_k$
.” To observe this fact, consider a 2-component mixture distribution
 $F(x)=\omega_1 G_1(x)+\omega_2G_2(x).$
Now for an arbitrary density function
 $G_3({\cdot}),$
set
 $G^*_1(x)=G_3(x)$
and
 $G^*_2(x)=(\omega_1G_1(x)+\omega_2G_2(x)-\omega_1G_3(x))/\omega_2.$
Now observe that
 $F^*(x)= \omega_1G_1^*(x)+\omega_2G_2^*(x)=F(x).$
Note 1.
We should note that in this article, alternatively, we use
 $X\in PoP_k$
instead of
 $X\sim G_k.$
Suppose parameter vector
 $\boldsymbol{\Psi}$
can be restated as
 $\boldsymbol{\Psi}=(\theta_1,\theta_2,\cdots,\theta_K),$
based upon random sample
 ${\tilde{\boldsymbol{{X}}}}=(X_1,X_2,\cdots,X_n),$
the likelihood function and the posterior distribution, respectively, can be restated as
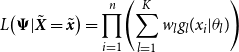 \begin{align}L\!\left(\boldsymbol{\Psi}|{\tilde{\boldsymbol{{X}}}}={\tilde{\boldsymbol{{x}}}}\right) = \prod_{i=1}^{n}\!\left(\sum_{l=1}^{K} w_l g_l(x_i|\theta_l)\right)\qquad\end{align}
 \begin{align}\pi\!\left(\boldsymbol{\Psi}|{\tilde{\boldsymbol{{X}}}}={\tilde{\boldsymbol{{x}}}}\right) \propto \left(\prod_{i=1}^{n} \sum_{l=1}^{K}w_lg_l(x_i|\theta_l)\right)\pi(\boldsymbol{\Psi}),\end{align}
where
 $\pi(\boldsymbol{\Psi})$
stands for prior distribution on
 $\boldsymbol{\Psi}$
and
 $g_k({\cdot})$
is density function of the
 $k^{th}$
component.
To derive a maximum likelihood estimation (resp. a Bayesian estimator) using Equation (5) (resp. Equation (6)), the missing data approach is the most popular method.
The following explain such an approach.
Note 2.
Suppose random variables
 $X_1,X_2,\cdots,X_n$
corresponding to the observed sample
 $x_1,x_2,\cdots,x_n$
are accompanied with latent binary random vector
 $\tilde{\boldsymbol{{H}}}=\left(H_{1,l},H_{2,l},\cdots,H_{n,l}\right)^\prime,$
for
 $l=1,2,\cdots,K,$
which indicating each observation arrives from which component/population, i.e.,
 $P\!\left(X_i\in PoP_{k}|H_{i,k}=1\right)=1$
and
 $P\!\left(X_i\notin PoP_{k}|H_{i,k}=0\right)=1.$
The likelihood function (5) and posterior distribution (6), respectively, can be restated as
 \begin{align*}L\!\left(\boldsymbol{\Psi},\tilde{\boldsymbol{{H}}}|{\tilde{\boldsymbol{{x}}}}\right) & = \prod_{i=1}^{n}\prod_{l=1}^{K}\!\left( w_lg_l(x_i|\theta_l)\right)^{H_{il}}\\\pi\!\left(\boldsymbol{\Psi},\tilde{\boldsymbol{{H}}}|{\tilde{\boldsymbol{{x}}}}\right) & \propto \prod_{i=1}^{n}\prod_{l=1}^{K}\!\left( w_lg_l(x_i|\theta_l)\right)^{H_{il}}\pi(\boldsymbol{\Psi}).\end{align*}
Now in
 $s{\textrm{th}}$
iteration of the E-step, one takes expectation with respect to conditional posterior distribution of the binary latent variable
 $H_{il},$
given observed data and update parameters at
 $(s-1){\textrm{th}}$
iteration.
Diebolt & Robert (Reference Diebolt and Robert1994) and Zhang et al. (Reference Zhang, Zhang and Yi2004) showed that such a missing data approach is very expensive from computational viewpoint.
Directly using the Likelihood function (5) or the posterior distribution (6), well-known as a combinatorial approach, see Marin et al. (Reference Marin, Mengersen and Robert2005) for a brief review. The combinatorial approach restates such product-summations equations as
 $K^n$
summation terms. To avoid a long presentation, we use some notations or symbols which defined in Table 1.
Notations and symbols.

Note:
 $\mathcal{S}^n,$
 $\mathcal{S}^n_i,$
 $B_{ir}$
and
 $B_{ir}^c$
define on the index of observations rather than their values.
Before we go further, we provide a simple example.
Consider a 2-component mixture distribution function with density function
 $\omega_1f_1(x|\theta_1)+\omega_2f_2(x|\theta_2).$
Moreover, suppose that we have sample observation
 $X_1,X_2,X_3.$
Using Table 1’s symbols, we have
 \begin{align*} \mathcal{S}^3 & = \{1,2,3\};\,\,\mathcal{S}^3_0=\{\emptyset\};\,\,\mathcal{S}^3_1=\{\{1\},\{2\},\{3\}\};\,\,\mathcal{S}^3_2=\{\{1,2\},\{1,3\},\{2,3\}\};\,\,\mathcal{S}^3_3=\{\{1,2,3\}\};\\[4pt]B_{11} & = \{\{1\}\};\,\, B_{12}=\{\{2\}\};\,\, B_{13}=\{\{3\}\};\,\,B_{11}^c=\{\{2,3\}\};\,\, B_{12}^c=\{\{1,3\}\};\,\, B_{13}^c=\{\{1,2\}\};\,\,B_{21}=\{\{1,2\}\};\\[4pt]B_{22} & = \{\{1,3\}\};\,\, B_{23}=\{\{2,3\}\};\,\,B_{21}^c=\{\{3\}\};\,\, B_{22}^c=\{\{2\}\};\,\,B_{23}^c=\{\{1\}\};\,\,B_{31}=\{\{1,2,3\}\};\,\,B_{31}^c=\left\{\emptyset\right\}.\end{align*}
The likelihood function can be restated as
 \begin{align*}L(\boldsymbol{\Psi}|{\tilde{\boldsymbol{{x}}}}) & = \Phi_3^1(0)+\Phi_3^1(1)+\Phi_3^1(2)+\Phi_3^1(3)\\[2pt] &=\omega_2^3f_2(x_1|\theta_2)f_2(x_2|\theta_2)f_2(x_3|\theta_2)\\[2pt] &\quad +\omega_1\omega_2^2\!\left[f_1(x_1|\theta_1)f_2(x_2|\theta_2)f_2(x_3|\theta_2)+f_1(x_2|\theta_1)f_2(x_1|\theta_2)f_2(x_3|\theta_2)\right.\\[2pt] &\quad\left.+\, f_1(x_3|\theta_1)f_2(x_1|\theta_2)f_2(x_1|\theta_2)) \right]\\[2pt] & \quad +\omega_1^2\omega_2\!\left[f_1(x_1|\theta_1)f_1(x_2|\theta_1)f_2(x_3|\theta_2)+f_1(x_1|\theta_1)f_1(x_3|\theta_1)f_2(x_2|\theta_2)\right.\\[2pt] &\quad \left.+\, f_1(x_2|\theta_1)f_1(x_3|\theta_1)f_2(x_1|\theta_2))\right] +\omega_1^3f_1(x_1|\theta_1)f_1(x_2|\theta_1)f_1(x_3|\theta_1)\end{align*}
It would worthwhile to mention that a given K-component mixture distribution can be reformulated as
 \begin{eqnarray*}f(x|\boldsymbol{\Psi}) = \omega_lg_l(x|\theta_l) + (1-\omega_l)g^*(x|\boldsymbol{\Psi}({-}l)),\end{eqnarray*}
where
 \begin{align}g^*(x|\boldsymbol{\Psi}({-}l)) & = \frac{\omega_1}{1-\omega_l}f_1(x|\theta_1)+\cdots+\frac{\omega_{l-1}}{1-\omega_l}f_{l-1}(x|\theta_{l-1})+\frac{\omega_{l+1}}{1-\omega_l}f_{l+1}(x|\theta_{l+1})\nonumber\\[3pt]& \quad +\cdots+\frac{\omega_K}{1-\omega_l}f_{K}(x|\theta_K).\end{align}
This type of presentation will be employed whenever we like to just estimate the parameter of the
 $l{\textrm{th}}$
component.
Hereafter now, we assume the K-component mixture distribution (4) is an identifiable model.
The following used the combinatorial method, to restate the likelihood function for the K-component mixture distribution (4).
Lemma 1.
Suppose that random sample
 $X_1,\cdots,X_n$
comes from the K-component mixture distribution (4). The likelihood function for mixtures of distributions can be restated in the following recursive manner
 \begin{eqnarray*}L_K(\boldsymbol{\Psi}|{\tilde{\boldsymbol{{X}}}}) = \sum_{i=0}^n\omega_K^i(1-\omega_K)^{n-i}\sum_{r=1}^{\tiny{\binom{n}{i}}}L_{K-1}\!\left(\boldsymbol{\Psi}({-}K)|{\tilde{\boldsymbol{{X}}}}_{B_{ir}^c}\right)\prod_{k\in B_{ir}}f_K(x_k|\theta_K),\end{eqnarray*}
where
 $L_{K-1}\!\left(\boldsymbol{\Psi}({-}K)|{\tilde{\boldsymbol{{X}}}}_{B_{ir}^c}\right)$
stands for the likelihood function, based upon the density function
 $g^*({\cdot})$
(given by Equation (7) and random sample
 ${\tilde{\boldsymbol{{X}}}}_{B_{ir}^c}.$
Proof. Using the fact that
 \begin{eqnarray*}{\tilde{\boldsymbol{{X}}}}\in\bigcup_{l=1}^{K}PoP_l = \bigcup_{i=0}^{n}\bigcup_{r=1}^{\tiny{\binom{n}{i}}}\left({\tilde{\boldsymbol{{X}}}}_{B_{ir}}\in PoP_{K} \,\&\, {\tilde{\boldsymbol{{X}}}}_{B_{ir}^c}\notin PoP_{K}\right)\end{eqnarray*}
and such partitions are disjoint, one may restate the likelihood function as
 \begin{align*}L_K(\boldsymbol{\Psi}|{\tilde{\boldsymbol{{X}}}}) & = \sum_{i=0}^n\sum_{r=1}^{\tiny{\binom{n}{i}}}P\!\left({\tilde{\boldsymbol{{X}}}}_{B_{ir}}\in PoP_{K}, {\tilde{\boldsymbol{{X}}}}_{B_{ir}^c}\notin PoP_{K}|\theta_K,\boldsymbol{\Psi}({-}K)\right)\\[4pt] & = \sum_{i=0}^n\sum_{r=1}^{\tiny{\binom{n}{i}}}P\!\left({\tilde{\boldsymbol{{X}}}}_{B_{ir}}\in PoP_{K}|\theta_K\right)P\!\left( {\tilde{\boldsymbol{{X}}}}_{B_{ir}^c}\notin PoP_{K}|\boldsymbol{\Psi}({-}K)\right)\\[4pt] & = \sum_{i=0}^n\sum_{r=1}^{\tiny{\binom{n}{i}}}\prod_{k\in B_{ir}}\!\left [\omega_Kf_K(x_k|\theta_K)\right]\prod_{k\in B_{ir}^c}\!\left[(1-\omega_K)g^*(x_k|\boldsymbol{\Psi}({-}K))\right]\\[4pt] & = \sum_{i=0}^n\omega_K^i(1-\omega_K)^{n-i}\sum_{r=1}^{\tiny{\binom{n}{i}}}L_{K-1}\!\left(\boldsymbol{\Psi}({-}K)|{\tilde{\boldsymbol{{X}}}}_{B_{ir}^c}\right)\prod_{k\in B_{ir}}f_K(x_k|\theta_K).\end{align*}
The second equation arrives from the assumption that given parameter vector
 $\boldsymbol{\Psi},$
two random samples
 ${\tilde{\boldsymbol{{X}}}}_{B_{ir}}$
and
 ${\tilde{\boldsymbol{{X}}}}_{B_{ir}^c}$
are independent.
The Bayes estimator for a given parameter of the K-component mixture distribution (4) under the squared error loss function is given as follows.
Lemma 2.
Assume that random sample
 $X_1,\cdots,X_n$
comes from the K-component mixture distribution (4). Moreover assume that
 $\pi(\theta_1,\theta_2,\cdots,\theta_K)=\prod_{j=1}^{K}\pi(\theta_j).$
Then, the Bayesian estimator, under the square error loss function, for parameter
 $\theta_l$
is
 \begin{eqnarray*}E(\Theta_l|{\tilde{\boldsymbol{{X}}}}) = \sum_{i=0}^n\sum_{r=1}^{\tiny{\binom{n}{i}}}C_{ir}^{(l)}E\!\left(\Theta_l|{\tilde{\boldsymbol{{X}}}}_{B_{ir}}\in PoP_l\right),\end{eqnarray*}
where
 \begin{eqnarray*} \displaystyle C_{ir}^{(l)} = P\!\left({\tilde{\boldsymbol{{X}}}}_{B_{ir}}\in PoP_{l},{\tilde{\boldsymbol{{X}}}}_{B_{ir}^c}\notin PoP_{l}|{\tilde{\boldsymbol{{X}}}}\in\bigcup_{l=1}^{K}PoP_l\right).\end{eqnarray*}
Proof. The posterior distribution of
 $\Theta_l|{\tilde{\boldsymbol{{X}}}}$
can be restated as
 \begin{align*}\pi\!\left(\theta_l|{\tilde{\boldsymbol{{X}}}}\right) & = \sum_{i=0}^n\sum_{r=1}^{\tiny{\binom{n}{i}}}\pi\!\left(\theta_l|{\tilde{\boldsymbol{{X}}}}_{B_{ir}}\in PoP_{l},{\tilde{\boldsymbol{{X}}}}_{B_{ir}^c}\notin PoP_{l}\right)P\!\left({\tilde{\boldsymbol{{X}}}}_{B_{ir}}\in PoP_{l},{\tilde{\boldsymbol{{X}}}}_{B_{ir}^c}\notin PoP_{l}|{\tilde{\boldsymbol{{X}}}}\in\bigcup_{k=1}^{K}PoP_k\right)\\& = \sum_{i=0}^n\sum_{r=1}^{\tiny{\binom{n}{i}}}C_{ir}^{(l)}\pi\!\left(\theta_l|{\tilde{\boldsymbol{{X}}}}_{B_{ir}}\in PoP_{l},{\tilde{\boldsymbol{{X}}}}_{B_{ir}^c}\notin PoP_{l}\right)\\& = \sum_{i=0}^n\sum_{r=1}^{\tiny{\binom{n}{i}}}C_{ir}^{(l)}\frac{\displaystyle{\int}_{\psi({-}l)}P({\tilde{\boldsymbol{{X}}}}_{B_{ir}}\in PoP_{l}\,\& \,{\tilde{\boldsymbol{{X}}}}_{B_{ir}^c}\notin PoP_{l}|\theta_l,\psi({-}l))\pi(\theta_l)\pi(\psi({-}l)){\textbf{d}}\psi({-}l)}{\displaystyle\int_{\theta_l}{\int}_{\psi({-}l)}P({\tilde{\boldsymbol{{X}}}}_{B_{ir}}\in PoP_{l}\,\& \,{\tilde{\boldsymbol{{X}}}}_{B_{ir}^c}\notin PoP_{l}|\theta_l,\psi({-}l))\pi(\theta_l)\pi(\psi({-}l))d\theta_l{\textbf{d}}\psi({-}l)}\end{align*}
 \begin{align*}& = \sum_{i=0}^n\sum_{r=1}^{\tiny{\binom{n}{i}}}C_{ir}^{(l)}\frac{\displaystyle\pi(\theta_l)P\!\left({\tilde{\boldsymbol{{X}}}}_{B_{ir}}\in PoP_{l}|\theta_l\right){\int}_{\psi({-}l)}P\!\left({\tilde{\boldsymbol{{X}}}}_{B_{ir}^c}\notin PoP_{l}|\psi({-}l)\right)\pi(\psi({-}l)){\textbf{d}}\psi({-}l)}{\displaystyle\int_{\theta_l}\pi(\theta_l)P\!\left({\tilde{\boldsymbol{{X}}}}_{B_{ir}}\in PoP_{l}|\theta_l\right)d\theta_l{\mathbf{\int}}_{\psi({-}l)}P\!\left({\tilde{\boldsymbol{{X}}}}_{B_{ir}^c}\notin PoP_{l}|\psi({-}l)\right)\pi(\psi({-}l)){\textbf{d}}\psi({-}l)}\\& = \sum_{i=0}^n\sum_{r=1}^{\tiny{\binom{n}{i}}}C_{ir}^{(l)}\pi\!\left(\theta_l|{\tilde{\boldsymbol{{X}}}}_{B_{ir}}\in PoP_{l}\right),\end{align*}
where
 ${\mathbf{\int}}_{\psi({-}l)}$
stands for
 $\int_{\theta_1}\cdots\int_{\theta_{l-1}}\int_{\theta_{l+1}}\cdots \int_{\theta_{K}},$
 ${\textbf{d}}\psi({-}l)=d\theta_1\cdots d\theta_{l-1}d\theta_{l+1}\cdots d\theta_K$
and
 $ \displaystyle C_{ir}^{(l)} =P\!\left({\tilde{\boldsymbol{{X}}}}_{B_{ir}}\in PoP_{l},{\tilde{\boldsymbol{{X}}}}_{B_{ir}^c}\notin PoP_{l}|{\tilde{\boldsymbol{{X}}}}\in\bigcup_{l=1}^{K}PoP_l\right).$
Since the Bayes estimator under the squared error loss function is the posterior expectation, we obtain the desired result.
Now, we concentrate on the Bayesian credibility mean for the K-component mixture distribution (4).
3. A Recursive Formula for the Bayesian Credibility Mean
The Bayesian credibility mean of
 $X_{n+1}$
based upon the past information
 $X_1,X_2,\cdots,X_n$
is
 \begin{eqnarray}E(X_{n+1}|X_1,X_2,\cdots,X_n).\end{eqnarray}
The following represents a recursive statement for the Bayesian credibility mean under the K-component mixture distribution (4).
Theorem 1.
Assume that the observations
 $X_1,\cdots,X_n$
come from the K-component mixture distribution (4). Moreover, suppose that the prior distribution
 $\pi(\theta_1,\theta_2,\cdots,\theta_K)$
is independent, i.e.,
 $\pi(\theta_1,\theta_2,\cdots,\theta_K)=\prod_{k=1}^{K}\pi_k(\theta_k).$
The Bayesian credibility mean based upon such random sample and the K-component mixture distribution is
 \begin{eqnarray*} \mathbf{E}_{K}\!\left(X_{n+1}|{\tilde{\boldsymbol{{X}}}}\right) = \sum_{i=0}^n\sum_{r=1}^{\tiny{\binom{n}{i}}}C_{ir}^{(K)}\!\left[\omega_K\mathbf{E}_{1}\!\left(X_{n+1}|{\tilde{\boldsymbol{{X}}}}_{B_{ir}}\in PoP_K\right)+(1-\omega_K)\mathbf{E}_{K-1}\!\left(X_{n+1}|{\tilde{\boldsymbol{{X}}}}_{B_{ir}^c}\notin PoP_K\right)\right],\end{eqnarray*}
where
 $\displaystyle C_{ir}^{(K)} =P\!\left({\tilde{\boldsymbol{{X}}}}_{B_{ir}}\in PoP_{K},{\tilde{\boldsymbol{{X}}}}_{B_{ir}^c}\notin PoP_{K}|{\tilde{\boldsymbol{{X}}}}\in\bigcup_{k=1}^{K}PoP_k\right).$
Proof. Using the definition of
 $C_{ir}^{(K)},$
one may conclude that
 \begin{align*}\mathbf{E}_{K}(X_{n+1}|{\tilde{\boldsymbol{{X}}}}) & = E\!\left(E\!\left(X_{n+1}|\theta_K,\psi({-}K)|{\tilde{\boldsymbol{{X}}}}\in\bigcup_{l=1}^{K}PoP_l\right)\right)\\ & = \sum_{i=0}^n\sum_{r=1}^{\tiny{\binom{n}{i}}} E\!\left(X_{n+1}|\left\{{\tilde{\boldsymbol{{X}}}}_{B_{ir}}\in PoP_K,{\tilde{\boldsymbol{{X}}}}_{B_{ir}^c}\notin PoP_K\right\}\right)P\!\left({\tilde{\boldsymbol{{X}}}}_{B_{ir}}\in PoP_K,{\tilde{\boldsymbol{{X}}}}_{B_{ir}^c}\notin PoP_K|{\tilde{\boldsymbol{{X}}}}\in\bigcup_{l=1}^{K}PoP_l\right)\\ & = \sum_{i=0}^n\sum_{r=1}^{\tiny{\binom{n}{i}}}C_{ir}^{(K)}E\!\left(E\!\left[X_{n+1}|\theta_K, \psi({-}K)\right]|\left\{{\tilde{\boldsymbol{{X}}}}_{B_{ir}}\in PoP_K,{\tilde{\boldsymbol{{X}}}}_{B_{ir}^c}\notin PoP_K\right\}\right)\end{align*}
 \begin{align*} & = \sum_{i=0}^n\sum_{r=1}^{\tiny{\binom{n}{i}}}C_{ir}^{(K)}\left[\omega_KE\!\left(\mu(\Theta_K)|{\tilde{\boldsymbol{{X}}}}_{B_{ir}}\in PoP_K\right)+(1-\omega_K)E\!\left(\mu(\psi({-}K))|{\tilde{\boldsymbol{{X}}}}_{B_{ir}^c}\notin PoP_K\right)\right]\\ & = \sum_{i=0}^n\sum_{r=1}^{\tiny{\binom{n}{i}}}C_{ir}^{(K)}\left[\omega_K\mathbf{E}_{1}\left(X_{n+1}|{\tilde{\boldsymbol{{X}}}}_{B_{ir}}\in PoP_K\right)+(1-\omega_K)\mathbf{E}_{K-1}\!\left(X_{n+1}|{\tilde{\boldsymbol{{X}}}}_{B_{ir}^c}\notin PoP_K\right)\right].\end{align*}
Theorem 1 provides a recursive formula to evaluate the Bayesian credibility mean. A practical application of this theorem is very expensive, to see that, please see the following example.
Teicher (Reference Teicher1960, Reference Teicher1963) established the identifiability of a class of mixture Gamma distribution, using this fact, the following example provides the Bayesian credibility mean (or premium) for a class of 2-component exponential distribution with Gamma conjugate prior distributions.
Example 1. Suppose given parameter vector
 $\boldsymbol{\Psi}=(\theta_1,\theta_2)$
, random sample
 $X_1,X_2,\cdots,X_n$
obtained from a 2-component exponential distribution with density function
 \begin{equation*}\omega_1Exp(\theta_1)+\omega_2Exp(\theta_2),\end{equation*}
where
 $\omega_1,\omega_2\in[0,1]$
and
 $\omega_1+\omega_2=1.$
Moreover, consider the conjugate prior
 $Gamma(\alpha_i,\beta_i)$
for parameter
 $\theta_i,$
for
 $i=1,2.$
Now, we are interested in the Bayesian credibility premium under this setting.
To obtain the desired Bayesian credibility premium, we employ the result of Theorem 1. Application of this theorem arrives under the following two steps:
-
Step 1)
 $C_{ir}^{(2)}=P\!\left({\tilde{\boldsymbol{{X}}}}_{B_{ir}}\in PoP_{2}\,\& \,{\tilde{\boldsymbol{{X}}}}_{B_{ir}^c}\notin PoP_{2}|{\tilde{\boldsymbol{{X}}}}\in\bigcup_{l=1}^{2}PoP_l\right),$
-
Step 2)
$\mathbf{E}_{1}\bigg(X_{n+1}|{\tilde{\boldsymbol{{X}}}}_{B_{ir}^c}\in PoP_{1}\bigg)$
and
$\mathbf{E}_{1}\bigg(X_{n+1}|{\tilde{\boldsymbol{{X}}}}_{B_{ir}}\in PoP_{2}\bigg).$


For Step 1 observe that:
 \begin{align*}C_{ir}^{(2)} & = P\!\left({\tilde{\boldsymbol{{X}}}}_{B_{ir}}\in PoP_{2}\,\& \,{\tilde{\boldsymbol{{X}}}}_{B_{ir}^c}\notin PoP_{2}|{\tilde{\boldsymbol{{X}}}}\in\bigcup_{l=1}^{2}PoP_l\right)\\[4pt] & = \frac{P\!\left({\tilde{\boldsymbol{{X}}}}_{B_{ir}}\in PoP_{2}\,\&\,{\tilde{\boldsymbol{{X}}}}_{B_{ir}^c}\notin PoP_{2}\right)}{\displaystyle\sum_{i=0}^n\sum_{r=1}^{\tiny{\binom{n}{i}}}P\!\left({\tilde{\boldsymbol{{X}}}}_{B_{ir}}\in PoP_{2}\,\&\,{\tilde{\boldsymbol{{X}}}}_{B_{ir}^c}\notin PoP_{2}\right)}.\end{align*}
Therefore, one has to calculate
 \begin{align*}P\!\left({\tilde{\boldsymbol{{X}}}}_{B_{ir}}\!\in PoP_{2}\,\&\,{\tilde{\boldsymbol{{X}}}}_{B_{ir}^c}\!\notin PoP_{2}\right) & = \int_{\theta_1}\int_{\theta_2}P\!\left({\tilde{\boldsymbol{{X}}}}_{B_{ir}}\in PoP_{2}\,\&\,{\tilde{\boldsymbol{{X}}}}_{B_{ir}^c}\notin PoP_{2}|\theta_1,\theta_2\right)\pi(\theta_1)\pi(\theta_2)d\theta_2d\theta_1\\& = \int_{\theta_1}\int_{\theta_2}\!\omega_2^i(1-\omega_2)^{n-i}\prod_{k\in B_{ir}}f_2(x_k|\theta_2)\prod_{k\in B_{ir}^c}f_1(x_k|\theta_1)\pi(\theta_1)\pi(\theta_2)d\theta_2d\theta_1 \\ & = \omega_2^i(1-\omega_2)^{n-i}\bigg[\int_{0}^{\infty}\prod_{k\in B_{ir}}\bigg(\theta_2e^{-\theta_2x_k}\bigg)\bigg(\frac{\beta_2^{\alpha_2}}{\Gamma(\alpha_2)}\theta_2^{\alpha_2-1}e^{-\beta_2\theta_2}\bigg)d\theta_2 \\ & \quad \times\int_{0}^{\infty}\prod_{k\in B_{ir}^c}\bigg(\theta_1e^{-\theta_1x_k}\bigg)\bigg(\frac{\beta_1^{\alpha_1}}{\Gamma(\alpha_1)}\theta_1^{\alpha_1-1}e^{-\beta_1\theta_1}\bigg)d\theta_1\bigg]\end{align*}
 \begin{align*}& = \omega_2^i(1-\omega_2)^{n-i}\left[\frac{\beta_1^{\alpha_1}}{\Gamma(\alpha_1)}\frac{\Gamma(n-i+\alpha_1)}{\left((n-i){\bar{\boldsymbol{{x}}}}_{B_{ir}^c}+\beta_1\right)^{(n-i+\alpha_1)}} \right.\\ & \left.\times\frac{\beta_2^{\alpha_2}}{\Gamma(\alpha_2)}\frac{\Gamma(i+\alpha_2)}{\left(i{\bar{\boldsymbol{{x}}}}_{B_{ir}}+\beta_2\right)^{(i+\alpha_2)}}\right].\end{align*}
Using the above findings, we have
 \begin{eqnarray*}\displaystyle C_{ir}^{(2)} = \frac{\displaystyle\omega_2^i(1-\omega_2)^{n-i}\left[\frac{\beta_1^{\alpha_1}}{\Gamma(\alpha_1)}\frac{\Gamma(n-i+\alpha_1)}{\left((n-i){\bar{\boldsymbol{{x}}}}_{B_{ir}^c}+\beta_1\right)^{(n-i+\alpha_1)}}\frac{\beta_2^{\alpha_2}}{\Gamma(\alpha_2)}\frac{\Gamma(i+\alpha_2)}{\left(i{\bar{\boldsymbol{{x}}}}_{B_{ir}}+\beta_2\right)^{(i+\alpha_2)}}\right]}{\displaystyle\sum_{j=0}^{n}\sum_{r=1}^{\binom{n}{j}}\omega_2^j(1-\omega_2)^{n-j}\left[\frac{\beta_1^{\alpha_1}}{\Gamma(\alpha_1)}\frac{\Gamma(n-j+\alpha_1)}{\left((n-j){\bar{\boldsymbol{{x}}}}_{B_{jr}^c}+\beta_1\right)^{(n-j+\alpha_1)}}\frac{\beta_2^{\alpha_2}}{\Gamma(\alpha_2)}\frac{\Gamma(j+\alpha_2)}{\left(j{\bar{\boldsymbol{{x}}}}_{B_{jr}}+\beta_2\right)^{(j+\alpha_2)}}\right]}.\end{eqnarray*}
Now observe that:
 \begin{align*}\pi\!\left(\theta_2|{\tilde{\boldsymbol{{X}}}}_{B_{ir}}\in PoP_{2}\right) & = \frac{P\!\left({\tilde{\boldsymbol{{X}}}}_{B_{ir}}\in PoP_{2}|\theta_2\right)\pi(\theta_2)}{\int_{\theta_2}P\!\left({\tilde{\boldsymbol{{X}}}}_{B_{ir}}\in PoP_{2}|\theta_2\right)\pi(\theta_2)d\theta_2}\\[3pt]& = \frac{\prod_{k\in B_{ir}}\bigg(\theta_2e^{-\theta_2x_k}\bigg)\bigg(\frac{\beta_2^{\alpha_2}}{\Gamma(\alpha_2)}\theta_2^{\alpha_2-1}e^{-\beta_2\theta_2}\bigg)}{\int_{0}^{\infty}\prod_{k\in B_{ir}}\bigg(\theta_2e^{-\theta_2x_k}\bigg)\bigg(\frac{\beta_2^{\alpha_2}}{\Gamma(\alpha_2)}\theta_2^{\alpha_2-1}e^{-\beta_2\theta_2}\bigg)d\theta_2}\qquad \qquad\qquad\qquad\\[3pt]& = \frac{\dfrac{\beta_2^{\alpha_2}}{\Gamma(\alpha_2)}\theta_2^{i+\alpha_2-1}e^{-\theta_2\!\left(\sum_{k\in B_{ir}}x_k +\beta_2\right)}}{\int_{0}^{\infty}\dfrac{\beta_2^{\alpha_2}}{\Gamma(\alpha_2)}\theta_2^{i+\alpha_2-1}e^{-\theta_2\!\left(\sum_{k\in B_{ir}}x_k +\beta_2\right)}d\theta_2}\qquad\qquad\qquad\qquad\qquad\qquad\\[3pt]& = \frac{\left(i{\bar{\boldsymbol{{x}}}}_{B_{ir}}+\beta_2\right)^{(i+\alpha_2)}}{\Gamma(i+\alpha_2)}\theta_2^{(i+\alpha_2-1)}e^{-\theta_2\!\left(i{\bar{\boldsymbol{{x}}}}_{B_{ir}}+\beta_2\right)}.\end{align*}
One may similarly calculate
 $\pi(\theta_1|\left({\tilde{\boldsymbol{{X}}}}_{B_{ir}^c}\in PoP_{1}\right).$
Now, we move to Step 2.
 \begin{align*}\mathbf{E}_{1}\bigg(X_{n+1}|{\tilde{\boldsymbol{{X}}}}_{B_{ir}}\in PoP_2\bigg) & = E\bigg(E(X_{n+1}|\theta_2)|{\tilde{\boldsymbol{{X}}}}_{B_{ir}}\in PoP_2\bigg)\\[4pt]& = E\!\left(\frac{1}{\Theta_2}|{\tilde{\boldsymbol{{X}}}}_{B_{ir}}\in PoP_2\right)\\[4pt]& = \int_{0}^{\infty}\frac{1}{\theta_2}\pi\!\left(\theta_2|{\tilde{\boldsymbol{{X}}}}_{B_{ir}}\in PoP_2\right)d\theta_2\\[4pt]& = \frac{i{\bar{\boldsymbol{{x}}}}_{B_{ir}}+\beta_2}{i+\alpha_2}\\[4pt]& = \left[\frac{i}{i+\alpha_2}{\bar{\boldsymbol{{x}}}}_{B_{ir}}+\left(1-\frac{i}{i+\alpha_2} \right)\frac{\beta_2}{\alpha_2}\right].\end{align*}
Similarly,
 \begin{eqnarray*}\mathbf{E}_{1}\bigg(X_{n+1}|{\tilde{\boldsymbol{{X}}}}_{B_{ir}^c}\notin PoP_2\bigg) = \left[\frac{n-i}{n-i+\alpha_1}{\bar{\boldsymbol{{x}}}}_{B_{ir}^c}+\left(1-\frac{n-i}{n-i+\alpha_1} \right)\frac{\beta_1}{\alpha_1}\right].\end{eqnarray*}
Therefore, using Theorem 1 the Bayesian credibility premium is
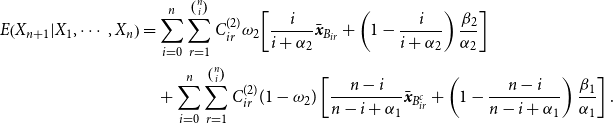 \begin{align}E\!\left(X_{n+1}|X_1,\cdots,X_n\right) & = \sum_{i=0}^n\sum_{r=1}^{\binom{n}{i}}C_{ir}^{(2)}\omega_2\!\left[\frac{i}{i+\alpha_2}{\bar{\boldsymbol{{x}}}}_{B_{ir}}+\left(1-\frac{i}{i+\alpha_2} \right)\frac{\beta_2}{\alpha_2}\right]\nonumber\\ & \quad +\sum_{i=0}^n\sum_{r=1}^{\binom{n}{i}}C_{ir}^{(2)}(1-\omega_2)\left[\frac{n-i}{n-i+\alpha_1}{\bar{\boldsymbol{{x}}}}_{B_{ir}^c}+\left(1-\frac{n-i}{n-i+\alpha_1}\right)\frac{\beta_1}{\alpha_1}\right].\end{align}
It is worthwhile mentioning that, in a situation that
 $\omega_1=1$
(or
 $\omega_2=0$
), the summation
 $\sum_{i=0}^n\sum_{r=1}^{\binom{n}{i}}C_{ir}^{(2)}$
just valid for
 $i=0$
which
 $C_{01}^{(2)}=1.$
Therefore, under this setting the Bayesian credibility premium, given by Equation (9), is the well-known Bayesian credibility premium under the Exponential-Gamma assumption, in the other words,
 \begin{eqnarray*}E\!\left(X_{n+1}|X_1,\cdots,X_n\right) = \frac{n}{n+\alpha_1}{\bar{\boldsymbol{{x}}}}_{\mathcal{S}^n}+\left(1-\frac{n}{n+\alpha_1} \right)\frac{\beta_1}{\alpha_1},\end{eqnarray*}
where
 ${\bar{\boldsymbol{{x}}}}_{\mathcal{S}^n}={\bar{\boldsymbol{{x}}}}=\sum_{k=1}^nx_k/n.$
The combinatorial object in the Bayesian credibility mean (see Equation (9)) for Example 1 makes it very hard to use. Table 2 represents the number of combinators one has to be considered, whenever he/she would like to use Equation (9). As one may observe, implementation of Equation (9) even for sample size
 $n=30$
is very expensive and cannot be done with a regular computer.
Number of combinators that one has to calculate for Equation (9).

To remove such barrier, we have two possibilities:
Approximate
$C_{ir}^{(l)}$
by a function which just depends on i an l
Impose some restriction on our problem such that
$C_{ir}^{(l)}$
does not depend on r.


Somehow, the first approach has been employed by Lau et al. (Reference Lau, Siu and Yang2006). They employed the sampling scheme based on a weighted Chinese Restaurant algorithm to estimate the Bayesian credibility for the infinite mixture model from observed data.
The next section considers a situation where the above recursive formula is simplified and the exact Bayesian credibility mean is obtained.
4. Exact Bayesian Credibility Mean
Hereafter now, we follow the second approach. Therefore, we consider the following model assumption.
Model Assumption 1.
Suppose given parameter vector
 $\boldsymbol{\Psi},$
random variables
 $X_1,\cdots, X_n$
are i.i.d. Moreover suppose that there is an additional information
 $Z_{i,1},\cdots, Z_{i,m}$
where given such information random variable
 $X_i,$
with probability
 $\omega_{l},$
has the cdf
 $G_l({\cdot}),$
for
 $l=1,2,\cdots,K,$
where
 $\sum_{l=1}^{K}\omega_{l}=1.$
The following lemma shows that, under the above model assumption, random variables
 $X_1,\cdots, X_n$
are a member of the K-component mixture distributions (4).
Lemma 3.
Under Model Assumption 1, given
 $\boldsymbol{\Psi},$
random variables
 $X_1,\cdots, X_n$
are a member of the K-component mixture distributions (4).
Proof. Under Model Assumption 1 given
 $\boldsymbol{\Psi},$
random variables
 $X_1,\cdots, X_n$
are i.i.d. Therefore, we just need to find distribution of the random variable
 $X_1$
 \begin{align*}F_{X_1|\boldsymbol{\Psi}}(t) & = P(X_1\leq t|\boldsymbol{\Psi})\\ &= \sum_{j=1}^{K}P\!\left(X_1\leq t|X_1\in PoP_j,\boldsymbol{\Psi}\right)\omega_j\\ &= \sum_{j=1}^{K}\omega_jG_j(t).\end{align*}
Another useful property of Model Assumption 1 has been given by the following.
Lemma 4.
Under Model Assumption 1, the
 $C_{ir}^{(l)}$
defined in Theorem 1 can be simplified as
 \begin{eqnarray*}C_{ir}^{(l)} = \omega_l^i(1-\omega_l)^{n-i}.\end{eqnarray*}
Proof. Conditioning the
 $C_{ir}^{(l)}$
on
 $\boldsymbol{\Psi},$
one may restate
 \begin{align*}C_{ir}^{(l)} & = P\!\left({\tilde{\boldsymbol{{X}}}}_{B_{ir}}\in PoP_{l}\,\&\,{\tilde{\boldsymbol{{X}}}}_{B_{ir}^c}\notin PoP_{l}|{\tilde{\boldsymbol{{X}}}}\in\bigcup_{k=1}^{K}PoP_k\right)\\[3pt] & = \int_{\boldsymbol{\Psi}} P\!\left({\tilde{\boldsymbol{{X}}}}_{B_{ir}}\in PoP_l ,{\tilde{\boldsymbol{{X}}}}_{B_{ir}^c}\notin PoP_l|\boldsymbol{\Psi},X_1, X_2,\cdots,X_n\right)\pi\!\left(\boldsymbol{\Psi}|X_1,X_2,\cdots,X_n\right)d\boldsymbol{\Psi}\\[3pt] & = \int_{\boldsymbol{\Psi}} P\!\left({\tilde{\boldsymbol{{X}}}}_{B_{ir}}\in PoP_l|\theta_l\right)P\!\left({\tilde{\boldsymbol{{X}}}}_{B_{ir}^c}\notin PoP_l|\boldsymbol{\Psi}({-}l)\right)\pi\!\left(\boldsymbol{\Psi}|X_1,X_2,\cdots,X_n\right)d\boldsymbol{\Psi}\\[3pt] & = \int_{\boldsymbol{\Psi}} \left[P\!\left(X_1\in PoP_l|\theta_l\right)\right]^{i}\left[P\!\left(X_1\notin PoP_l|\boldsymbol{\Psi}({-}l)\right)\right]^{n-i}\pi\!\left(\boldsymbol{\Psi}|X_1,X_2,\cdots,X_n\right)d\boldsymbol{\Psi}\\[3pt] & = \omega_l^{i}\left(1-\omega_l\right)^{n-i}\int_{\boldsymbol{\Psi}}\pi\!\left(\boldsymbol{\Psi}|X_1,X_2,\cdots,X_n\right)d\boldsymbol{\Psi}\\[3pt] & = \omega_l^{i}\!\left(1-\omega_l\right)^{n-i}.\end{align*}
The last two equations arrive from the fact that
 $P({X_1}\in PoP_j|\boldsymbol{\Psi})=\omega_j$
and the posterior distribution
 $\pi(\boldsymbol{\Psi}|X_1,X_2,\cdots,X_n)$
is a proper distribution.
Under Model Assumption, 1’s result of Theorem 1 can be simplified as follows.
Corollary 1. Under Model Assumption 1, the Bayesian credibility mean is
 \begin{align*} \mathbf{E}_{K}(X_{n+1}|{\tilde{\boldsymbol{{X}}}}) & = \sum_{i=0}^n\sum_{r=1}^{\tiny{\binom{n}{i}}}\omega_K^{i}\!\left(1-\omega_K\right)^{n-i}\left[\omega_K\mathbf{E}_{1}\left(X_{n+1}|{\tilde{\boldsymbol{{X}}}}_{B_{ir}}\in PoP_K\right)\right.\\& \quad \left. +(1-\omega_K)\mathbf{E}_{K-1}\!\left(X_{n+1}|{\tilde{\boldsymbol{{X}}}}_{B_{ir}^c}\notin PoP_K\right)\right].\end{align*}
Now, by several examples, we develop the Bayesian credibility mean under the single-parameter exponential family of distributions.
For simplicity in presentation, hereafter now, we just consider the single-parameter exponential family of distributions, given by Equation (1), with
 $\phi(\theta)=-\theta$
for some possible extension of our finding see section 5.
Before move further, it would be useful to observe that
 \begin{align}\nonumber \sum_{r=1}^{\binom{n}{i}}i{\bar{\boldsymbol{{x}}}}_{B_{ir}} & = i\!\left[\bar{x}_{B_{i,1}}+\bar{x}_{B_{i,2}}+\cdots+\bar{x}_{B_{i,\binom{n}{i}}}\right]\nonumber\\ &= i\!\left[\frac{\overbrace{x_1+x_2+\cdots+x_k}^{i \ observations}}{i}+\cdots+\frac{\overbrace{x_1+x_2+\cdots+x_{k'}}^{i \ observations}}{i}\right]\nonumber\\ &= \binom{n-1}{i-1}\sum_{i=1}^{n}x_i\nonumber\\ &= \binom{n}{i} i \bar{x}.\end{align}
Identifiability of a class of mixture of normal distributions has been established by Teicher (Reference Teicher1960, Reference Teicher1963). Therefore, we may consider the following example.
Example 2. Suppose that under Model Assumption 1, the random sample
 $X_1,X_2,\cdots,X_n,$
given parameter vector
 $\boldsymbol{\Psi}=(\theta_1,\theta_2,\theta_3)^\prime,$
has been distributed according the following 3-component normal mixture distribution
 \begin{equation*}\omega_1 N\!\left(\theta_1,\sigma_1^2\right)+\omega_2N\!\left(\theta_2,\sigma_2^2\right)+\omega_3 N\!\left(\theta_3,\sigma_3^2\right),\end{equation*}
where
 $\sigma_1^2,$
 $\sigma_2^2$
 $\sigma_3^2$
are given,
 $\omega_1,\omega_2,\omega_3\in[0,1]$
and
 $\omega_1+\omega_2+\omega_3=1.$
Moreover, suppose that, for
 $l=1,2,3,$
 $\theta_l$
has the conjugate prior distribution
 $N\!\left(\mu_l,b_l^2\right).$
Now using result of Corollary 1, the recursive Bayesian credibility mean/premium is
 \begin{align} \mathbf{E}_{3}(X_{n+1}|{\tilde{\boldsymbol{{X}}}}) & = \sum_{i=0}^n\sum_{r=1}^{\tiny{\binom{n}{i}}}\omega_3^i(1-\omega_3)^{n-i}\left[\omega_3\mathbf{E}_{1}\!\left(X_{n+1}|{\tilde{\boldsymbol{{X}}}}_{B_{ir}}\in PoP_3\right)\right.\nonumber\\&\quad \left. +\,(1-\omega_3)\mathbf{E}_{2}\left(X_{n+1}|{\tilde{\boldsymbol{{X}}}}_{B_{ir}^c}\notin PoP_3\right)\right].\end{align}
Another application of Theorem 1 leads to
 \begin{align*}\mathbf{E}_{2}\!\left(X_{n+1}|{\tilde{\boldsymbol{{X}}}}_{B_{ir}^c}\notin PoP_3\right) & = \sum_{d=0}^{n-i}\sum_{e=1}^{\tiny{\binom{n-i}{d}}}C_{de}^{(2)}\left(\frac{\omega_2}{1-\omega_3}\mathbf{E}_{1}\left(X_{n+1}|{\tilde{\boldsymbol{{X}}}}_{B_{de}}\in PoP_2\right)\right.\\& \quad \left. +\frac{\omega_1}{1-\omega_3}\mathbf{E}_{1}\!\left(X_{n+1}|{\tilde{\boldsymbol{{X}}}}_{B_{de}^c}\in PoP_1\right)\right)\\& = \sum_{d=0}^{n-i}\sum_{e=1}^{\tiny{\binom{n-i}{d}}}\left(\frac{\omega_2}{1-\omega_3}\right)^{d}\left(\frac{\omega_1}{1-\omega_3}\right)^{n-i-d}\frac{\omega_2}{1-\omega_3}\mathbf{E}_{1}\left(X_{n+1}|{\tilde{\boldsymbol{{X}}}}_{B_{de}}\in PoP_2\right)\\&\quad +\sum_{d=0}^{n-i}\sum_{e=1}^{\tiny{\binom{n-i}{d}}}\left(\frac{\omega_2}{1-\omega_3}\right)^{d}\left(\frac{\omega_1}{1-\omega_3}\right)^{n-i-d}\frac{\omega_1}{1-\omega_3}\mathbf{E}_{1}\!\left(X_{n+1}|{\tilde{\boldsymbol{{X}}}}_{B_{de}^c}\in PoP_1\right).\end{align*}
The exact Bayesian credibility mean under a 1-component normal mixture distribution helps us to conclude
 \begin{align*}\mathbf{E}_{1}\!\left(X_{n+1}|{\tilde{\boldsymbol{{X}}}}_{B_{ir}}\in PoP_3\right) & = \frac{ib_3^2}{ib_3^2+\sigma_3^2}\bar{x}_{B_{ir}}+\frac{\sigma_3^2}{ib_3^2+\sigma_3^2}\mu_3,\,\,for\,i=0,\cdots,n,\\[3pt]\mathbf{E}_{1}\!\left(X_{n+1}|{\tilde{\boldsymbol{{X}}}}_{B_{de}}\in PoP_2\right) & = \frac{db_2^2}{db_2^2+\sigma_2^2}\bar{x}_{B_{de}}+\frac{\sigma_2^2}{db_2^2+\sigma_2^2}\mu_2,\,\,for\,d=0,\cdots,n-i,\\[3pt]\mathbf{E}_{1}\!\left(X_{n+1}|{\tilde{\boldsymbol{{X}}}}_{B_{de}^c}\in PoP_1\right) & = \frac{(n-i-d)b_1^2}{(n-i-d)b_1^2+\sigma_1^2}\bar{x}_{B_{de}^c}+\frac{\sigma_1^2}{(n-i-d)b_1^2+\sigma_1^2}\mu_1,\,\,for\,d=0,\cdots,n-i,\end{align*}
see Bühlmann & Gisler (Reference Bühlmann and Gisler2005), among others for more details.
Substituting the above findings in Equation (11) and an application of Equation (10), the Bayesian credibility mean
 $\mathbf{E}_{3}(X_{n+1}|{\tilde{\boldsymbol{{X}}}})$
can be restated as
 \begin{align*} & \sum_{i=0}^n\sum_{r=1}^{\tiny{\binom{n}{i}}}\omega_3^i(1-\omega_3)^{n-i}\omega_3 \!\left[\frac{ib_3^2}{ib_3^2+\sigma_3^2}\bar{x}_{B_{ir}}+\frac{\sigma_3^2}{ib_3^2+\sigma_3^2}\mu_3\right]\\& \qquad +\sum_{i=0}^n\sum_{r=1}^{\tiny{\binom{n}{i}}}\omega_3^i(1-\omega_3)^{n-i}(1-\omega_3)\sum_{d=0}^{n-i}\sum_{e=1}^{\tiny{\binom{n-i}{d}}}\left(\frac{\omega_2}{1-\omega_3}\right)^{d}\left(\frac{\omega_1}{1-\omega_3}\right)^{n-i-d}\\& \qquad\qquad\qquad\qquad\qquad \times \frac{\omega_2}{1-\omega_3}\left[\frac{db_2^2}{db_2^2+\sigma_2^2}\bar{x}_{B_{de}}+\frac{\sigma_2^2}{db_2^2+\sigma_2^2}\mu_2\right]\\& \qquad +\sum_{i=0}^n\sum_{r=1}^{\tiny{\binom{n}{i}}}\omega_3^i(1-\omega_3)^{n-i}(1-\omega_3)\sum_{d=0}^{n-i}\sum_{e=1}^{\tiny{\binom{n-i}{d}}}\left(\frac{\omega_2}{1-\omega_3}\right)^{d}\left(\frac{\omega_1}{1-\omega_3}\right)^{n-i-d}\\& \qquad\qquad\qquad\qquad\qquad \times \frac{\omega_1}{1-\omega_3}\left[\frac{(n-i-d)b_1^2}{(n-i-d)b_1^2+\sigma_1^2}\bar{x}_{B_{de}^c} \frac{\sigma_1^2}{(n-i-d)b_1^2+\sigma_1^2}\mu_1\right]\\[4pt]& \quad = \omega_3\sum_{i=0}^n\omega_3^i(1-\omega_3)^{n-i}\left[\frac{ib_3^2}{ib_3^2+\sigma_3^2}{\tiny{\binom{n}{i}}}\bar{x}+\frac{\sigma_3^2}{ib_3^2+\sigma_3^2}{\tiny{\binom{n}{i}}}\mu_3\right]\end{align*}
 \begin{align*}& \qquad +\omega_2\sum_{i=0}^n\omega_3^i(1-\omega_3)^{n-i}\sum_{d=0}^{n-i}\left(\frac{\omega_2}{1-\omega_3}\right)^{d}\left(\frac{\omega_1}{1-\omega_3}\right)^{n-i-d}\left[\frac{db_2^2}{db_2^2+\sigma_2^2}\tiny{\binom{n-i}{d}}\tiny{\binom{n}{i}}\bar{x}\right.\\& \qquad\qquad\qquad\qquad\qquad\left. +\frac{\sigma_2^2}{db_2^2+\sigma_2^2}\tiny{\binom{n-i}{d}}\tiny{\binom{n}{i}}\mu_2\right]\\[4pt]& \qquad +\omega_1\sum_{i=0}^n\omega_3^i(1-\omega_3)^{n-i}\sum_{d=0}^{n-i}\left(\frac{\omega_2}{1-\omega_3}\right)^{d}\left(\frac{\omega_1}{1-\omega_3}\right)^{n-i-d}\left[\frac{(n-i-d)b_1^2}{(n-i-d)b_1^2+\sigma_1^2}\tiny{\binom{n-i}{d}}\tiny{\binom{n}{i}}\bar{x}\right.\\[4pt]& \qquad \left.+\, \frac{\sigma_1^2}{(n-i-d)b_1^2+\sigma_1^2}\tiny{\binom{n-i}{d}}\tiny{\binom{n}{i}}\mu_1\right]\\[4pt]&\qquad\qquad\qquad = {\omega_3\!\left[\zeta_3\bar{ x}+(1-\zeta_3)\mu_3\right] +\omega_2\!\left[\zeta_2\bar{ x}+(1-\zeta_2)\mu_2 \right]+\omega_1\!\left[\zeta_1\bar{ x}+(1-\zeta_1)\mu_1 \right]},\end{align*}
where
 \begin{align*}\zeta_1 & = \sum_{i=0}^n\omega_3^i(1-\omega_3)^{n-i}\sum_{d=0}^{n-i}\left(\frac{\omega_2}{1-\omega_3}\right)^{d}\left(\frac{\omega_1}{1-\omega_3}\right)^{n-i-d}\frac{(n-i-d)b_1^2}{(n-i-d)b_1^2+\sigma_1^2}\tiny{\binom{n-i}{d}}\tiny{\binom{n}{i}}\\\zeta_2 & = \sum_{i=0}^n\omega_3^i(1-\omega_3)^{n-i}\sum_{d=0}^{n-i}\left(\frac{\omega_2}{1-\omega_3}\right)^{d}\left(\frac{\omega_1}{1-\omega_3}\right)^{n-i-d}\frac{db_2^2}{db_2^2+\sigma_2^2}\tiny{\binom{n-i}{d}}\tiny{\binom{n}{i}}\\ \zeta_3 & = \sum_{i=0}^n\omega_3^i(1-\omega_3)^{n-i}{\tiny{\binom{n}{i}}}\frac{ib_3^2}{ib_3^2+\sigma_3^2}.\end{align*}
To show application of recursive formula represented in Theorem 1, the following considers a 4-component mixture distribution.
Example 3. Suppose that under Model Assumption 1, the random sample
 $X_1,X_2,\cdots,X_n,$
given parameter vector
 $\boldsymbol{\Psi}=(\theta_1,\theta_2,\theta_3,\theta_4)^\prime,$
has been distributed according the following 4-component normal mixture distribution
 \begin{eqnarray*}\omega_1 N\!\left(\theta_1,\sigma_1^2\right)+\omega_2 N\!\left(\theta_2,\sigma_2^2\right)+\omega_3 N\!\left(\theta_3,\sigma_3^2\right)+\omega_4 N\!\left(\theta_4,\sigma_4^2\right),\end{eqnarray*}
where for
 $l=1,2,3,4,$
variance
 $\sigma_l^2,$
are given,
 $\omega_l\in[0,1]$
and
 $\omega_1+\omega_2+\omega_3+\omega_4=1.$
Moreover, suppose that, for
 $l=1,2,3,4,$
 $\theta_l$
has the conjugate prior distribution
 $N\!\left(\mu_l,b_l^2\right).$
Now an application of Corollary 1 leads to the following Bayesian credibility mean
 \begin{align}\mathbf{E}_{4}(X_{n+1}|{\tilde{\boldsymbol{{X}}}}) & = \sum_{i=0}^n\sum_{r=1}^{\tiny{\binom{n}{i}}}\omega_4^i(1-\omega_4)^{n-i} \left[\omega_4 \mathbf{E}_{1}(X_{n+1}|{\tilde{\boldsymbol{{X}}}}_{B_{ir}}\in PoP_4)\right.\nonumber\\& \quad \left.+\, (1-\omega_4)\mathbf{E}_{3}\left(X_{n+1}|{\tilde{\boldsymbol{{X}}}}_{B_{ir}^c}\notin PoP_4\right)\right].\end{align}
And again, application of Corollary 1 leads to
 \begin{align*}\mathbf{E}_{3}\!\left(X_{n+1}|{\tilde{\boldsymbol{{X}}}}_{B_{ir}^c}\notin PoP_4\right) & = \sum_{d=0}^{n-i}\sum_{e=1}^{\tiny{\binom{n-i}{d}}}\!\left(\frac{\omega_3}{1-\omega_4}\right)^{d}\left(\frac{1-\omega_3-\omega_4}{1-\omega_4}\right)^{n-i-d}\!\frac{\omega_3}{1-\omega_4}\mathbf{E}_{1}\!\left(X_{n+1}|{\tilde{\boldsymbol{{X}}}}_{B_{de}}\in PoP_3\right)\\[1pt] & \quad +\sum_{d=0}^{n-i}\sum_{e=1}^{\tiny{\binom{n-i}{d}}}\left(\frac{\omega_3}{1-\omega_4}\right)^{d}\left(\frac{1-\omega_3-\omega_4}{1-\omega_4}\right)^{n-i-d}\\[1pt] & \qquad\qquad \frac{1-\omega_3-\omega_4}{1-\omega_4}\mathbf{E}_{2}\!\left(X_{n+1}|{\tilde{\boldsymbol{{X}}}}_{B^c_{de}}\notin PoP_3\right)\end{align*}
 \begin{align*} \mathbf{E}_{2}\!\left(X_{n+1}|{\tilde{\boldsymbol{{X}}}}_{B_{de}^c}\notin PoP_3\right) &= \sum_{h=0}^{n-i-d}\sum_{o=1}^{\tiny{\binom{n-i-d}{h}}}\left(\frac{\omega_2}{1-\omega_3-\omega_4}\right)^{h}\left(\frac{\omega_1}{1-\omega_3-\omega_4}\right)^{n-i-d-h}\\[4pt]& \qquad\qquad\qquad\qquad\qquad \frac{\omega_2}{1-\omega_3-\omega_4}\mathbf{E}_{1}\!\left(X_{n+1}|{\tilde{\boldsymbol{{X}}}}_{B_{ho}}\in PoP_2\right)\\[4pt] & +\sum_{h=0}^{n-i-d}\sum_{e=1}^{\tiny{\binom{n-i-d}{h}}}\left(\frac{\omega_2}{1-\omega_3-\omega_4}\right)^{h}\left(\frac{\omega_1}{1-\omega_3-\omega_4}\right)^{n-i-d-h}\\[4pt] & \qquad\qquad\qquad\qquad\qquad \frac{\omega_1}{1-\omega_3-\omega_4}\mathbf{E}_{1}\!\left(X_{n+1}|{\tilde{\boldsymbol{{X}}}}_{B^c_{ho}}\in PoP_1\right).\end{align*}
The exact credibility mean is well-known for a 1-component normal mixture distribution (Bühlmann & Gisler, Reference Bühlmann and Gisler2005), using this knowledge, we may have
 \begin{align*}\mathbf{E}_{1}\!\left(X_{n+1}|{\tilde{\boldsymbol{{X}}}}_{B_{ir}}\in PoP_4\right) & = \frac{ib_4^2}{ib_4^2+\sigma_4^2}\bar{x}_{B_{ir}}+\frac{\sigma_4^2}{ib_4^2+\sigma_4^2}\mu_4,\,\,for\,i=0,\cdots,n,\\\mathbf{E}_{1}\!\left(X_{n+1}|{\tilde{\boldsymbol{{X}}}}_{B_{de}}\in PoP_3\right) & = \frac{db_3^2}{db_3^2+\sigma_3^2}\bar{x}_{B_{de}}+\frac{\sigma_3^2}{db_3^2+\sigma_3^2}\mu_3,\,\,for\,d=0,\cdots,n-i,\\\mathbf{E}_{1}\!\left(X_{n+1}|{\tilde{\boldsymbol{{X}}}}_{B_{ho}}\in PoP_2\right) & = \frac{hb_2^2}{hb_2^2+\sigma_2^2}\bar{x}_{B_{ho}}+\frac{\sigma_2^2}{hb_2^2+\sigma_2^2}\mu_2,\,\,for\,h=0,\cdots,n-i-d,\\\mathbf{E}_{1}\!\left(X_{n+1}|{\tilde{\boldsymbol{{X}}}}_{B_{ho}^c}\in PoP_1\right) & = \frac{(n-i-d-h)b_1^2}{(n-i-d-h)b_1^2+\sigma_1^2}\bar{x}_{B_{de}^c}\\& \quad +\frac{\sigma_1^2}{(n-i-d-h)b_1^2+\sigma_1^2}\mu_1,\,\,for\,h=0,\cdots,n-i-d. \end{align*}
Putting the above findings in Equation (11), the Bayesian credibility mean is
 \begin{align*}\mathbf{E}_{4}\!\left(X_{n+1}|{\tilde{\boldsymbol{{X}}}}\right) & = \omega_4\!\left[\zeta_4\bar{ x}+(1-\zeta_4)\mu_4 \right]+\omega_3\!\left[\zeta_3\bar{ x}+(1-\zeta_3)\mu_3 \right]+\omega_2\!\left[\zeta_2\bar{ x}+(1-\zeta_2)\mu_2 \right]\\& \quad +\,\omega_1\!\left[\zeta_1\bar{ x}+(1-\zeta_1)\mu_1 \right],\end{align*}
where
 \begin{align*} \zeta_1 & = \sum_{i=0}^n\omega_4^i(1-\omega_4)^{n-i}\sum_{d=0}^{n-i}\left(\frac{\omega_3}{1-\omega_4}\right)^{d}\left(\frac{1-\omega_3-\omega_4}{1-\omega_4}\right)^{n-i-d}\\ & \quad \times\sum_{h=0}^{n-i-d}\left(\frac{\omega_2}{1-\omega_3-\omega_4}\right)^{h}\left(\frac{\omega_1}{1-\omega_3-\omega_4}\right)^{n-i-d-h}\\[3pt] & \quad \times\frac{(n-i-d-h)b_1^2 }{(n-i-d-h)b_1^2+\sigma_1^2}\binom{n}{i}\binom{n-i}{d}\binom{n-i-d}{h}\\[3pt]\zeta_2 & = \sum_{i=0}^n\omega_4^i(1-\omega_4)^{n-i}\sum_{d=0}^{n-i}\left(\frac{\omega_3}{1-\omega_4}\right)^{d}\left(\frac{1-\omega_3-\omega_4}{1-\omega_4}\right)^{n-i-d}\end{align*}
 \begin{align*} &\quad \times\sum_{h=0}^{n-i-d}\left(\frac{\omega_2}{1-\omega_3-\omega_4}\right)^{h}\left(\frac{\omega_1}{1-\omega_3-\omega_4}\right)^{n-i-d-h}\frac{hb_2^2 }{hb_2^2+\sigma_2^2}\binom{n}{i}\binom{n-i}{d}\binom{n-i-d}{h}\\\zeta_3 & = \sum_{i=0}^n\omega_4^i(1-\omega_4)^{n-i}\sum_{d=0}^{n-i}\left(\frac{\omega_3}{1-\omega_4}\right)^{d}\left(\frac{1-\omega_3-\omega_4}{1-\omega_4}\right)^{n-i-d}\frac{db_3^2}{db_3^2+\sigma_3^2}\binom{n}{i}\binom{n-i}{d}\\\zeta_4 & = \sum_{i=0}^n\omega_4^i(1-\omega_4)^{n-i}\frac{ib_4^2}{ib_4^2+\sigma_4^2}\binom{n}{i}.\end{align*}
In the above two examples, we just consider a situation, in which all elements of the mixture distributions belong to a family of distribution. The following example considers a case that the mixture distributions are the union of different distributions. Using Atienza et al. (Reference Atienza, Garcia-Heras and Munoz-Pichardo2006)’s method, we established (but for briefness we eliminate its proof) that a mixture union of Gamma, Lognormal and Weibull distributions constructs a class of identifiable distributions. Therefore, without any concern about identifiability, we may consider the following example.
Example 4. Suppose that under Model Assumption 1, the random sample
 $X_1,X_2,\cdots,X_n,$
given parameter vector
 $\boldsymbol{\Psi}=(\theta_1,\theta_2,\theta_3),$
has been distributed according the following distribution
 \begin{equation*}\omega_1 Gamma(\alpha, \theta_1)+\omega_2LN\!\left(\theta_2,\sigma_0^2\right)+\omega_3Weibull(\theta_3,\lambda),\end{equation*}
where parameters
 $\alpha,$
 $\sigma_0^2,$
 $\lambda$
are given and given weights
 $\omega_1,$
 $\omega_2$
and
 $\omega_3$
satisfy
 $\omega_1+\omega_2+\omega_3=1.$
Moreover, suppose that
 $\theta_1,$
 $\theta_2$
and
 $1/\theta_3,$
respectively, have the conjugate prior distribution
 $Gamma(\alpha_1,\beta_1),$
 $N\!\left(\mu_2,b_2^2\right)$
and
 $Gamma(\alpha_3,\beta_3).$
It is well-known that the exact Bayesian credibility mean for a 1-component Gamma mixture, a 1-component Lognormal mixture and a 1-component Weibull mixture distributions, respectively, are
 \begin{align*}\mathbf{E}_{1}\!\left(X_{n+1}|{\tilde{\boldsymbol{{X}}}}_{B_{ir}}\in PoP_3\right) & =\frac{\left(\sum_{k\in B_{ir}}x_k^\lambda +\beta_2\right)}{(i+r_2-1)},\,\,for\,i=0,\cdots,n,\\[3pt]\mathbf{E}_{1}\!\left(X_{n+1}|{\tilde{\boldsymbol{{X}}}}_{B_{de}}\in PoP_2\right) & =\frac{b_2^2 \sum_{k\in B_{de}}Ln(x_k)+\mu_2\sigma_2^2}{db_2^2+\sigma_2^2},\,\,for\,d=0,\cdots,n-i,\\[3pt]\mathbf{E}_{1}\!\left(X_{n+1}|{\tilde{\boldsymbol{{X}}}}_{B_{de}^c}\in PoP_2\right) & =\frac{\sum_{k\in B^c_{de}}x_k+\beta}{(n-i-d)\alpha_1+r_1}\,\,for\,d=0,\cdots,n-i,\end{align*}
see Bühlmann & Gisler (Reference Bühlmann and Gisler2005), among others, for more details.
Using the above results along with double applications of Corollary 1, the Bayesian credibility mean is
 \begin{align*}\mathbf{E}_{3}(X_{n+1}|{\tilde{\boldsymbol{{X}}}}) & = \omega_3\sum_{i=0}^n\sum_{r=1}^{\tiny{\binom{n}{i}}}\omega_3^i(1-\omega_3)^{n-i} \mathbf{E}_{1}\!\left(X_{n+1}|{\tilde{\boldsymbol{{X}}}}_{B_{ir}}\in PoP_3\right)\\& \quad +(1-\omega_3)\sum_{i=0}^n\sum_{r=1}^{\tiny{\binom{n}{i}}}\omega_3^i(1-\omega_3)^{n-i}\mathbf{E}_{2}\!\left(X_{n+1}|{\tilde{\boldsymbol{{X}}}}_{B_{ir}^c}\notin PoP_3\right)\\& = \omega_3\sum_{i=0}^n\sum_{r=1}^{\tiny{\binom{n}{i}}}\omega_3^i(1-\omega_3)^{n-i} \mathbf{E}_{1}\!\left(X_{n+1}|{\tilde{\boldsymbol{{X}}}}_{B_{ir}}\in PoP_3\right)\end{align*}
 \begin{align*}& \quad +(1-\omega_3)\sum_{i=0}^n\sum_{r=1}^{\tiny{\binom{n}{i}}}\omega_3^i(1-\omega_3)^{n-i}\sum_{d=0}^{n-i}\sum_{e=1}^{\tiny{\binom{n-i}{d}}}\left(\frac{\omega_2}{1-\omega_3}\right)^{d}\left(\frac{\omega_1}{1-\omega_3}\right)^{n-i-d}\\[4pt]& \qquad \times \frac{\omega_2}{1-\omega_3}\mathbf{E}_{1}\!\left(X_{n+1}|{\tilde{\boldsymbol{{X}}}}_{B_{de}}\in PoP_2\right)\\[4pt]& \quad +(1-\omega_3)\sum_{i=0}^n\sum_{r=1}^{\tiny{\binom{n}{i}}}\omega_3^i(1-\omega_3)^{n-i}\sum_{d=0}^{n-i}\sum_{e=1}^{\tiny{\binom{n-i}{d}}}\left(\frac{\omega_2}{1-\omega_3}\right)^{d}\left(\frac{\omega_1}{1-\omega_3}\right)^{n-i-d}\\[7pt]& \quad \times \frac{\omega_1}{1-\omega_3}\mathbf{E}_{1}\!\left(X_{n+1}|{\tilde{\boldsymbol{{X}}}}_{B_{de}^c}\in PoP_1\right)\\[7pt]& = \omega_1\!\left[(1-\zeta_1)\frac{\beta_1}{\alpha_1}+\zeta_1\frac{\sum_{i}^nx_i}{n}\right]+\omega_2\!\left[(1-\zeta_2)\mu_2+\zeta_2\frac{\sum_{i}^nln(x_i)}{n}\right]\\[7pt]& \quad +\omega_3\!\left[(1-\zeta_3)\frac{\beta_3}{\alpha_3}+\zeta_3\frac{\sum_{i}^nx_i^\lambda}{n}\right],\end{align*}
where
 \begin{align*} \zeta_1 & = \sum_{i=0}^n\omega_3^i(1-\omega_3)^{n-i+1} \sum_{d=0}^{n-i}\left(\frac{\omega_2}{1-\omega_3}\right)^{d}\left(\frac{\omega_1}{1-\omega_3}\right)^{n-i-d}\frac{(n-i-d)\alpha_1}{(n-i-d)\alpha_1+r_1}\tiny{\binom{n-i}{d}}\tiny{\binom{n}{i}}\\\zeta_2 & = \sum_{i=0}^n\omega_3^i(1-\omega_3)^{n-i+1} \sum_{d=0}^{n-i}\left(\frac{\omega_2}{1-\omega_3}\right)^{d}\left(\frac{\omega_1}{1-\omega_3}\right)^{n-i-d} \frac{db_2^2}{db_2^2+\sigma_2^2}\tiny{\binom{n-i}{d}}\tiny{\binom{n}{i}}\\ \zeta_3 & = \sum_{i=0}^n\omega_3^i(1-\omega_3)^{n-i}{\tiny{\binom{n}{i}}}\frac{i}{i+r_2-1}.\end{align*}
The next section develops a practical idea based on the logistic regression to derive a probabilistic model to use the additional information
 $Z_{i,1}\cdots,Z_{i,m}$
to assign population’s weight whenever, we partition measurable space
 $\mathcal{X}$
into two populations.
5. Logistic Regression Credibility for Two Populations
Consider a situation that the measurable space
 $\mathcal{X}$
can be partitioned into two populations. Moreover, suppose that for each random variable
 $X_i$
there is some additional information
 $Z_{i,1}\cdots,Z_{i,m},$
are available. Now using the logistic regression, one may evaluate the first Population’s weight by
 \begin{align}\omega & = P\!\left(X_i \in PoP_1|z_{i,1}\cdots,z_{i,m}\right)\nonumber \\[4pt] & = \frac{\exp\!\left\{\beta_{0}+\sum_{l=1}^{m}\beta_{l}z_{i,l}\right\}}{1+\exp\!\left\{\beta_{0}+\sum_{l=1}^{m}\beta_{l}z_{i,l}\right\}}.\end{align}
Therefore, the result of Corollary 1 can be simplified by the following. Since this result initiated from the logistic regression, hereafter now, we call it “Logistic Regression Credibility.”
Remark 1. Suppose that measurable space
 $\mathcal{X}$
can be partitioned into two populations, then, under Model Assumption 1, the Bayesian credibility mean is
 \begin{align*} E_2\!\left[X_{n+1}|X_1,X_2,...,X_{n}\right]& = \sum_{i=0}^{n}\sum_{r=1}^{\binom{n}{i}}\omega^i(1-\omega)^{n-i} \left[\omega E_1\left(X_{n+1}|\tilde{X}_{B_{ir}}\in PoP_1\right)\right.\\& \quad \left. +\, (1-\omega)E_{1}\!\left(X_{n+1}|\tilde{X}_{B^c_{ir}}\notin PoP_1\right)\right],\end{align*}
where
 $\omega$
is given by Equation (13).
The following example represents a practical application of the Logistic Regression Credibility (given by Remark 1)
Example 5. Suppose an insurance company based upon its past experience classified its policyholders in two homogenous groups, labelled “Group 1” and “Group 2,” where claim size distribution for the Group 1 is a Normal distribution (with mean
 $\theta_1$
and variance
 $0.36$
) and for the Group 2 is a Normal distribution (with mean
 $\theta_2$
and variance
 $0.40$
) where
 $\theta_1$
and
 $\theta_2,$
respectively, have been distributed according
 $N(9,0.25)$
and
 $N(10, 0.25).$
Moreover, suppose that the insurance company developed the following logistic regression model to assign its policyholder to the “Group 1”
 \begin{eqnarray}P(Y=1|{\boldsymbol{{z}}}) = \frac{\exp\{20.33+1.37z_1-2.87z_2+0.10z_3-10.06z_4+0.50z_5\}}{1+\exp\{20.33+1.37z_1-2.87z_2+0.10z_3-10.06z_4+0.50z_5\}},\end{eqnarray}
where
 $z_1,\cdots, z_5,$
respectively, stand for Gender (0=male and 1=female), Marital Status (0=single and 1=Married), Age (ranges from 20 to 80), Occupation class (distinct values 1,2, 3, and 4) and location (distinct values 1 to 30).
Now consider a 40 years single man who lives in location labelled 9 and his job is labelled 3. Moreover, suppose that his 10 years loss reports are
 $16.19502,$
 $13.92823,$
 $15.69760,$
 $15.00515,$
 $15.30293,$
 $16.54005,$
 $16.03626,$
 $16.84823,$
 $14.49716,$
 $14.75258.$
Using the Equation (14), the policyholder with probability
 $\omega=0.2378$
(
 $1-\omega=0.7622$
) belongs to “Group 1” (“Group 2”), and his next year Bayesian credibility premium is
 \begin{align*}E_2[X_{11}|X_1,X_2,...,X_{10}] & = \sum_{i=0}^{10}\sum_{r=1}^{\binom{10}{i}}\omega^i(1-\omega)^{10-i}\bigg[\omega E_1\!\left(X_{11}|\tilde{X}_{B_{ir}}\in PoP_1\right)\\& \quad +(1-\omega)E_{1}\!\left(X_{11}|\tilde{X}_{B^c_{ir}}\notin PoP_1\right)\bigg] = 16.79856.\end{align*}
The Logistic Regression Credibility, say LRC, and the Regression Tree Credibility, say RTC, share a same idea. Both of them use a statistical model to partition the measurable space
 $\mathcal{X}$
into some populations. But, the RTC method develops a credibility prediction for each population while the LRC provides just one credibility prediction for all populations with different weight. The following subsection shows that at least for some cases the LRC has a lower risk function.
5.1 Logistic regression credibility versus the regression tree credibility
Diao & Weng (Reference Diao and Weng2019) introduced the RTC model. Their model, in the first step, employs some statistical techniques (such as logistic regression) to partition the measurable space
 $\mathcal{X}$
into some small regions in which a simple model provides a good fit. Then, in the second step, for each region they applied the Bühlmann-Straub credibility premium formula for each region to predict credibility premium prediction. More precisely, given observed data
 $X_i$
and its associated information
 $Z_{i,1}\cdots,Z_{i,m},$
for
 $i=1,\cdots,n.$
Using a statistical model, such as logistic regression given by Equation (13), it determines the probability that such claim experience
 $X_1,X_2,\cdots,X_{n}$
arrives from the Population 1. If such a probability passes
 $1/2,$
the credibility premium predicts using the model which developed for Population 1, otherwise, the model developed for Population 2.
Under the squared error loss function, the RTC method decreases risk function of prediction compared to the regular credibility method. Diao & Weng (Reference Diao and Weng2019) presented its theoretical proof for the situation where measurable space
 $\mathcal{X}$
has been partitioned into two distinguished classes.
The following lemma shows that at least for an interval about
 $1/2,$
the LRC’s risk function dominates the RTC’s risk function.
Lemma 5.
Under Model Assumption 1, consider two following different scenarios to predict the credibility mean based upon the i.i.d. random claim experience
 $X_1,X_2,\cdots,X_{n}.$
.
-
Scenario 1 (the LRC approach): The claim experience
$X_1,X_2,\cdots,X_n,$
given parameter vector
$\boldsymbol{\Psi}=(\theta_1,\theta_2)^\prime,$
has been distributed according the following 2-component normal mixture distribution
$\omega N\!\left(\theta_1,\sigma_1^2\right)+(1-\omega)N\!\left(\theta_2,\sigma_2^2\right),$
where
$\sigma_1^2,$
$\sigma_2^2$
are given,
$\omega\in[0,1]$
and for
$j=1,2,$
$\theta_j$
has the conjugate prior distribution
$N\!\left(\mu_j,\tau_j^2\right).$
-
Scenario 2 (the RTC approach): The measurable space
$\mathcal{X}$
partitions into two populations in which if the i.i.d. random claim experience
$X_1,X_2,\cdots,X_{n}$
are belong to Population
$j=1,2,$
then
$E(X_i)=\mu_j,$
$Var(E(X_i|\Theta)) =\tau^2_j$
and
$E( Var(X_i|\Theta))= \sigma^2_j.$


Then, at least for the situation that the population’s weight,
 $\omega,$
(given by Equation (13)) locates in an interval
 $I=\left[\left(\tau_2^2 - R_2\right)/\left(R_1+\tau_2^2\right),\,\, (R_1+R_2)/\left(R_2+\tau_1^2\right)\right] $
under the squared error loss function, the LRC’s risk function dominates the RTC’s risk function, where
 $R_l =\sigma_l^2\tau_l^2/\left(n \tau_l^2+\sigma_l^2\right)$
for
 $l=1,2.$
Proof. Similar to Example 2, one may show that under the Scenario 1, the Bayesian credibility premium is
 $\omega[\xi_1\bar{X}+(1-\xi_1)\mu_1] +(1-\omega)[\xi_2\bar{X}+(1-\xi_2)\mu_2]$
and its corresponding risk function under the squared error loss function is
 \begin{eqnarray*} L_{LRC}(\omega) = \omega^2 \bigg[ \xi_1^2 \frac{\sigma_1^2}{n} +(1-\xi_1)^2 \tau_1^2 \bigg]+ (1-\omega)^2 \bigg[ \xi_2^2\frac{\sigma_2^2}{n} + (1-\xi_2)^2 \tau_2^2 \bigg] ,\end{eqnarray*}
where
 $\xi_1=\sum_{i=0}^{n} \omega^i (1-\omega)^{n-i}\binom{n}{i}\frac{i\tau_1^2}{i\tau_1^2 + \sigma_1^2}$
and
 $\xi_2=\sum_{i=0}^{n} \omega^i (1-\omega)^{n-i}\binom{n}{i}\frac{(n-i)\tau_2^2}{(n-i)\tau_2^2 + \sigma_2^2}.$
However under the Scenario 2, since the RTC method employs the Bühlmann-Straub credibility premium formula, its credibility premium is
 $ \alpha_j\bar{X} + \left(1- \alpha_j\right) \mu_j,$
where
 $\alpha_j = \frac{n}{n + \sigma^2_j/\tau^2_j},$
whenever Population
 $j=1,2$
has been chosen. Therefore, its corresponding risk function under the squared error loss function is
 \begin{eqnarray*} L_{RTC}(\omega) = \omega\bigg[ \alpha_1^2 \frac{\sigma_1^2}{n} + (1-\alpha_1)^2 \tau_1^2 \bigg] + (1-\omega) \bigg[ \alpha_2^2 \frac{\sigma_2^2}{n} + (1-\alpha_2)^2 \tau_2^2 \bigg]\end{eqnarray*}
where the probability that the past claim experience
 $X_1,X_2,\cdots, X_n$
belong to Population 1,
 $\omega,$
derived from Equation (13).
Now observe that, difference between the above two risk functions,
 $L_{LRC}(\omega) - L_{RTC}(\omega),$
can be restated as
 \begin{align*} & = \omega\frac{\sigma_1^2 \tau_1^2}{n} \sum_{i=0}^{n} \omega^i (1-\omega)^{n-i} \binom{n}{i}\tau_1^2\left[\frac{i \omega^{\frac{1}{2}}}{i\tau_1^2 + \sigma_1^2} +\frac{n}{n\tau_1^2 + \sigma_1^2}\right]\left[\frac{i \omega^{\frac{1}{2}}}{i\tau_1^2 + \sigma_1^2} -\frac{n}{n\tau_1^2 + \sigma_1^2}\right] \\[3pt] & \quad +\omega\frac{\sigma_1^2 \tau_1^2}{n} \sum_{i=0}^{n} \omega^i (1-\omega)^{n-i} \binom{n}{i} n\sigma_1^2\left[\frac{ \omega^{\frac{1}{2}}}{i\tau_1^2 + \sigma_1^2} + \frac{1}{n\tau_1^2+\sigma_1^2}\right]\left[\frac{ \omega^{\frac{1}{2}}}{i\tau_1^2 + \sigma_1^2} -\frac{1}{n\tau_1^2+\sigma_1^2}\right] \end{align*}
 \begin{align*} & \quad +(1-\omega)\frac{\sigma_2^2 \tau_2^2}{n} \sum_{i=0}^{n} \omega^i (1-\omega)^{n-i} \binom{n}{i} \tau_2^2\left[\frac{(n-i) (1-\omega)^{\frac{1}{2}}}{(n-i)\tau_2^2 + \sigma_2^2} +\frac{n}{n\tau_2^2 + \sigma_2^2}\right]\left[\frac{(n-i) (1-\omega)^{\frac{1}{2}}}{(n-i)\tau_2^2 + \sigma_2^2}\right.\\ & \qquad\qquad\qquad\qquad\qquad \left. -\frac{n}{n\tau_2^2 + \sigma_2^2}\right]\\[3pt] & \quad +(1-\omega)\frac{\sigma_2^2 \tau_2^2}{n} \sum_{i=0}^{n} \omega^i (1-\omega)^{n-i} \binom{n}{i} n \sigma_2^2\left[\frac{ (1-\omega)^{\frac{1}{2}}}{(n-i)\tau_2^2 + \sigma_2^2} + \frac{1}{n\tau_2^2+\sigma_2^2}\right]\left[\frac{ (1-\omega)^{\frac{1}{2}}}{(n-i)\tau_2^2 + \sigma_2^2}\right.\\ &\qquad\qquad\qquad\qquad \left.-\frac{1}{n\tau_2^2+\sigma_2 ^2}\right]\\[3pt] & = \omega\frac{\sigma_1^2 \tau_1^2}{n} \sum_{i=0}^{n} \omega^i (1-\omega)^{n-i} \binom{n}{i}\left[ \tau_1^2 \left( \left(\frac{i \omega^{\frac{1}{2}}}{i\tau_1^2 + \sigma_1^2}\right)^2 - \left(\frac{n}{n\tau_1^2 + \sigma_1^2}\right)^2 \right) +n \sigma_1^2 \left( \left(\frac{ \omega^{\frac{1}{2}}}{i\tau_1^2 + \sigma_1^2}\right)^2\right.\right.\\ &\qquad\qquad\qquad\qquad\qquad\qquad\qquad\left.\left. - \left(\frac{1}{n\tau_1^2+\sigma_1^2}\right)^2 \right) \right]\\[3pt] & \quad +(1-\omega)\frac{\sigma_2^2 \tau_2^2}{n} \sum_{i=0}^{n} \omega^i (1-\omega)^{n-i} \binom{n}{i}\left[ \tau_2^2 \left( \left(\frac{(n-i)(1-\omega)^{\frac{1}{2}}}{(n-i)\tau_2^2 + \sigma_2^2}\right)^2 - \left(\frac{n}{n\tau_2^2 + \sigma_2^2}\right)^2 \right)\right.\\[3pt] & \quad \left. +\, n \sigma_2^2 \left( \left(\frac{ (1-\omega)^{\frac{1}{2}}}{(n-i)\tau_2^2 + \sigma_2^2}\right)^2 - \left(\frac{1}{n\tau_2^2+\sigma_2^2}\right)^2 \right) \right]\\[3pt] & = \omega\frac{\sigma_1^2 \tau_1^2}{n} \sum_{i=0}^{n} \omega^i (1-\omega)^{n-i} \binom{n}{n-i}\left[ \frac{(n-i)^2 \tau_1^2 \omega+n\sigma_1^2\omega}{\left((n-i)\tau_1^2+\sigma_1^2\right)^2}- \frac{n^2\tau_1^2+n\sigma_1^2}{\left(n\tau_1^2+\sigma_1^2\right)^2} \right]\\[3pt] & \quad +(1-\omega)\frac{\sigma_2^2 \tau_2^2}{n} \sum_{i=0}^{n} \omega^i (1-\omega)^{n-i} \binom{n}{i}\left[(1-\omega) \frac{(n-i)^2 \tau_2^2 +n\sigma_2^2}{\left((n-i)\tau_2^2+\sigma_2^2\right)^2}- \frac{n^2\tau_2^2+n\sigma_2^2}{\left(n\tau_2^2+\sigma_2^2\right)^2} \right]\\[3pt] & = \sum_{i=0}^{n} \omega^i (1-\omega)^{n-i} \binom{n}{i} H_i(\omega), \end{align*}
where
 \begin{align*} H_i(\omega) & = \omega\frac{\sigma_1^2 \tau_1^2}{n} \left[ \frac{i^2 \tau_1^2\omega+n\sigma_1^2\omega}{\left(i\tau_1^2+\sigma_1^2\right)^2}-\frac{n^2\tau_1^2+n\sigma_1^2}{\left(n\tau_1^2+\sigma_1^2\right)^2} \right]\\[4pt]& \quad +(1-\omega)\frac{\sigma_2^2 \tau_2^2}{n}\left[ \frac{(n-i)^2\tau_2^2(1-\omega)+n\sigma_2^2(1-\omega)}{\left((n-i)\tau_2^2+\sigma_2^2\right)^2}-\frac{n^2\tau_2^2+n\sigma_2^2}{\left(n\tau_2^2+\sigma_2^2\right)^2} \right].\end{align*}
Now without losing the generality, assume that we can take a derivative with respect to i and observe
 \begin{eqnarray*} M_i\,:\!=\,\frac{\partial H_i(\omega)}{\partial i} = - \omega^2 \frac{\sigma_1^2\tau_1^2}{n} \frac{2 \tau_1^2 \sigma_1^2 (n-i)}{\left(i \tau_1^2 +\sigma_1^2\right)^3} + (1-\omega)^2 \frac{\sigma_2^2 \tau_2^2}{n}\frac{2 i \tau_2^2 \sigma_2^2 }{\left((n-i) \tau_2^2 + \sigma_2^2\right)^3}\end{eqnarray*}
at
 $i=0,$
 $M_0\lt 0,$
at
 $i=n,$
 $M_n>0,$
and
 $\partial^2H_i(\omega)/\partial^2 i>0.$
This means
 $H_i(\omega)$
is a concave function with respect to i that attains its maximum at
 $i=0$
and
 $i=n.$
Therefore,
 \begin{align} L_{LRC}(\omega) -L_{RTC}(\omega) \leq \sum_{i=0}^{n} \omega^i (1-\omega)^{n-i} \binom{n}{i}H_0(\omega)=H_0(\omega)\end{align}
 \begin{align} L_{LRC}(\omega) - L_{RTC}(\omega) \leq \sum_{i=0}^{n} \omega^i (1-\omega)^{n-i}\binom{n}{i}H_n(\omega)=H_n(\omega).\end{align}
Imposing negativity on Equations (15) and (16), perspectively, lead to
 $\omega\leq(R_1+R_2)/\left(\tau_1^2+R_2\right)$
and
 $1-\omega\leq(R_1+R_2)/\left(\tau_2^2+R_1\right).$
This observation completes the desired result.
One should note that, the above
 $H_i(\omega)$
also can be stated as
 \begin{align*} H_i(\omega) & = \left(A_i^{(1)}C^{(1)} + A_i^{(2)} C^{(2)}\right) \omega^2 + \left({-}B^{(1)}C^{(1)} - 2 A_i^{(2)} C*{(2)} + B^{(2)} C^{(2)}\right) \omega\\& +\left( A_i^{(2)} C^{(2)} - B^{(2)} C^{(2)} \right),\end{align*}
where
 $A_i^{(l)} = \frac{(n-i)^2 \tau_l^2+n\sigma_l^2}{\left((n-i)\tau_l^2+\sigma_l^2\right)^2} $
,
 $B^{(l)}=\frac{n^2\tau_l^2+n\sigma_l^2}{\left(n\tau_l^2+\sigma_l^2\right)^2} $
and
 $C^{(l)} =\frac{\sigma_l^2 \tau_l^2}{n} $
for
 $l=1,2.$
Since
 $A^{(l)}_i$
is an increasing function with respect to i, one may observe that
 $A^{(l)}_i\leq A^{(l)}_n$
and
 $A_0^{(l)} =B^{(l)}.$
This fact allows one to conclude that
 \begin{align*}4H_i(\omega=0.5) & = A^{(1)}_iC^{(1)}_i-7A^{(2)}_iC^{(2)}-2B^{(1)}C^{(1)}-2B^{(2)}C^{(2)}\\& = C^{(1)}\left[A^{(1)}_i-2B^{(1)}\right]-7A^{(2)}_iC^{(2)}-2B^{(2)}C^{(2)}\\& \leq C^{(1)}\left[A^{(1)}_n-2B^{(1)}\right]-7A^{(2)}_iC^{(2)}-2B^{(2)}C^{(2)}\\& = -C^{(1)}B^{(1)}-7A^{(2)}_iC^{(2)}-2B^{(2)}C^{(2)}\\& \leq 0\end{align*}
and consequently
 $L_{LRC}(\omega=0.5) - L_{RTC}(\omega=0.5)\leq0.$
The continuation of
 $L_{LRC}(\omega) - L_{RTC}(\omega)$
in
 $\omega$
shows that at least in an interval about
 $\omega=0.5$
the LRC’s risk function dominates the RTC’s risk function. This means that at least in a situation where one with probability a bit more than 50% is going to assign the past claim experience to one of the population and using the RTC’s method derives the credibility mean for the future claim. We suggest him/her to use the LRC’s method.
Figure 1 illustrates behaviour of
 $L_{LRC}(\omega) -L_{RTC}(\omega)$
with respect to
 $\omega,$
for some values of
 $(n,\sigma_1, \sigma_2, \tau_1, \tau_2).$
Behaviour of
 $L_{LRC}(\omega) -L_{RTC}(\omega)$
with respect to
 $\omega,$
under Lemma 5’s assumptions, whenever
 $(n,\sigma_1,\sigma_2, \tau_1, \tau_2)=$
(10, 1, 2, 1, 2) (Panel, a);
 $(50,1, 2, 1, 2)$
(Panel, b); (100, 1, 2, 1, 2) (Panel, c);
 $(10, 2,1, 10, 12)$
(Panel, d); (50, 2, 1, 10, 12) (Panel, e);
 $(100, 2,1, 10, 12)$
(Panel, f); (10, 200, 1, 10, 120) (Panel, g);
 $(50,200, 1, 10, 120)$
(Panel, h); and (100, 200, 1, 10, 120) (Panel, i).

6. Discussion and Suggestions
This article considered the Bayesian credibility prediction for the mean of
 $X_{n+1}$
under a finite class of mixture distributions. In the first step, it developed a recursive formula for the Bayesian credibility mean under such a class of distributions. Since the implementation of the recursive formula is very expensive (see Example 1), therefore, it imposed some additional conditions on the problem. More precisely, it assumed random variables
 $X_i,$
for
 $i=1,\cdots,n$
, corresponding to the observed sample
 $x_i$
accompanied with additional information
 $Z_{i,1},\cdots,Z_{i,m},$
where under a probabilistic model one may use such observable information to determine the population of random variables
 $X_i,$
see Model Assumption 1 for more details. Under this new assumption, it developed an exact Bayesian credibility mean whenever all members of such a class of mixture distributions belong to the single-parameter exponential family of distributions. Finally for a situation that the measurable space
 $\mathcal{X}$
can be partitioned into two populations, it employed the logistic regression and introduced the Logistic Regression Credibility which in the sense of the risk function in some specific population’s weight dominates the Regression Tree Credibility.
We should note that assumption on the additional information
 $Z_{i,1},\cdots,Z_{i,m},$
has a slight difference by assumption on latent variable
 $Z_{ij}$
in the EM algorithm (see Note 2). More precisely, under Model Assumption 1,
 $Z_{i,1},\cdots,Z_{i,m}$
are observable and give a probabilistic information about distribution of random variable
 $X_i,$
say population’s weight. While under the missing data approach,
 $Z_{ij}$
is a latent variable which provides certain information about distribution
 $X_i.$
This fact persuades us to claim assumptions in Model Assumption 1 are available and practicable in many cases, see Example 5 as an evidence.
Our finding can be extended for (1) other indices of
 $X_{n+1}$
, such as the variance of
 $X_{n+1},$
as represented in Equation (3), (2) the M-parameter exponential family of distributions, and (3) the Bayesian non-parametric credibility under the Dirichlet process mixture models, which introduced by Fellingham et al. (Reference Fellingham, Kottas and Hartman2015) and enriched by Hong & Martin (Reference Hong and Martin2017, Reference Hong and Martin2018).
To see the second possible extension, the following recalls Jewell (Reference Jewell1974)’s findings for the M-parameter exponential family of distributions with probability density/mass function
 \begin{eqnarray}f(x|\theta) = a(x)e^{\sum_{m=1}^{M}\phi_m(\theta)t_m(x)}/c(\theta)\,\,\forall\,x\in S_X,\end{eqnarray}
where
 $a({\cdot}),$
 $\phi_{m}({\cdot}),$
 $t_{m}({\cdot}),$
for
 $m=1,2,\cdots,M,$
are given functions and the normalising factor
 $c({\cdot})$
is defined based on the fact that
 $\int_{S_X}f(x|\theta)dx=1.$
To derive the Bayesian credibility prediction for a given index of
 $X_{n+1}$
under the M-parameter exponential family of distributions, he set
 $\eta_m=-\phi_m(\theta),$
and considered the conjugate prior distribution
 \begin{eqnarray*}\pi^{conj}(\Delta) = [c(\Delta)]^{-\alpha_{0}}e^{\sum_{m=1}^{M}\left\{-\beta_{0m} \eta_m\right\}}/d(\alpha_{0},\beta_{0}),\end{eqnarray*}
where
 $\Delta=(\eta_1,\eta_2,\cdots,\eta_M)^\prime.$
Then, he showed the Bayesian credibility can be expressed based on the sufficient statistics
 $t_m({\cdot})$
as
 \begin{eqnarray}E(t_m(X_{n+1})|X_1,\cdots,X_n) = \zeta_n{\bar t}_{m,n}({\tilde{\boldsymbol{{x}}}})+(1-\zeta_n)\frac{\beta_{0m}}{\alpha_0},\,for\,m=1,2,\cdots,M,\end{eqnarray}
where the credibility factor
 $\zeta_n=n/(n+\alpha_0)$
and
 ${\bar t}_{m,n}({\tilde{\boldsymbol{{x}}}})=\sum_{i}^{n}b_m(x_i)/n.$
Acknowledgements
The authors would like to appreciate anonymous reviewers for their constructive comments which improve theoretical foundation and presentation of this article.



