

Over the past several decades the transition to democracy in countries throughout the world ushered in nominal political reform. In some of these countries, the adoption of formal democratic procedures like elections did not lead to expected outcomes, such as alternation in power. In dominant party systems where free and fair elections are held, a single political party repeatedly wins national elections. Dominant parties have a monopoly on state resources, enjoy support from societal elites and have a broad coalition of voters. Given the overwhelming advantages that these parties enjoy in the political arena, any electoral defeat they face is a significant event. What explains opposition party growth in a dominant party system?
The existing explanations of competitive elections in dominant party systems focus on how defections from the ruling party (Reuter and Gandhi Reference Reuter and Gandhi2011; van de Walle Reference Van de Walle and Schedler2006) and the formation of opposition coalitions (Arriola Reference Arriola2012; Bunce and Wolchik Reference Bunce and Wolchik2010; Howard and Roessler Reference Howard and Roessler2006; Langfield Reference Langfield2014) make opposition electoral victories possible. While there is less focus on how a bottom-up strategy facilitates opposition party growth, recent studies examine opposition parties in local government. Charles Hankla and Carrie Manning (Reference Hankla and Manning2016) examine how the creation of a subnational elected government creates incentives for the formation of opposition parties and puts pressure on dominant parties and established opposition parties to focus more on the quality of local governance. Other studies on this topic emphasize the role of spatial diffusion (Hiskey and Canache Reference Hiskey and Canache2005; Lucardi Reference Lucardi2016), in which opposition victories in one locality are likely to result in future victories in neighbouring areas. What remains unexamined in the literature is whether the performance of opposition parties in local government explains their electoral growth. Do opposition parties expand support by using their tenure in local government to show non-core voters that they represent a credible alternative to the ruling party?
To address this issue, this study examines how performance in local politics contributes to the growth of the Democratic Alliance (DA) party – the largest opposition party in South Africa. Not only does the DA face the traditional hurdles that opposition parties face in dominant party regimes, but given its Apartheid-era origins, the party is widely regarded as representing white interests. With an electorate that is majority black, the DA faces the reality of having to appeal to non-white voters. Based on an original panel data set that spans all four local government elections and consists of census, spatial and electoral data collected at the smallest electoral unit in South Africa (the ward), my statistical analysis shows that where the DA is the incumbent party, improvements in non-white household access to basic services such as piped water, refuse collection and flush toilets are associated with an increase in the party's vote share. Access to basic services in South Africa is probably shaped by the legacy of Apartheid, where it can be assumed that white households are more likely than non-whites to have access to water, proper sanitation and regular refuse disposal today. By focusing on changes in non-white access to service delivery in areas where the DA is the incumbent party, we can directly evaluate whether improvements in local service delivery for non-white households earn the DA support from groups that are non-traditional constituencies for the party. While support for the DA among non-whites has grown slowly over time, examining changes in access to basic services in non-white households helps us determine whether support for the DA has grown in areas where access to basic services has improved for these communities.
In addition to traditional measures of basic service delivery, I also find that when DA-run wards outperform wards run by the African National Congress (ANC), support for the DA in surrounding wards increases. This finding shows that opposition parties can challenge the hegemony of the ruling party by using local government to prove that they present a viable alternative to the ruling party. In what follows, before turning to the data set and regression analysis, I first examine the scholarship on explanations for opposition victories in uncompetitive party systems, and then examine the factors that contribute to opposition growth at the local level.
Sources of competitive elections in dominant party systems
What are the sources of competitive elections in dominant party systems? Here, I draw on the literature on elections in competitive authoritarian hegemonic regimes because of the structural similarities of the challenges that face opposition parties in dominant parties across regime type. Studies of politics in competitive authoritarian party systems focus on two factors that contribute to opposition growth: defections from the ruling party and opposition coalitions.
To begin with, dominant parties gain their hegemonic status because of their ability to incorporate a broad range of interest groups (Reuter Reference Reuter2017). The ruling party's unrivalled ability to distribute patronage provides elites with strong incentives to stay in the party and makes joining the opposition unattractive (Greene Reference Greene2010). Managing a diverse coalition of party members and voters over time, however, is not easy. Elite defections from the ruling party are a major signal that the party's power is eroding. Prominent party leaders leave the party during times of economic crisis (Reuter and Gandhi Reference Reuter and Gandhi2011) when the incumbent's fortunes are weakened, and when they feel that their grievances have been neglected (Brownlee Reference Brownlee2007). The decision to split with the ruling party can also be prompted by institutional changes that give elites an incentive to seek opportunities outside the party (Garrido de Sierra Reference Garrido de Sierra2013). And when party elites do leave the party, they often take with them blocs of voters that are important to the dominant party's coalition.
While prominent political elites have parted ways with the ANC in the past, so far the trend has not posed a grave threat to the ruling party. A recent example is Julius Malema's departure from the ANC following his falling out with former president Jacob Zuma. Malema went on to form the Economic Freedom Fighters (EFF) party in 2013. The 2016 election was the first municipal elections the EFF contested and it won 8% of the vote share, with its strongest showing in Limpopo and Northwest provinces. While breakaway parties publicly highlight factional disputes inside the ruling party, defections alone are not sufficient to create party competition at the local level.
The other important source of competitive elections in a dominant party system comes from outside the party. The development of coalitions among opposition parties and candidates is a strategy that can challenge the dominant party in both national elections and at the subnational level. Opposition unity in a party system dominated by a single party, however, can be difficult for several reasons. Individually, opposition parties often lack independent financial resources to challenge the incumbent. This problem is greatly magnified in countries where the incumbent has strong ties to business elites. The likelihood of opposition coalitions forming is highest in countries that experience liberalizing financial reforms, where the incumbent's monopoly over access to capital is weakened (Arriola Reference Arriola2012). Another problem for opposition coordination in a dominant party system is that opposition parties tend to be at the extremes of the political spectrum, relative to the ruling party and each other (Greene Reference Greene2007). In the case of Mexico during the government of the Partido Revolucionario Institucional (PRI), opposition parties were mainly built by ideologically oriented activists and candidates, which resulted in niche parties that could only appeal to a narrow segment of the electorate. This was in contrast to the dominant PRI, which occupied the centre of the ideological spectrum. Furthermore, the niche opposition parties that did form in Mexico were ideologically extreme relative to one another, with some on the far left and others on the far right. While these parties may have disparate political ideologies, there are overarching concerns that unify them, such as grievances against the ruling party's corruption. Previous studies show that the creation of viable opposition coalitions contributed to incumbent turnover in several competitive authoritarian regimes (Donno Reference Donno2013; Howard and Roessler Reference Howard and Roessler2006). Even at the subnational level, the formation of opposition coalitions is a strategy for taking control of cities once ruled by the incumbent party (Langfield Reference Langfield2014).
Although opposition coordination and unity are important for the defeat of dominant parties at the ballot box, the success of pre-electoral coalitions in local government elections in South Africa is mixed (Langfield Reference Langfield2014). This reality is further complicated by the fact that the main opposition parties – the DA and EFF – are at opposite ends of the political ideological spectrum. Party elites do not agree on a common political vision for the country, and while certain opposition parties form post-election coalition governments in some metropolitan cities, it remains uncertain whether they will make the compromises needed to form a united bloc against the ANC.
If large-scale defections and opposition coalition formation have limited relevance for explaining the growth of the opposition in South Africa, can the South African case be used to explain how opposition parties grow? I argue that South Africa is a good case to examine how local politics contribute to the rise of competitive elections in dominant party systems. Due to the decentralized nature of the state, local governments in South Africa have greater administrative and fiscal autonomy from the central government. The main administrative function of local government is the provision of basic services and assisting with the implementation of local development projects. Municipalities are tasked with providing basic services such as water, sanitation, refuse collection and electricity. Regarding fiscal matters, the central government is responsible for transferring funds to provinces and municipalities, while municipalities are also required to raise their own sources of revenue. The fiscal responsibility of municipalities in South Africa means that the performance of the party in office matters for the financial health of municipalities and cities. Also, because there are vastly more administrative units in local government than at the national level, studying local elections in South Africa provides greater analytical leverage in explaining the variation in support for political parties.
While South Africa has the hallmarks of democracy, the long-standing dominance of the ANC in national politics, and the uneven playing field that opposition parties operate on (based on the ANC's control of state resources and influence over media), place the country in the same category as competitive authoritarian regimes around the world. Undoubtedly, there is less political repression of the opposition in South Africa compared with countries such as Tanzania, Malaysia and Russia. However, it is theoretically fruitful to situate South Africa within the recent literature on competitive authoritarian regimes that examines the regime (de)stabilizing function of institutions such as parties, legislatures and subnational elections (Reuter and Turovsky Reference Reuter and Turovsky2014). Studying the centrality of local elections in explaining the growth of opposition parties in South Africa informs and expands the scope of the literature on the sources of competitive elections in dominant party regimes.
Generally, it is easier for opposition party building at the local level to occur in fiscally decentralized political systems, where local governments are empowered with control over the collection of taxation at the subnational level. So long as local governments are dependent on the central government for revenue generation and distribution, opposition parties cannot feasibly create independent bases of support at the local level. This study examines how opposition parties in decentralized political environments take advantage of the structural factors that make their presence in local government possible.
This study makes several unique contributions to the study of party politics in South Africa. Earlier studies on opposition mobilization in South Africa focus mainly on national elections and do not examine the role of local politics in explaining the growth of opposition parties. The few studies on local politics and party-building are based on case studies of individual cities (Benit-Gbaffou Reference Benit-Gbaffou2012; Prevost et al. Reference Prevost, Kotze and Wright2014). Also, previous studies on the DA focus on how racial politics inhibit the party's ability to expand support beyond its core voters. The DA is a party that has origins in the Apartheid era, and the legacy of Apartheid on South Africa's political system is such that political party bases are identified with particular racial groups. The ANC capitalizes on this political history and its identification with the black liberation struggle by branding the DA as a white party that is detached from the interests of black voters. While scholars of South Africa recognize that good performance in local government might be a way for the DA to overcome its image problem with black voters (Ferree Reference Ferree2010; Langfield Reference Langfield2014), this article tests this argument using a systematic analysis of local government and local election data. The next section provides an overview of the local determinants of support for opposition parties in a dominant party framework.
The local logic of opposition party growth
In a dominant party system, voters lack information about how opposition parties would perform if they were in government. The ability of opposition parties to overcome this information barrier is based on two factors. First, they have to win elections in local office, and then expand their base of support by winning more offices. As previous studies show, opposition parties have an easier time winning office in big metropolitan cities (Magaloni Reference Magaloni2006; Resnick Reference Resnick2012). The lower barrier to entry for opposition parties in urban centres is often a result of factors such as the decreased prevalence of clientelism (compared with rural areas, where the ruling party dominates) and demographic factors that are favourable to the opposition – opposition supporters may be wealthier and more educated. Once the opposition consolidates support from its core constituents, its ability to govern major cities or provinces is a visible source of information for swing voters throughout the country that the ruling party is not invincible.
After an opposition party secures some seats in local office, its ability to attract swing voters depends on it presenting itself as a viable alternative to the ruling party. If the ruling party has a reputation for being corrupt, one way that challengers can counter this narrative is by earning a reputation for good governance. Performance in local government is especially important in societies where the delivery of basic services is uneven and the demand for public goods such as piped water, refuse collection and sanitation is high. In many developing countries, service delivery is highly localized. The party (or coalition) in charge of local government is tasked with providing basic services and promoting development in their area. While public goods such as education and healthcare are often the domains of the national government, at the local level, local parties and politicians play an important role in basic service delivery. Local officials are responsible for delivering basic services that affect daily life, and as a result, mismanagement of local government is particularly damaging to the ruling party's image among voters. Local government officials represent the face of the party at the local level, and voters are most likely to turn to them when service delivery breaks down. In such a context, opposition parties stand to benefit from cultivating a reputation for running local governments that deliver services well, and for eschewing corruption.
I argue that one strategy that facilitates opposition growth in a dominant party system is service delivery at the local level. Due to the ruling party's incumbency advantage, opposition parties in this type of party system have no record of holding political office, particularly at the national level. This creates a situation in which voters are uncertain whether the opposition would represent a viable alternative to the ruling party. I argue that the delivery of basic services in local government strengthens support for opposition parties in a dominant party system when the ruling party has a reputation for corruption and mismanagement of local government.
In South Africa, the excesses and corruption of ANC elites and local government officials are widely publicized. Opposition parties capitalize on these instances of malfeasance by highlighting them in press releases and by frequently lodging legal injunctions against the ANC. In one instance, the DA mayor of Pretoria, Solly Msimanga, uncovered that a large portion of public money was siphoned away from the city's public coffers under the previous ANC-led city administration (News 24 2017). Corruption is a political issue to which the ANC's base is sensitive (Russell Reference Russell2015); by drawing attention to and sanctioning the ruling party's mismanagement of local government, opposition parties can establish good governance credentials.
Not only do opposition parties have to denounce the ruling party's corruption, but they also have to rid their ranks of corrupt officials. Following a bitter public battle, the DA recently expelled former Cape Town mayor Patricia de Lille from the party after evidence emerged that she was mismanaging municipal resources. Public disavowals of corrupt behaviour, especially from co-partisans, show voters that opposition parties take good performance in local government seriously.
In this article I examine whether the DA is rewarded with re-election for delivering the basic services that are local government responsibilities – piped water, refuse collection and proper sanitation. I test the following hypothesis:
Hypothesis 1: In places where the DA is the incumbent party, increased provision of basic services will increase support for the party.
In addition to analysing the delivery of basic services, how well the DA performs relative to the ruling party is also significant. Residents in one location are likely to notice how the quality of life in their area compares with that of surrounding areas. And given that ward councillors are the party representatives in their wards, it is likely that many residents attribute the problems and success of their ward to the party in charge. The DA may be more likely to earn support in a ward if the residents notice that the neighbouring DA-run wards are better off than the ones under ANC control. For a given ward w, in election year time t, the Overperformance hypothesis is the following:
Hypothesis 2: The electoral performance of the DA in ward w at time t will be better if the wards neighbouring w that are run by the DA performed better than neighbouring ANC-run wards since t−1.
One of the concerns with studying opposition governance at the local level is that central governments (who control the distribution of resources to local governments) engage in political distortion of public goods, making it difficult for opposition parties to have the resources necessary to run local government. Is there a reason to expect that the ANC-run central government engages in political manipulation of government resources? A common feature of other dominant party systems is that the central government funnels resources towards places where its core supporters live, and punishes defectors by providing them with fewer public goods or ‘pork’ (Blaydes Reference Blaydes2010; Magaloni Reference Magaloni2006; Scheiner Reference Scheiner2006).
In South Africa, the central government is responsible for providing funding to municipalities to implement service delivery. The principle of non-bias and fair access for all to service delivery was launched in 1997 by Nelson Mandela's government (De Kadt and Lieberman Reference De Kadt and Lieberman2017). National government allocations come from the Treasury, which determines the amount of funds available to particular local governments. The majority of these transfers are known as a ‘Local Government Equitable Share’, which is determined using a needs-based formula, ensuring that municipalities with a larger share of poor households receive equitable funding. There is little credible empirical evidence to suggest that the ANC interferes politically with the distribution of basic services such as water, refuse collection and electricity (De Kadt and Lieberman Reference De Kadt and Lieberman2017). In the sole quantitative study on the distributive politics of central government transfers in South Africa, Verena Kroth (Reference Kroth2014) finds that the ANC-controlled central government provides more intergovernmental transfers to provinces where it faces less political competition. This trend suggests that the party is targeting stronghold provinces, as opposed to provinces that are leaning towards the opposition or are under opposition control. While there may be some distortion in how the ANC allocates resources to provinces, ultimately municipalities are the units responsible for ensuring that budgets from the central government translate into service delivery.
Data and methods
The data set consists of merged census, electoral and spatial data. The unit of analysis is the ward election, indexed by ward w and year t. Below provinces and municipalities, the ward is the smallest electoral unit in South Africa. The total number of ward-year observations is 13,176. The sample covers the 2000–16 local government elections. It should be noted that, unlike municipalities and provinces, wards are not autonomous levels of government. Wards are geopolitical subdivisions of municipalities used for electoral purposes. Specifically, local municipalities are divided into wards, with each ward electing one councillor to the municipal council. Wards are run by ward councillors, who are directly elected and represent political parties (or are independents). Due to South Africa's party-centric electoral system, voters are likely to attribute performance by ward officials to the parties they represent. Also, past studies show that political parties take into account the ability of ward councillors to deliver services when deciding to renominate them for office (Wegner Reference Wegner2016).
The electoral, census and spatial data are from a variety of sources. The electoral data come from the Independent Electoral Commission (IEC), which is the official body that manages elections in South Africa. Raw census data and geospatial census data were obtained from Statistics South Africa (Stats SA). The electoral boundary data were obtained from South Africa's Demarcation Board, which is the official government body in charge of making boundary changes.
When using local-level election and population data in South Africa, the challenge that arises is that ward and municipal boundaries are redistricted before local elections every five years. This makes it difficult to observe changes over time in a single unit. Thus, in order to make accurate observations of changes within electoral units over time, I implement a technique that involves retroactively fitting previous ward and municipal boundaries into the latest local government electoral boundaries, which in this case were created prior to the 2016 local election (De Kadt and Lieberman Reference De Kadt and Lieberman2017; Kroth et al. Reference Kroth, Larcinese and Wehner2016). This process involves taking the smallest unit of census data (the small area layer) and electoral data (the polling station) and spatially fitting them into the 2016 ward and municipal geography. The result is four election years of data that have the same number of wards and municipalities as the 2016 election (4,392 wards and 213 municipalities). The alignment of old boundaries into the 2016 electoral geography makes it possible to observe changes within a municipality or ward, and to compare units across different elections.
Dependent variable: Democratic Alliance vote share
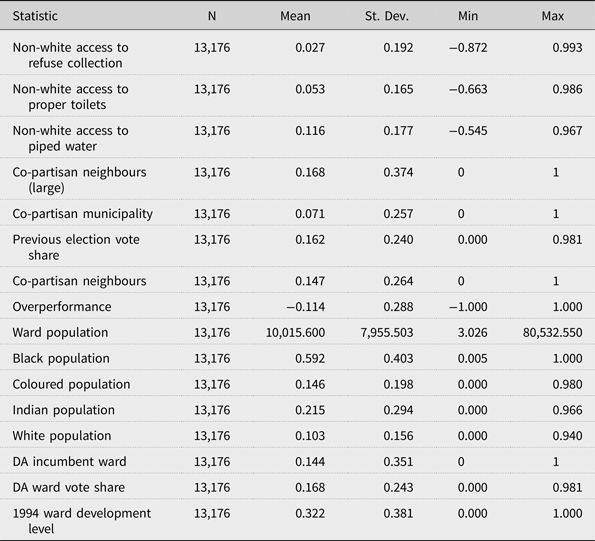
My goal is to analyse how performance in local government explains support for the DA. I first test the performance hypothesis using data on basic service delivery. The outcome variable of interest in the service delivery analysis is the change in the DA's ward vote share when it is the incumbent party. Table 1 provides a summary of all variables in this analysis. The party's vote share in the entire universe of ward-year observations ranges from a low of 0% to a high of 98%, with the mean vote share being 17%. In the wards where it is the incumbent party, the party's mean vote share in all elections was 66%.
Summary Statistics of Variables

Note: The unit of analysis for all variables is the ward level.
Second, I test the Overperformance hypothesis using spatial data on how wards run by the DA compare with neighbouring ANC-run wards. The dependent variable in this analysis is the DA's ward vote share in the ward election.
Independent variables
Basic service delivery
I measure the performance explanatory variable in two ways. The first measure of performance is the change in the proportion of non-white households in a ward that have access to basic services (water, refuse collection and flush toilets).Footnote 1 All references to basic services refer to non-white household access to these services.
Because this variable measures a change over time, the structure of the data is a two-wave panel. The first wave (t 1) of the panel corresponds with census and electoral data from the early 2000s, and the second wave (t 2) corresponds with census and electoral data from the mid- to late 2010s. At t 1, the census data year is 2001, and the elections are the 2000 and 2006 local government elections. At t 2, the census data year is 2011, and the elections are the 2011 and 2016 local government elections. In the regression analysis, the change in household access to water, refuse collection and flush toilets is analysed in wards where the DA was the incumbent party.
Because census data are only collected every decade in South Africa, one limitation of the data is that information on household access to basic services is not available in more frequent intervals. While there is the Community Survey, which is a nationally representative household survey that collects information on access to basic services more frequently, it only records a respondents’ location information at the municipal level, not at the ward level. Since census data are available at lower units of analysis, that is the best available source on service delivery in South Africa.
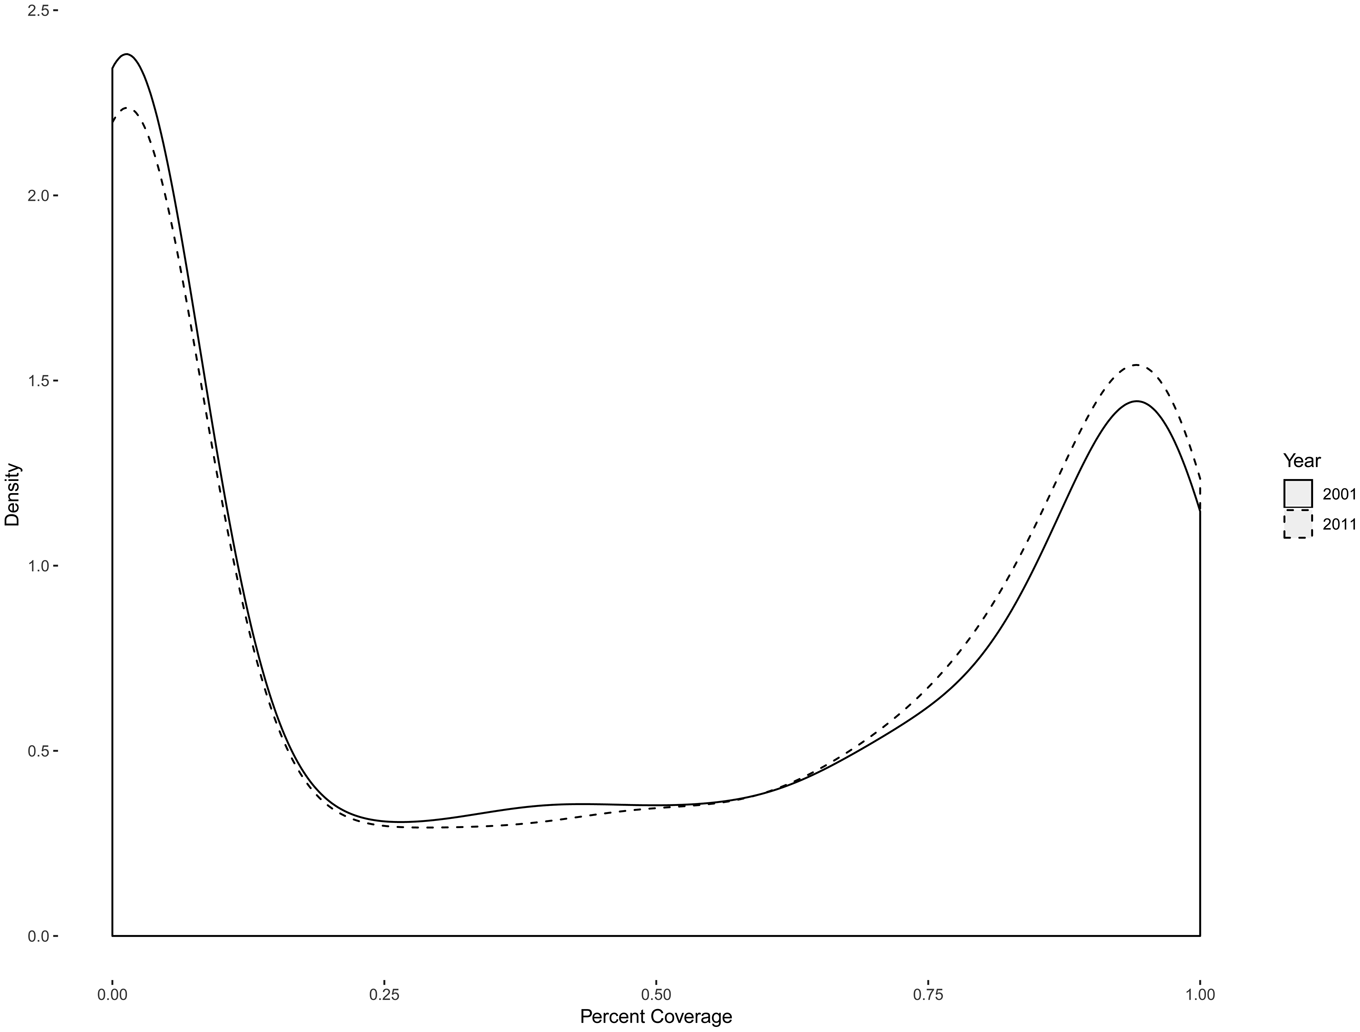
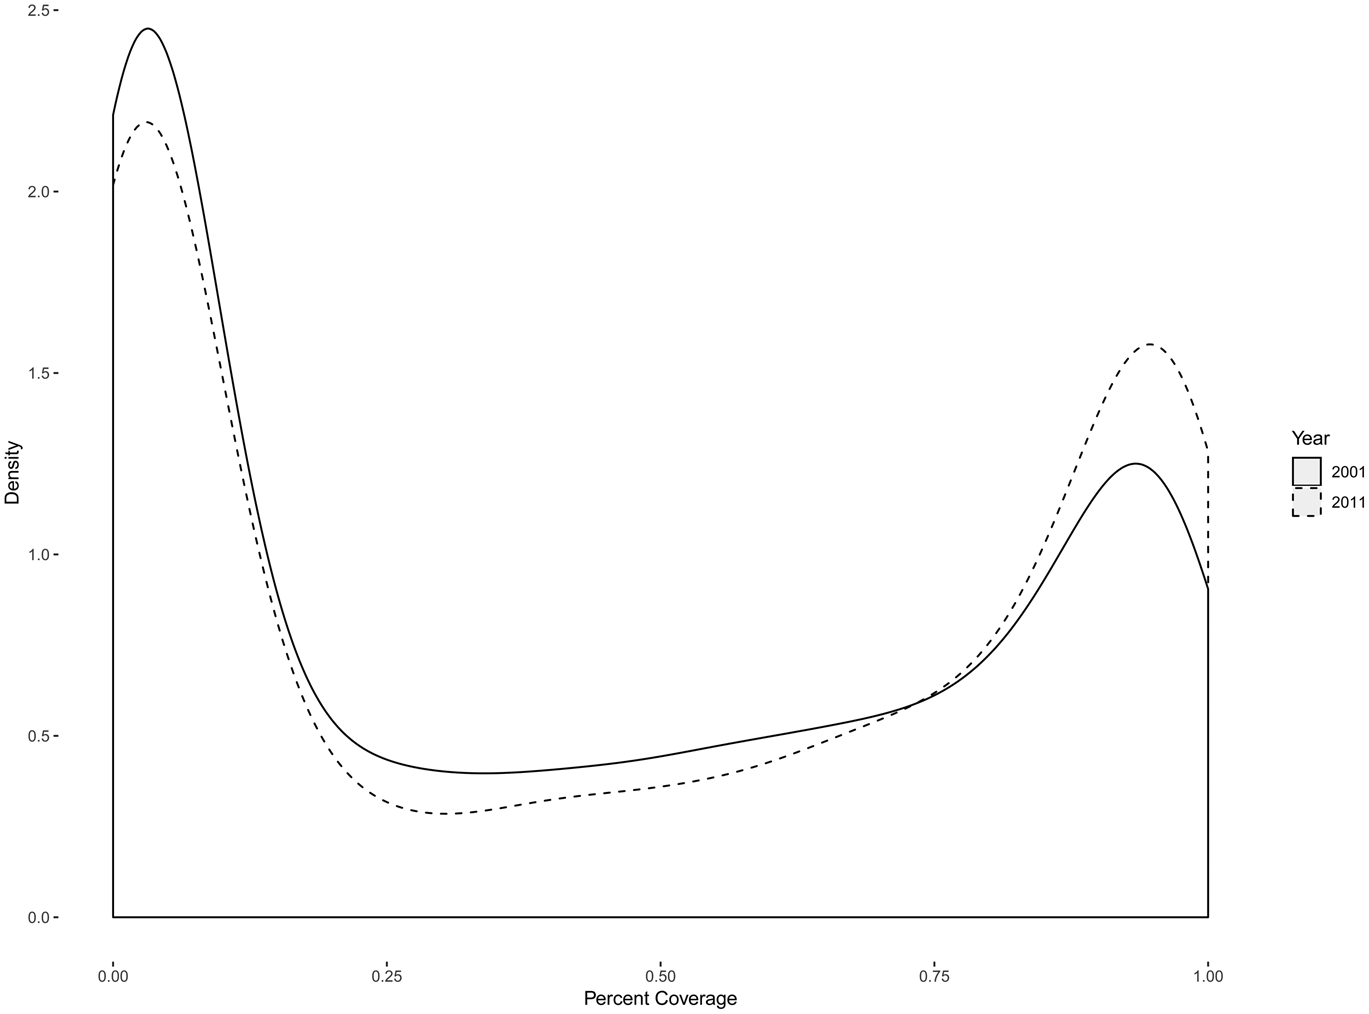
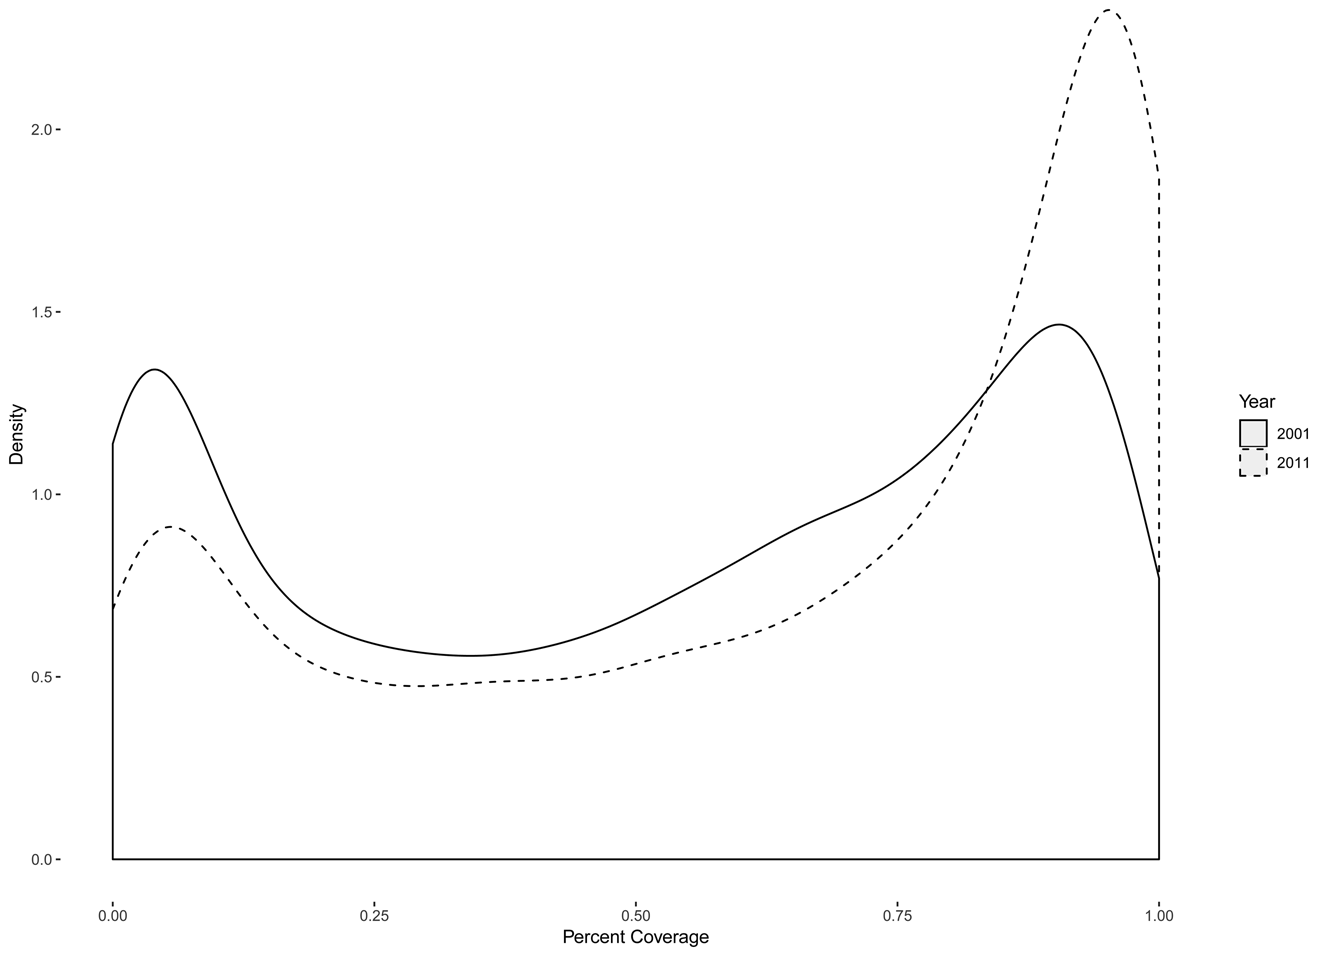
The plots in Figures 1, 2 and 3 show the change in the proportion of non-white households in a ward that have access to refuse collection, flush toilets and piped water, respectively, in South Africa from 2001 to 2011. The solid line is for the year 2001, and the dashed line is for 2011. The x-axis represents the proportion of non-white households with access to each service per ward. Overall, the density plots show that there have been discernible improvements in the number of non-white households with access to these basic services. The distribution of the changes in household access to refuse collection and flush toilets look mostly similar, as they both have a bimodal pattern – there are some wards that have good access to basic services, and others where the majority of households do not have any access. This pattern reflects the deep level of inequality in South Africa, meaning that some wards are very wealthy and others are extremely poor. Access to piped water has improved more than the other public services, as indicated by the larger gap between the two time periods on the right side of the density plot in Figure 3. There are fewer wards where non-white households have no access to piped water inside their home in 2011 than there were in 2001, and the number of wards where the proportion of households with piped water approaches 100% has increased during this time period.
Change in Non-White Household Access to Refuse Collection in a Ward, 2001–11

Change in Non-White Household Access to Flush Toilets in a Ward, 2001–11

Change in Non-White Household Access to Piped Water in a Ward, 2001–11

Overperformance
The second measure of performance is a spatial measure, Overperformance, which is defined as the performance of DA-run wards relative to that of neighbouring ANC-governed ones. Because data for basic services come from census data that are collected in 10-year intervals, instead, I use nightlight data emissions to measure Overperformance. Nightlight data measure the radiance density of light sources emitted from Earth based on gridded maps of the world where each 30-arcsecond pixel (~ 0.86 square kilometres at the Equator) is represented by an integer ranging between 0 and 63. This number measures the amount of luminosity captured by the satellite sensor.Footnote 2 Nightlight data are considered a valid proxy for economic development (Chen and Nordhaus Reference Chen and Nordhaus W2010; Henderson et al. Reference Henderson, Storeygard and Weil2012), and in South Africa they track well with census measures such as household access to electricity, piped water and refuse collection (Kroth Reference Kroth2014). The nightlight data are from the DMSP-OLS satellite, which began collecting annual data in 1992 and finished in 2013. I match nightlight data from 2006 and 2011 to the 2006 and 2011 election years. Because data collection for the satellite ended in 2013, I use the 2013 nightlight data for the 2016 election.
To construct the Overperformance variable, for a given ward w, I take the difference between the average value of nightlight among neighbouring wards governed by the DA and those governed by the ANC. Because the variable is based on a difference, the values can be either positive or negative. Positive values indicate that neighbouring DA wards are governed better, and negative values indicate that neighbouring ANC wards are governed better.
Control variables
I include control variables for several spatial factors that the literature shows affect support for opposition parties in dominant party contexts. Increased support for the DA in one ward may be driven by the fact that the ward is geographically proximate to wards that are already governed by the DA. This is known as horizontal diffusion (Hiskey and Canache Reference Hiskey and Canache2005; Lucardi Reference Lucardi2016), and in the model I control for the proportion of ward w's neighbours that were governed by the DA at the time of election t (Co-partisan Neighbours). Also, increased support for the DA may occur in a ward that falls within the jurisdiction of a higher-level office that the DA already controls. In the case of South Africa, the higher-level office that I focus on is the municipality, which is the electoral unit that wards fall under. I control for the possibility of vertical diffusion using a dummy variable that takes on the value of 1 if the DA controls the municipal government that ward w is in at the time of the election (Co-partisan Municipality). In the data set, 578 DA-incumbent wards are in DA-controlled municipalities, whereas 1,314 DA-incumbent wards are in non-co-partisan municipalities (run by the ANC or other parties). Next, increased support for the DA could be more likely in wards that are located near large urban centres that the DA already controls. The activities of opposition parties are likely to be more visible and influential in large cities, and information about the party's performance may be more salient to wards that are geographically proximate to DA-run cities. I control for this using a variable (Large Municipality) that measures the proportion of co-partisan wards located in large municipalities that are located within a 100-km radius of ward w. Large municipalities are those which have a population of over 100,000 based on 2011 census numbers. Finally, I include control variables for the party's incumbency status in the ward and its vote share in the previous election.
Estimation techniques
I use a first-difference design to estimate how the delivery of basic services explains support for the DA in local elections. The model is expressed as follows:
 $$\Delta VoteShare_{it} = \;{\rm \Delta }\lambda _t + \;\beta _1{\rm \Delta }Non \hbox{-} White\;Service\;Delivery_{wt} + \;\beta _2{\rm \Delta }HouseholdRace\,+ \,\beta _3{\rm \Delta }1994Baseline_{wt} + \;\beta _4{\rm \Delta }LogWardPopulation_{wt} + \;{\rm \Delta }\varepsilon _{wt}$$
where w represents a given ward, and t is the panel year. The change in the DA's ward vote share is the dependent variable. The coefficient β 1 represents the service delivery variables, which are operationalized as the change in the proportion of non-white households in each ward with access to flush toilets, refuse collection and piped water from 2001 to 2011. To take into consideration the fact that local governments were unevenly developed after the transition to democracy because of the legacy of Apartheid, I include a baseline measure of ward development. I use 1994-level nightlight emission data as a proxy for development from the DMSP-OLS data. I selected the year 1994 because this is the year that the transition to democracy occurred and the ANC came to power. This cut-off year provides a snapshot of the level of development across wards in the aftermath of the Apartheid era. Including a baseline measure of ward economic development allows us to control for the possibility that a positive change in access to basic services between 2000 and 2016 is due not to historical advantages but to party performance. I also include control variables for the change in proportion of households in a ward that are black, white and coloured (with Asian as the reference category), and the change in the log population size of a ward.
The first-difference estimation procedure estimates the average association between the change in service delivery and the change in the DA's vote share. This design absorbs time-invariant or slow-changing confounders, such as geographic, economic or social factors. Nonetheless, I also include in the model several time-varying covariates that may impact the relationship between changes in access to basic services and the DA's vote share: the change in the proportion of households in a ward that are black, coloured and white (Indian/Asian is the reference category), and the log change in the ward population. The panel structure of the data coupled with the first-difference regression estimation is a better approach than conventional cross-sectional regressions because the design ensures that fewer non-varying factors are driving the result.
Second, to test the Overperformance hypothesis, I estimate an OLS model with fixed effects that takes the following form:
 $$y_{wt} = \;\beta X_{wt} + \;C_{wt}\,+ \,\mu _w + \;\delta _t + \;\varepsilon _{wt}$$
where y wt is the outcome variable that measures the DA's electoral performance in ward w in year t using the party's ward vote share. Next, X wt is a vector representing the main explanatory variable (Overperformance), and C wt are the following control variables: Co-partisan Neighbours, Co-partisan Municipality, proximity to a large DA-controlled municipality, the party's incumbency status in the ward and its vote share in the previous election. Finally, μ w and δ t are ward and year fixed effects.
Results
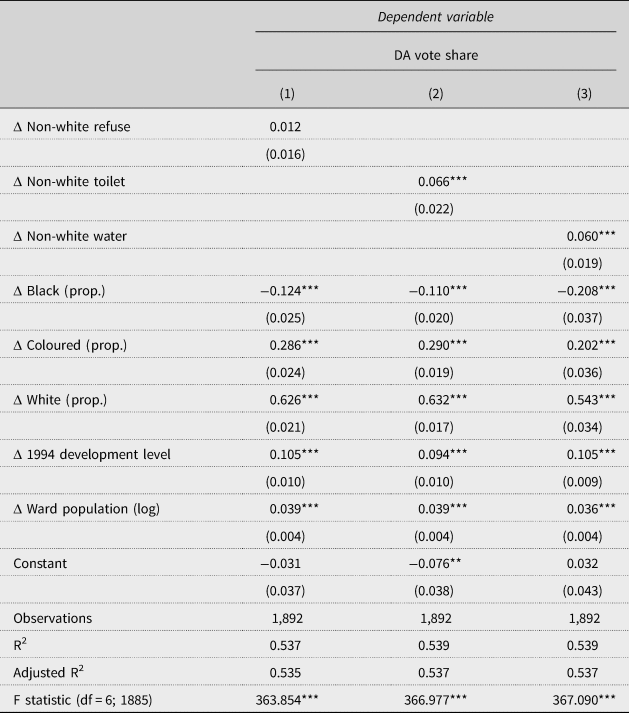
In wards and municipalities where the DA is the incumbent, do improvements in service -delivery help the party grow its support at the local level? Table 2 presents three separate models for each basic service (flush toilets, refuse collection and piped water).
Service Delivery Models, 2000–16

Notes: * p < 0.1; ** p < 0.05; ***p < 0.01. The unit of analysis for all variables is the ward level.
First, the positive direction of the coefficients on all of the service delivery (refuse collection, toilet and water) variables indicates that improvements in service delivery are positively associated with an increase in the DA's vote share. However, only the toilet and water coefficients have an effect on the party's electoral performance, meaning that as the proportion of households with access to proper sanitation and piped water in DA-run wards increased from the 2000 election to the 2016 election, the party's vote share also grew. There is no detectable effect of increased access to routine refuse collection on the party's vote share, as Model 3 in Table 2 shows.
For substantive interpretation, I select the average value of the change in the proportion of households with access to both proper sanitation and piped water, and assess how much the DA's ward vote share increased over the years. The average change in the proportion of households with access to flush toilets was 0.08 (or 8%). In a ward where the proportion of non-white households with access to proper sanitation increased by 5%, the DA's ward vote share increased by 0.5%. The average change in the proportion of non-white households with access to piped water was 12%, and this was associated with a 0.7% increase in the DA's ward vote share.
The coefficients on the remaining covariates of the service delivery models adhere to theoretical expectations, indicating that the fit of the model is strong. The coefficient on the proportion of households in a ward that are black is negative, which confirms the expectation that the DA is likely to earn less support in areas that are predominantly black. On the other hand, the positive coefficients on the coloured and white population variables show that support for the party increases in a ward as the proportion of coloured and white households in a ward increases. This also adheres to our expectations, since white and coloured voters are more likely to support the party than black voters. Next, while the sign on the covariate for baseline ward development is positively associated with support for the DA, the fact that the positive relationship between service delivery and the party's vote share endures despite the inclusion of this covariate suggests that initial development levels may not be correlated with subsequent service delivery levels. Finally, the population of a ward, which is proxy for the level of urbanization, is positively associated with support for the DA. The sign on this covariate confirms the general principal that opposition parties tend to receive more support in urbanized areas.
While the service delivery variables in the first-difference design measure changes in the level of service delivery within wards over time, I check the robustness of the coefficients of these variables by including their lagged levels in the model (see online Appendix A). Adding lagged levels of the explanatory variables allows us to compare the short- and long-term effects of service delivery on the DA's electoral performance. The results are presented in online Appendix A and show that the service delivery variables that had positive coefficients in the original first-difference model (toilets and water) are robust to the inclusion of lagged variables. The coefficient on the refuse collection variable remains statistically insignificant, although the sign on it changes to negative. While the long-term lagged variables in the refuse collection model are also not statistically significant, the short-term lag coefficient is positive, indicating that the DA is rewarded for short-term improvements in access to routine refuse collection. In the toilet model the coefficients on the lagged variables are mixed. In the short term the party is rewarded for increased access to proper sanitation. And while the sign on the coefficients on the long-term lag variables are negative, the variables are statistically insignificant. The lagged variables included in the water model show that the party is rewarded more for long-term changes in access to piped water.
Overall, the results from the service delivery hypothesis indicate that service delivery in local government helps grow support for the DA at the local level. While the relationship between service delivery and electoral support only exists for certain basic services such as improvements to proper sanitation and piped water, the substantive impact of the delivery of these services on electoral support for the DA suggests that a meaningful relationship exists between service delivery and opposition growth at the local level.
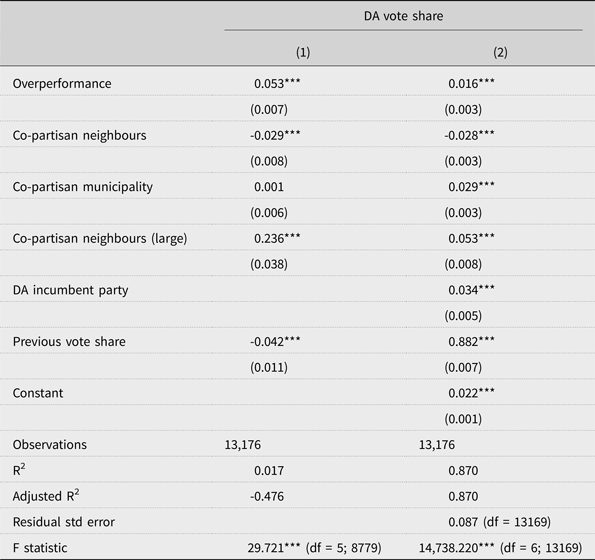
Next, Table 3 shows the results for the Overperformance hypothesis. Model 1 in Table 3 shows the results with ward and year fixed effects, while Model 2 does not include fixed effects. The dependent variable in both models is the DA’s vote share in the election. The coefficient on the Overperformance variable in Model 1 is positive, indicating that as the proportion of DA-run wards surrounding ward w perform better than neighbouring ANC wards, the DA’s vote share in ward w increases in the following election. The result holds after taking into account other spatial factors that may explain increased support for the DA, such as the share of co-partisan neighbouring wards before a given election, the ward’s location within a municipality that the DA already controls, and proximity to large DA-run cities. Although the fit of Model 1 (which includes fixed effects) is not as strong as Model 2, the robust and positive direction of the coefficient in both models suggests that changes in the level of basic service delivery matter not only for the growth in support for the DA, but also for the party’s performance relative to that of the ruling party.
Overperformance Hypothesis

Notes: * p < 0.1; ** p < 0.05; *** p < 0.01. Model 1 includes ward and fixed effects, while Model 2 does not. The unit of analysis for all variables in both models is the ward level.
In sum, the findings from this analysis indicate that basic service delivery alone is not a sufficient measure of opposition party performance. A party's local performance record, relative to that of the ruling party, matters for its electoral success in neighbouring areas.
Conclusion
Local politics are important for evolution away from a dominant party system. Using comprehensive data on local government elections in South Africa's dominant party system, the findings of this article provide systematic quantitative evidence that effective governance by opposition parties at the local level contributes to the parties’ growth. Specifically, this article found that service delivery at the local level contributes to the growth of the DA, which is the largest opposition party in South Africa. Where it is the incumbent party, improvements in non-white household access to proper sanitation and piped water increase the party's vote share. Also, when DA-run wards outperform ANC-run ones, support for the party increases in neighbouring wards. By showing voters it can govern effectively, the DA gives voters information about the party's capacity to be a viable alternative to the ruling party. By measuring performance in local government using data on basic services, which are mostly needed by poor constituents, this study also shows that the DA has the potential to appeal to lower-income communities. In national politics where the ANC remains dominant, the DA is largely shut out from an agenda-setting role, and the party is slow to shed its image as a racially exclusive party. However, at the local level, service delivery is an effective way to appeal to demographics beyond its traditional core of white middle- and upper-class voters.
The findings from this article suggest that dynamics at the local level will contribute to the further erosion of dominant party rule in South Africa. The most promising avenue towards political change depends on whether more black voters will abandon the ruling party. Analysing the first few national elections in the post-Apartheid era, scholars have previously argued that while racial mobilization is an important strategy that keeps the ANC in power, the DA's strategy aimed at persuading the black electorate that it governs better than the ANC may help erode the racial census-like nature of elections (Ferree Reference Ferree2010). The findings from this article add empirical evidence to the possibility that service delivery at the local level as a political strategy may accelerate changes to the DA's party image. These findings also add empirical evidence to the DA's political campaigning claims, which emphasize local service delivery as a central plank in the party's platform. During election campaigns, the party frequently appeals to voters based on its service delivery achievements. Municipalities in the DA-dominated Western Cape receive clean audit reports for efficient service delivery and the transparent management of municipal funds (Makwetu Reference Makwetu2016). In a highly urban country, where the poorest citizens lack proper access to basic services, service delivery in local government will remain relevant in explaining the growth in support for the DA in elections to come.
In the study of dominant party politics, scholars are increasingly recognizing that local elections matter for the erosion of dominant party support (Langfield Reference Langfield2014; Lucardi Reference Lucardi2016). Future studies should examine whether there is a connection between opposition control of subnational office and opposition party performance in national elections. How many offices do opposition parties need to control at the subnational level before they begin to win seats in national elections? In the more politically and fiscally decentralized cases of dominant party rule, local elections will remain a viable avenue for opposition parties to challenge the incumbent's hegemony.
Supplementary material
To view the supplementary material for this article, please go to: https://doi.org/10.1017/gov.2020.7.
Acknowledgements
Thank you to Kathy Bawn, Michael Thies, Edmond Keller, Adam Harris, and Karen Ferree for detailed commentary. I am grateful to Helene Verhoef at Stats SA and James Aphane at the IEC for sharing data. I also appreciate the helpful feedback from the anonymous reviewers.