Implications
This study shows the potential of European Union carcass conformation and fat scores to predict carcass meat proportion, and thus facilitate the operation of a payment system based on meat yield, which would reward farmers more equitably. Also, prediction equations developed from hindquarter composition would reduce the huge cost associated with the whole carcass dissection and make it more beneficial and appealing to those carrying out carcass studies.
Introduction
In the European Union (EU), beef carcasses are classified according to their conformation and fatness (ECIR0811981; Allen, Reference Allen2007). In 2004, Ireland replaced visual assessment with mechanical classification using a video image analysis (VIA) system. Automated classification simply mimics the human assessor by analysing an image of the carcass (Fisher, Reference Fisher2007). Machine classification is deemed preferable to visual assessment because of greater consistency, and producers can have more confidence in the objectivity of the results (Allen, Reference Allen2007). Several studies quantified the associations of ultrasound (Faulkner et al., Reference Faulkner, Parrett, McKeith and Berger1990; Herring et al., Reference Herring, Williams, Bertrand, Benyshek and Miller1994; Hamlin et al., Reference Hamlin, Green, Cundiff, Wheeler and Dikeman1995) and live animal scores (Perry et al., Reference Perry, McKiernan and Yeates1993a and Reference Perry, Yeates and McKiernan1993b) with carcass traits. However, few studies have examined the relationship between EU carcass classification scores and carcass composition (Drennan et al., Reference Drennan, McGee and Keane2008; Conroy et al., Reference Conroy, Drennan, Kenny and McGee2009a and Reference Conroy, Drennan, Kenny and McGee2009b). Muldowney et al. (1997) reported that although conformation (EUROP coded 1 to 5) and fat scores (1 to 5) are routinely measured on beef carcasses, their value as indicators of carcass characteristics and commercial value is not well established. Carcass conformation and fat scores have explained moderate to high proportions of the variation (R 2 ranged from 0.47 to 0.70) in carcass meat yield (Perry et al., Reference Perry, Yeates and McKiernan1993b; Drennan et al., Reference Drennan, McGee and Keane2008; Conroy et al., Reference Conroy, Drennan, Kenny and McGee2009a and Reference Conroy, Drennan, Kenny and McGee2009b). According to Gardner et al. (Reference Gardner, Dolezal, Gardner, Nelson, Schutte, Tatum, Smith, Morgan, Wise and Calkins1997), the evaluation technique used to predict meat yield must be able to function online in a commercial setting without disrupting the normal product flow. Johnson and Chant (Reference Johnson and Chant1998) noted that research has used very expensive technologies to improve the accuracy of carcass composition prediction, whereas Shackelford et al. (Reference Shackelford, Cundiff, Gregory and Koohmaraie1995) reported that, to their knowledge, equations to predict boneless and totally trimmed retail cut yields have not been published.
Considering that payment for carcasses in the EU is based on carcass conformation and fat scores, and that these data are routinely available on carcasses, it seems logical to develop equations that predict carcass meat, fat and bone proportions using these scores. Accurate equations to predict carcass characteristics from routinely collected data would facilitate payment systems based on carcass meat proportion which, in addition to the specific market, is the main determinant of carcass value. Because of the differences in the value of different meat cuts, both meat yield and distribution are the primary determinants of carcass value (Drennan, Reference Drennan2006). Purchas et al. (Reference Purchas, Garrick and Lopez-Villalobos1999) concluded that improvements in accuracy of predicting saleable meat yield proportion would provide an opportunity to increase the premiums paid on carcasses that excel in this characteristic. Payment based on meat yield would also send a stronger market signal to the producer, since in a value-based marketing system, the viability of the beef industry is dependent on the production of high quality, consistent carcasses (Hassen et al., Reference Hassen, Wilson and Rouse1999).
In an industry that is seeking increasingly detailed data on carcass composition, an accurate and rapid technique to estimate carcass composition would be invaluable. A long-term objective of carcass dissection studies should be the development of accurate part to the whole carcass composition relationships that would reduce the resource requirement, which is now an integral part of detailed carcass dissection (Johnson and Charles, Reference Johnson and Charles1981). Zgur et al. (Reference Zgur, Petric and Cepon2006) reported that various individual cuts from the carcass explained moderate to high amounts of variation (0.58 to 0.80) in the percentage of carcass meat, fat and bone.
Therefore, the objectives were (i) to develop and test the accuracy of prediction equations for carcass meat, fat and bone proportions, derived from carcass conformation and fat scores; and (ii) to develop prediction equations for total carcass composition from hindquarter composition.
Material and methods
Animals and management
A total of 662 animals, which included 115 bulls, 40 heifers and 507 steers, were available for the analysis. The animals were partitioned into the following genotype groups: (i) Holstein–Friesian; (ii) early-maturing × Holstein–Friesian and early-maturing × early-maturing; (iii) late-maturing × Holstein–Friesian and late-maturing × early-maturing; and (iv) genotypes with 0.75 or greater late-maturing ancestry.
Bulls were slaughtered at 13 to 17 months of age on three different dates. The heifers were slaughtered at approximately 20 months of age on one day, whereas the steers were slaughtered at approximately 24 months of age on 12 different dates. Before slaughter, the bulls were offered ad libitum access to a barley based concentrate plus 1 kg of grass silage dry matter per head daily or, grass silage plus approximately 4 kg of a barley based concentrate per head daily. The heifers were offered grass silage ad libitum and approximately 4 kg of a barley based concentrate per head daily. The diets offered to the steers before slaughter included either grass silage only, grass or maize silage plus supplementary concentrates, or concentrates offered ad libitum plus 1 kg of roughage dry matter per head daily.
Treatment for endo- and ecto-parasites and vaccination against clostridial and respiratory diseases was carried out as deemed necessary.
Carcass evaluations and measurements
Carcass conformation and fat scores were obtained using the mechanical grading system on a 15-point scale (Hickey et al., Reference Hickey, Keane, Kenny, Cromie, Amer and Veerkamp2007) rather than a 5-point scale (Commission of the European Communities, 1982). Hot weight of both sides of each carcass was recorded and cold carcass weight was taken as 0.98 of hot carcass weight. Following a period of 24 h at 4°C, the right side of each carcass was quartered at the fifth rib into an eight-rib hindquarter (pistola) and the remaining forequarter. After recording the weight, the hindquarter was dissected into 13 cuts (leg, heel, silverside, topside, knuckle, rump, tail of rump, cap of rump, fillet, strip loin, cube roll, cap of rib and eye of the round) from which all visible fat and bone (where applicable) were removed (Conroy et al., Reference Conroy, Drennan, Kenny and McGee2009a). The weight of each individual meat cut and total fat from the hindquarter was recorded, as was bone weight following the removal of all adhering lean tissues. Lean trim was weighed separately and included with the meat cuts to give total hindquarter meat yield. A similar procedure was carried out with the forequarter, which was dissected into 11 cuts (front shin, neck, brisket, chuck, flat ribs (1 to 5), plate, M. triceps brachii, bladesteak, braising muscle, chuck tender and clod; Conroy et al., Reference Conroy, Drennan, Kenny and McGee2009a). Hind-and forequarter meat, fat and bone weights were combined to give the weight of each component in the half carcass. Recovered weights were calculated and expressed as a proportion of side weight to check for errors in weighing (Perry et al., Reference Perry, McKiernan and Yeates1993a).
Statistical analysis
Two series of analyses were undertaken (Statistical Analysis Systems Institute, 2008), where in all cases, the dependent variable was carcass meat, fat or bone proportion. In the first series of analyses, carcass conformation and fat score were included as continuous independent variables, whereas in the second series of analyses, the continuous independent variable was the hindquarter proportion of the dependent variable under investigation (i.e., when the dependent variable was carcass meat proportion, the independent variable was hindquarter meat proportion). In both series of analyses, the same procedures were used.
Preliminary analyses were undertaken on all data to develop the most parsimonious multiple regression prediction model using backward elimination. Gender, linear and nonlinear associations with the regressors, as well as two-way interactions between gender and the continuous independent variables, were initially included in the model; gender was included as a class effect with three levels (bulls, steers and heifers). Terms that did not make a significant contribution (P > 0.05) to the regression equation were removed. The proportion of variation in the dependent variable explained by the model was quantified.
The ability of the developed equation at predicting meat, fat and bone yield was undertaken using cross-validation. This involved omitting each of the 662 animals individually from the development of the prediction equation and then applying the equation to the omitted animal to predict its meat, fat and bone yield. Residuals were calculated as the difference between true total carcass composition and predicted carcass composition. Parameters used to quantify the predictive ability of the equations were (i) the normality of the residuals; (ii) the average bias, computed as the mean of the residuals; (iii) the root mean square error (RMSE), computed as the standard deviation of the residuals; (iv) accuracy of the fit defined as the variance of the dependent variable divided by the sum of the variance of the dependent variable and the variance of the residuals; (v) the 25% and 75% quartiles of the residuals; and (vi) the correlation between the predicted proportions and the residuals.
Additional analyses were undertaken using a fixed effects linear model to determine whether there was any systematic bias in the estimation of total carcass composition across genotype. Genotypes were (i) Holstein–Friesian, (ii) early-maturing × Holstein–Friesian and early-maturing × early-maturing, (iii) late-maturing × Holstein–Friesian and late-maturing × early-maturing and (iv) genotypes with 0.75 or greater late-maturing ancestry. Following the completion of the analysis, prediction equations using carcass conformation and fat scores or hindquarter composition were developed on the entire data set, and they are presented in this study.
Results
The mean, range and standard deviation for live animal, carcass traits and carcass yield components for bulls, heifers and steers are summarised in Table 1. At slaughter, the bulls, heifers and steers had a mean age of 454, 606 and 751 days, a live weight of 583, 535 and 625 kg and a cold carcass weight of 332, 293 and 333 kg, respectively. Carcass conformation scores ranged from 4.7 to 14.4 for bulls, 5.4 to 10.9 for heifers and 2.0 to 12.0 for steers. Corresponding fat scores ranged from 2.7 to 11.5, 3.2 to 11.3, and 2.8 to 13.3.
Mean, standard deviation and range for live and carcass measurements and yield components of bulls, heifers and steers

1Scale 1 to 15.
Prediction equations using carcass conformation and fat scores
Prediction equations developed from the entire data set for carcass meat, fat and bone proportions using carcass conformation and fat scores are summarised in Table 2. Gender was associated (P < 0.001) with carcass composition, although the relationship between either carcass conformation or fat score and carcass composition did not differ by gender. Furthermore, no nonlinear associations (P > 0.05) between carcass conformation or fat score and carcass composition were evident. The correlation between carcass conformation and fat score (r = −0.07) was not different from zero.
Prediction equations for meat, fat and bone proportion estimated using a linear model on the entire data set (662 animals) using carcass conformation and fat score. The table contains the intercept and regression coefficient of the regression model estimated from the entire data set including the R 2 of the model fit using the entire data set. Also included are the bias, root mean square error and accuracy of prediction, as well as the 25% (Q1) and 75% (Q3) quartiles of the residuals, and the correlation between the predicted compositions and residuals (r e)

RMSE = root mean square error.
1Intercept chosen to represent conformation score of eight and fat score of eight; intercepts presented from top to bottom represent bulls, heifers and steers, respectively.
2Example: Meat yield (g/kg) of bulls = 704 + 11.82 × (conformation score − 8) − 9.56 × (fat score − 8).
3Bias not different from zero.
4Correlation not different from zero.
Across genders, and at a constant carcass fat score, a 1-U increase in carcass conformation score on a 15-point scale was associated with an increase in carcass meat proportion of 11.8 g/kg, whereas a 1-U increase in carcass fat score was associated with a 9.6-g/kg decrease in carcass meat proportion. For carcass fat proportion, a 1-U increase in conformation score was associated with a reduction in fat proportion of 4.4 g/kg, whereas 1-U increase in carcass fat score was associated with an increase of 12.0 g/kg in carcass fat proportion. Both regression coefficients in the model showed a negative association with carcass bone proportion, with decreases of 7.4 g/kg and 2.4 g/kg per unit increase in carcass conformation and fat score, respectively.
The prediction of carcass composition from carcass conformation and fat scores across genders accounted for 73%, 67% and 71% of total variation in carcass meat, fat and bone proportions, respectively.
There was no significant bias in estimating carcass composition across all animals nor was there any trend in the bias across different values for each carcass composition trait as evidenced by the lack of a correlation between the residuals and the predicted dependent variable. The RMSE of prediction varied from 11.2 g/kg (carcass bone proportion) to 22.3 g/kg (carcass meat proportion); the accuracy of predicting carcass composition across genders ranged from 0.75 (carcass fat proportion) to 0.79 (carcass meat proportion). In the prediction of carcass meat proportion, 50% of the predicted values were within −14.07 to 15.00 g/kg of the true value. The interquartile range was lower, for the prediction of carcass fat proportion and lower still for the prediction of carcass bone proportion than for carcass meat proportion.
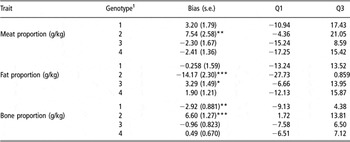
Using the equations developed with carcass conformation and fat scores, there was no bias in prediction for carcass meat proportion across the different genotypes (Table 3), except for genotype 2 (early-maturing × Holstein–Friesian and early-maturing × early-maturing), which was significantly overestimated (7.54 g/kg). Carcass fat proportion was found to be significantly underestimated (−14.18 g/kg) and overestimated (3.29 g/kg) in genotypes 2 (early-maturing × Holstein–Friesian and early-maturing × early-maturing) and 3 (late-maturing × Holstein–Friesian and late-maturing × early-maturing), respectively. Furthermore, carcass bone proportion in genotypes 1 (Holstein–Friesian) and 2 was significantly under- and overestimated by −2.92 g/kg and 6.60, respectively.
Average bias in prediction across genotypes (662 animals) from prediction equation including carcass conformation and fat scores as well as 25% (Q1) and 75% (Q3) quartiles of the residuals

*Value different (P<0.05) from zero.
1Genotypes = (i) Holstein–Friesian (n = 152); (ii) early-maturing × Holstein–Friesian and early-maturing × early-maturing (n = 73); (iii) Late-maturing × Holstein–Friesian and late-maturing × early-maturing (n = 174); and (iv) genotypes with 0.75 or greater late-maturing ancestry (n = 263).
Prediction equations using hindquarter composition
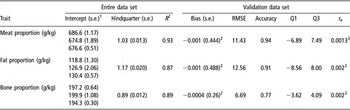
The prediction equations for estimating carcass meat, fat and bone proportions from dissected hindquarter meat, fat and bone proportions are summarised in Table 4.
Prediction equations for meat, fat and bone proportion estimated using a linear model on the entire data set (662 animals) using hindquarter weights. The table contains the intercept and regression coefficient of the regression model estimated from the entire data set including the R 2 of the model fit using the entire data set. Also included are the bias, root mean square error, and accuracy of prediction, as well as the 25% (Q1) and 75% (Q3) quartiles of the residuals, and the correlation between the predicted compositions and residuals (r e)

RMSE = root mean square error.
1Intercept chosen to represent conformation score of eight and fat score of eight; intercepts presented from top to bottom represent bulls, heifers and steers, respectively.
2Bias not different from zero.
3Correlation not different from zero.
Although animal gender was associated (P < 0.001) with carcass meat, fat and bone proportions, the association between total carcass composition and hindquarter composition did not differ by gender nor was the association with hindquarter composition nonlinear.
Regression coefficients for hindquarter meat, fat and bone proportions relative to the corresponding proportion in the carcass were 1.03, 1.17 and 0.89, respectively; the respective R 2 were 0.93, 0.87 and 0.89. The corresponding RMSE values were 11.43, 12.56 and 6.69; accuracy of predicting carcass meat, fat and bone proportions from carcass hindquarter meat, fat and bone was 0.94, 0.91 and 0.77, respectively.
The lack of a significant bias across the entire data set signifies that carcass meat, fat and bone proportions were not under- or overestimated from hindquarter composition. Predictions of carcass meat, fat and bone proportions were underestimated by at least 6.89 g/kg, 8.56 g/kg and 3.62 g/kg, respectively, in 25% of the dataset (i.e., first quartile) and overestimated by at least 7.49 g/kg, 8.00 g/kg and 4.09 g/kg, respectively, in 75% of the data set (i.e., third quartile). Correlations between the residuals and predicted meat, fat and bone proportions were not different from zero.
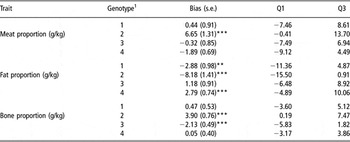
Using the equation developed from hindquarter composition across genotypes for the entire data set (Table 5), carcass meat proportion was significantly overestimated for genotype 2 (6.65 g/kg). Carcass fat proportion was significantly underestimated in genotypes 1 (−2.88 g/kg) and 2 (−8.18 g/kg) and overestimated (2.79 g/kg) in genotype 4. Hindquarter bone over- and underestimated carcass bone proportions for genotypes 2 (3.90 g/kg) and 3 (−2.13 g/kg), respectively.
Average bias in prediction across genotypes (662 animals) from the prediction equation including carcass hindquarter meat, fat and bone proportions as well as 25% (Q1) and 75% (Q3) quartiles of the residuals

*Value different (P < 0.05) from zero.
1Genotypes = (i) Holstein–Friesian (n = 152); (ii) early-maturing × Holstein–Friesian and early-maturing × early-maturing (n = 73); (iii) Late-maturing × Holstein–Friesian and late-maturing × early-maturing (n = 174); and (iv) genotypes with 0.75 or greater late-maturing ancestry (n = 263).
Discussion
Carcass conformation and fat score prediction equations
Carcass conformation and fat scores on a 15-point scale were used in the prediction of carcass composition. Previous studies using 336 steers (Conroy et al., Reference Conroy, Drennan, Kenny and McGee2009a) and 74 bulls (Conroy et al., Reference Conroy, Drennan, Kenny and McGee2009b) showed carcass conformation and fat scores to be potential predictors of carcass meat, fat and bone proportions. This study includes animals used by Conroy et al. (Reference Conroy, Drennan, Kenny and McGee2009a and Reference Conroy, Drennan, Kenny and McGee2009b) in addition to bulls, heifers and steers of other genotypes, thus representing a greater proportion of the EU carcass classification grid.
The proportion of variation explained by the prediction equations in this study using carcass conformation and fat scores for carcass meat proportion (0.73) was similar to the R 2 value of 0.70 reported by Drennan et al. (Reference Drennan, McGee and Keane2008) for bulls, but higher than the value they reported in heifers (R 2 = 0.55). Delfa et al. (Reference Delfa, Ripoll, Panea, Joy and Alberti2007) explained higher amounts of variation (R 2 = 0.97) in carcass muscle weight using hot carcass weight and EU carcass conformation score (on a 15-point scale). However, the latter authors also reported that a lower proportion of variation in carcass meat, fat and bone are explained, when they are expressed as a percentage of carcass. In contrast, Taylor et al. (Reference Taylor, Meehan, Johnson and Ferguson1990) found that using P8 fat thickness and shape score (i.e., carcass conformation) explained little variation (R 2 = 0.17) in carcass meat proportion. Similarly, Perry et al. (Reference Perry, McKiernan and Yeates1993a and Reference Perry, Yeates and McKiernan1993b) in predicting carcass meat proportion using hot carcass weight, P8 fat depth and carcass muscle score (on a 15-point scale) obtained R 2 values of 0.47 and 0.52, which are lower than values obtained in this study. However, according to Amer et al. (Reference Amer, Crump and Simm1998), carcass conformation score has emerged as a more important determinant of value of finished cattle than was implied previously.
The proportion of variation in total carcass fat proportion explained by carcass conformation and fat scores in this study (0.67) is within the range of 0.57 to 0.77 reported for bulls, steers and heifers (Taylor et al., Reference Taylor, Meehan, Johnson and Ferguson1990; Drennan et al., Reference Drennan, McGee and Keane2008). Equations developed by Jones et al. (Reference Jones, Tong and Robertson1989) using visual carcass muscle and fat thickness scores on the cold carcass explained 56% of total variation in carcass fat proportion. Using stepwise regression, Delfa et al. (Reference Delfa, Ripoll, Panea, Joy and Alberti2007) reported that EU carcass fat score (on a 15-point scale) explained 32% of total variation in carcass fat weight, increasing to 39% when hot carcass weight was added and to 60% with the addition of EU carcass conformation score.
Carcass conformation and fat scores accounted for 0.71 of total variation in carcass bone proportion, which is considerably greater than the values of 0.34 and 0.30 obtained by Drennan et al. (Reference Drennan, McGee and Keane2008) for bulls and heifers, respectively. The low R 2 values obtained by those authors may be attributed to the fact that the animals used were 7/8 continental ancestry and had a high meat yield and low bone yield compared with the wide range of genotypes in this study.
In addition to R 2 values, both a value for accuracy and RMSE were also used to measure the precision with which carcass conformation and fat scores predicted carcass composition. The high accuracy (0.75 to 0.79) and low RMSE (ranging from 1.1% to 2.2% for meat yield) values obtained using equations developed from carcass conformation and fat scores, indicate that carcass classification scores could be used as an acceptable predictor of carcass composition. Perry et al. (Reference Perry, McKiernan and Yeates1993a) also reported low RMSE of 1.77% and 1.76% for carcass meat and fat, respectively. Using hot carcass weight, fat class and conformation score, Kempster and Harrington (Reference Kempster and Harrington1980) obtained an RMSE of 1.68% for saleable meat percentage in the carcass. Allen and Finnerty (Reference Allen and Finnerty2001) found that carcass conformation was the single best predictor of saleable meat yield (RMSE = 1.23%), with fat score and carcass weight adding little to precision, which is probably due to the fact that not all fat was trimmed from the carcass in that study. Purchas et al. (Reference Purchas, Garrick and Lopez-Villalobos1999) in their review of six studies found that the typical RMSE encountered when predicting beef carcass saleable meat percentage generally fell within the range of 1.4% and 2.7%. Given the fact that carcass classification scores are already recorded for carcasses throughout the EU and that it is a non-invasive method of estimating carcass composition, this makes it practical for abattoirs to implement at little additional cost. Also, the fact that predicted values were unbiased relative to actual values in this study, agrees with Purchas et al. (Reference Purchas, Garrick and Lopez-Villalobos1999) who suggested that unbiased prediction equations are needed if equations based on meat yield are to be used by the industry. In this study, the interquartile range was lower for the prediction of carcass fat proportion and lower still for the prediction of carcass bone proportion than for carcass meat proportion. This is not unexpected as the quartiles Q1 and Q3 are not dimensionless, and carcass meat proportion values are appreciably higher than fat and bone; thus, it may be noted that on a proportionate basis, the interquartile range is lowest for meat.
Hindquarter prediction equations
Hindquarter composition was used in prediction equations as it is more easily and accurately dissected than the forequarter and is the most valuable part of the carcass. Hindquarter dissection, apart from requiring less time to dissect, is associated with less experimental error (Johnson and Charles, Reference Johnson and Charles1981; Fan et al., Reference Fan, Wilton, Usborne and McMillan1992). The accurate prediction of carcass composition from hindquarter also probably results from the fact that it represents a high proportion of the side (Johnson and Charles, Reference Johnson and Charles1981).
In this study, the regression coefficients (0.89 to 1.17) obtained from the prediction equations when hindquarter meat, fat and bone were used to predict the corresponding tissues in the carcass were similar (0.94 to 1.10) to those obtained by Johnson and Charles (Reference Johnson and Charles1981) using Angus, Friesian and Hereford steer carcasses. The proportion of total variation in carcass composition explained by hindquarter composition in this study (0.87 to 0.93) was greater than that obtained by Zgur et al. (Reference Zgur, Petric and Cepon2006) who reported R 2 values of 0.78, 0.80 and 0.59 when predicting carcass meat, fat and bone proportions, respectively, from a leg cut (similar to hindquarter in this study). Fan et al. (Reference Fan, Wilton, Usborne and McMillan1992) also reported that the proportion of lean in individual cuts (i.e., hip, loin, flank, rib, chuck, brisket and plate) were found to be a strong predictor (R 2 = 0.47 to 0.78) of the proportion of lean in the carcass. The RMSE from predicting carcass composition from hindquarter composition ranged from 6.7 to 12.6 g/kg, which is similar to values (RMSE = 2.1 to 11.3 g/kg) obtained by Zgur et al. (Reference Zgur, Petric and Cepon2006). The lack, in general, of any bias in estimating carcass composition agrees with the findings of Kempster and Jones (Reference Kempster and Jones1977) who predicted carcass lean percentage from the percentage lean in the various cuts. However, Zgur et al. (Reference Zgur, Petric and Cepon2006) concluded that carcass muscle percentage was underestimated in very lean carcasses and overestimated in fat carcasses, and vice versa, for fat percentage, whereas the accuracy of bone prediction was not affected by fat percentage in the carcass. The lack of a correlation between the residuals and predicted values indicate that this was not the case in this study.
Genotype effects on prediction bias
In this study, bias of prediction of carcass composition was evident in some genotypes. These findings agree with Kempster and Cuthbertson (Reference Kempster and Cuthbertson1977) who reported that breed group differences existed in both carcass conformation and composition at constant subcutaneous fat levels. However, Johnson and Charles (Reference Johnson and Charles1981) reported no breed differences in the prediction of carcass components from hindquarter meat, fat and bone. Kempster et al. (Reference Kempster, Chadwick and Charles1986) using both visual assessment and measurements of fat, examined the robustness of prediction equations by applying them to independent sets of data (a total of 334 carcasses) from four trials involving steers, heifers, cows and young bulls and found that equations were stable for cattle of the same breed, gender and similar level of fatness, but important biases were obtained between more extreme types of cattle. In contrast, Crouse et al. (Reference Crouse, Dikeman, Koch and Murphey1975) examining various prediction equations from different studies using USDA grading concluded that the use of a single prediction equation for all genotype groups would rank animals well within a breed group but on average would under- or overestimate animals of a breed group by up to 1% relative to its actual carcass cutability.
In this study, some biases may have been obtained possibly due to the smaller number of animals dissected in the respective category. It may also be considered that genotype 2, which was biased with carcass meat fat and bone may be a result of early-maturing genotypes having a higher percentage of separable fat than other genotypes (Barton et al., Reference Barton, Rehak, Teslik, Bures and Zahradkova2006).
Conclusion
These results show that equations developed using carcass conformation and fat scores were accurate predictors (i.e., high R 2 and low RMSE) of carcass meat, fat and bone proportions and are applicable across gender and genotype. These equations could have a useful role in rewarding farmers for producing animals with better carcass traits by implementing a payment system based on predicted meat yield. As carcass classification in Ireland is carried out using VIA machines, the implementation of a payment system based on carcass composition would be quick and practical with little or no additional expense to the abattoir.
Equations developed using hindquarter composition were also shown to accurately predict carcass meat, fat and bone proportions. These equations would reduce the huge cost associated with whole carcass dissection and make it more beneficial and appealing to those carrying out carcass studies.
Acknowledgements
The authors gratefully acknowledge the secretarial assistance of Ms A. Gilsenan, S. Caffrey and M. Weldon. Thanks are also due to Mr J. Marron for valuable technical assistance, the Farm staff at Teagasc Grange and to those who participated in the carcass dissections.