Introduction
Carbon dioxide (CO2) is the principal greenhouse gas (GHG) contributing positively to global warming potential (Reilly et al., Reference Reilly, Jacoby and Prinn2003). CO2 emissions from soils have long been identified as the largest natural source of carbon to the atmosphere in most undisturbed and unmanaged terrestrial systems (Diaz-Diaz and Loague, Reference Diaz-Diaz and Loague2001) and as the most significant component of terrestrial ecosystem respiration (Duxbury, Reference Duxbury1994; Doherty, Reference Doherty2010). The soil CO2 emission to the atmosphere is a primary mechanism of carbon (C) loss from soils (Lamers et al., Reference Lamers, Ingwersen and Streck2007). The emissions come mainly from the decomposition of soil organic matter (SOM) (GGWG, 2010). The main processes of SOM decomposition are biological oxidation by microbes and roots, resulting in soil respiration (Andrews et al., Reference Andrews, Harrison, Matamala and Schlesinger1999; Lamers et al., Reference Lamers, Ingwersen and Streck2007; Hernandez-Ramirez et al., Reference Hernandez-Ramirez, Brouder, Smith and Scoyoc2009). Soil respiration is primarily a combination of two sources: soil autotrophic respiration (mainly from plant roots) and soil heterotrophic respiration (majorly from soil microbes) (Lai et al., Reference Lai, Kumar, Folle and Owens2017; Zheng et al., Reference Zheng, Wang, Yu, Jia and Zhang2021). The soil CO2 emission flux (R s) is controlled by several factors, including soil temperature (T s), soil moisture (θ) (they strongly depend on air temperature and precipitation), quantity and quality of SOM, soil pore-size distribution, wind speed (Latshaw and Miller, Reference Latshaw and Miller1924; Linn and Doran, Reference Linn and Doran1984; Raich and Schlesinger, Reference Raich and Schlesinger1992; Lee et al., Reference Lee, Doolittle and Owens2007, Reference Lee, Pedroso, Linquist, Putnam, Kessel and Six2012), tillage and residue management (Lewandowski et al., Reference Lewandowski, Scurlock, Lindvall and Christou2003; Glenn et al., Reference Glenn, Tenuta, Amiro, Maas and Wagner-Riddle2012). The R s between atmosphere and soil is an essential pathway in the C cycle. The processes that mediate these fluxes can increase the atmospheric concentration of CO2 (Glenn et al., Reference Glenn, Tenuta, Amiro, Maas and Wagner-Riddle2012), causing an increase in global mean surface temperatures (Hofmann et al., Reference Hofmann, Mathesius, Kriegler, van Vuuren and Schellnhuber2019).
Corn (Zea mays L.) is one of the three major crops [wheat (Triticum aestivum L.), corn and rice (Oryza glaberrima L. or Oryza sativa L.)] in the world. The corn area is 13.69% of the total global cropland area, and the United States of America (USA) is the largest corn producer in the world, with 33 270 820 ha of land reserved for corn production (FAO, 2020). The global and USA corn acreages have been increasing since 1961 (FAO, 2020) due to the corn multi-usage such as food, forage and bioenergy feedstock (Li et al., Reference Li, Miao and Khanna2019). Soil management practice is one of the significant factors affecting the soil–atmosphere exchange of GHG (Watson et al., Reference Watson, Zinyowera and Moss1996). Therefore, the CO2 emissions from soils in the global cornfields play an essential role in global warming.
Previous studies have reported different treatment effects on soil CO2 emissions from cornfields, such as the tillage effects on CO2 emissions (Jackson et al., Reference Jackson, Carpenter, Dahm, McKnight, Naiman, Postel and Running2001; Johnson and Curtis, Reference Johnson and Curtis2001; Glenn et al., Reference Glenn, Tenuta, Amiro, Maas and Wagner-Riddle2012), the impact of drainage water management on soil CO2 fluxes (Johnson et al., Reference Johnson, Hungate, Dijkstra, Hymus and Drake2001), the effect of in-field management of corn cob and residue mix on soil CO2 emissions (Hsu et al., Reference Hsu, Nelson and Matches1985) and CO2 emissions under different fertilizer treatments (Kanerva et al., Reference Kanerva, Regina, Rämö, Ojanperä and Manninen2007). Several studies have reported the temporal variability of R s at diurnal (Kiniry et al., Reference Kiniry, Tischler and Van Esbroeck1999; Gaumont-Guay et al., Reference Gaumont-Guay, Black, Griffis, Barr, Jassal and Nesic2006; Riveros-Iregui et al., Reference Riveros-Iregui, Emanuel, Muth, McGlynn, Epstein, Welsch, Pacific and Wraith2007; Kirkham, Reference Kirkham2011; Wang et al., Reference Wang, Zha, Jia, Wu, Zhang and Qin2014) and seasonal time scales (Kiniry et al., Reference Kiniry, Tischler and Van Esbroeck1999; Kutsch et al., Reference Kutsch, Bahn and A2009; Liu et al., Reference Liu, Zhang and Wan2009; Kuzyakov and Gavrichkova, Reference Kuzyakov and Gavrichkova2010; Martin et al., Reference Martin, Phillips, Schmidt, Irvine and Law2012; Wang et al., Reference Wang, Zha, Jia, Wu, Zhang and Qin2014). However, in the north-central region of the USA, little is known about the daily, seasonal and annual variabilities of R s from cornfields.
The correlations between R s and T s or θ are different depending on various local conditions such as temperature and precipitation. The strong relationship between R s and Ts was reported by several previous studies (Borken et al., Reference Borken, Savage, Davidson and Trumbore2006; Arevalo et al., Reference Arevalo, Bhatti, Chang, Jassal and Sidders2010). CO2 fluxes increase with an increase in temperature, which stimulates microbial activity (Winkler et al., Reference Winkler, Cherry and Schlesinger1996) and enhances root respiration (Rochette and Flanagan, Reference Rochette and Flanagan1997; Arevalo et al., Reference Arevalo, Bhatti, Chang, Jassal and Sidders2010). It is impossible to measure the accurate Ts response of R s and the confounding effects of Ts with other factors on R s (Subke and Bahn, Reference Subke and Bahn2010). The impacts of θ on R s are distinct only when the soil is too dry or too wet (Davidson et al., Reference Davidson, Belk and Boone1998). It is recognized that θ and R s might have an indirect relationship due to a hysteresis effect in the θ changes on R s changes (Pacaldo, Reference Pacaldo2012). Therefore, continuous automated measurements can be beneficial in understanding the relationships between R s and Ts or θ over time.
The continuous automated soil CO2 measurement can generate high-frequency temporal data of CO2 fluxes from the soil. The measured high-frequency R s is one of the most valuable incomings to calibrate and validate a model that simulates major ecosystem processes. In this study, the DAYCENT model (Parton et al., Reference Parton, Schimel, C.V. and Ojima1987) was calibrated using the high-frequency R s data for simulating and predicting R s from a cornfield. This prediction is vital to make policies or decisions for mitigating GHG emissions. Therefore, the objectives of this study were to (i) explore the temporal variabilities of R ss at seasonal and diurnal time scales from a cornfield located in South Dakota and analyse the relationships among R s, Ts and θ, (ii) calibrate and validate DAYCENT model, (iii) predict future impacts of climate change scenarios on R s and corn yield using the built model and (iv) forecast the long-term R s from cornfield using the built model and the projected climate data by the climate models.
Materials and methods
Data measurements
The study site is near Lennox, South Dakota, USA (43°14′27.0″ N, 96°54′09.0″ W; altitude: 384 m above sea level). Before 1977, the site was an uncultivated field with wild grasses. From 1977 to 2001, the soybean, corn, spring wheat with unregular crop rotations were planted at the site. In 2002–2015, the corn was continuously planted every year at the site, at which the cornfield was not ploughed (i.e. no-tillage; but it was harrowed using the disc harrows before planting) and applied nitrogen (N) fertilization twice with an N rate of 6.7 (10 days after planting) and 5.6 g N/m2 (30–35 days after planting) for each growing season. The R s from the cornfield were measured using a high frequent measurement method with the Automated Soil CO2 Flux System, which was LI-8100 instrumentation (LI-COR Biosciences Inc., Lincoln, NE, USA). T s and θ at the 8-cm depth were also measured using the same LI-8100 equipment (the soil moisture sensors from the LI1800 were previously calibrated). The Automated Soil CO2 Flux System connected the four gas chambers and sensors to measure R s, T s and θ. Two gas chambers and sensors were installed between the cornrows, and the other two were within the rows and were always in the same spot from 2008 to 2011. The four chambers and sensors were located within a 4-meter distance. The hourly R s, T s and θ were continually measured in the growing seasons of corn in 2008 and 2009. The 2-h R s, T s and θ were continually measured in the 2011 corn growing season. In 2010, most measured values were incorrect because the flooding submerged the four chambers in the field. The formula for the calculation of soil CO2 flux:

where R s is the soil CO2 flux (μmol/m2/s), V is volume (cm3), P0 is the initial pressure (kPa), W 0 is the initial water vapour mole fraction (mmol/mol), R is Gas Constant (8.314 Pa m3/K/mol), S is soil surface area (cm2), T 0 is the initial air temperature (°C) and ∂C'/∂t is the initial rate of change in water-corrected CO2 mole fraction (μmol/mol) from time 0 to t. C'(t) v. t data were obtained from a soil CO2 flux measurement. The data are marked to show when the chamber closed and opened. The details of C'(t) v. t calculation were described in the Using the LI-8100A Soil Gas Flux System and the LI-8150 Multiplexer (LI-8100A manual: https://licor.app.boxenterprise.net/s/jtpq4vg358reu4c8r4id).
The means of R s, T s and θ measured from the four chambers (i.e. averages of four values were calculated from the four chambers simultaneously) were used to analyse this study. The daily mean R s (R sd), T s (T sd) and θ (θd) were used to conduct the analyses at the seasonal time scale. The R sd, T sd and θd were calculated by averaging the values of R sh, T sh and θh during each observed day. The hourly or 2-h R s (R sh), T s (T sh) and θ (θh) were used for analysis at the diurnal time scale. Yearly (annual) R s (R sy) was used for showing the modelling results (i.e. predicted results using models).
The daily maximum and minimum air temperature and precipitation data from 1906 to 2013 were retrieved from the nearest Weather Station (14 km) in Centerville, South Dakota. The daily mean air temperature was calculated from the daily maximum and minimum air temperature. The daily mean air temperature in 2008, 2009, 2010 and 2011 were 6.58, 7.16, 8.23 and 8.22°C, respectively. The annual precipitation in 2008, 2009, 2010 and 2011 were 768, 693, 901 and 562 mm, respectively. The means of air temperature and annual precipitation over the past 30 years (1984–2013) were 8.22°C and 653 mm. 2011 was a drought year because the precipitation (562 mm) was lower than the long-term annual mean precipitation of 653 mm and the other three observed years. Corn yield was measured from 2008 to 2011. The data for soil bulk density (1.37 Mg/m3), pH (6.7) and particle size distribution (22.5% clay, 37.7% silt and 39.8% sand) were obtained from the USDA-NCSS soil survey (http://casoilresource.lawr.ucdavis.edu/gmap/). The field capacity and wilting point were automatically estimated by DAYCENT model software, in which the field capacity was water content at the option of −0.33 bar for the loam soil, and the wilting point was assumed to be water content at −15 bars (Gupta and Larson, Reference Gupta and Larson1979; Rawls et al., Reference Rawls, Brakensiek and Saxtonn1982).
Soil CO2 flux prediction
DAYCENT model (Stand-alone Version 08/17/2014) was used to simulate and predict R s in this study. The DAYCENT is the daily version of the CENTURY ecosystem model (Parton et al., Reference Parton, Schimel, C.V. and Ojima1987), a fully resolved ecosystem model that simulates all major ecosystem processes, such as changes in SOM, plant productivity, nutrient cycling, CO2 respiration, soil water and soil temperature at the daily scale (Del Grosso et al., Reference Del Grosso, Parton, Mosier, Hartman, Brenner, Ojima, D, Shaffer, Ma and Hansen2001). The model inputs included daily precipitation, maximum and minimum daily temperature, soil texture, pH, field capacity, wilting point, historical land use and field and crop management information. The historical land-uses were a series of temperate tall grass and clover grass from year 1 through 1977, soybean (Glycine max L.), corn and wheat rotation from 1978 to 2001, and corn from 2002 to 2013. These inputs were used to construct the local DAYCENT model.
However, the performance of this model strongly depends on how well it is calibrated and validated for the specific environmental conditions being evaluated (Smith et al., Reference Smith, Smith, Powlson, McGill, Arah, Chertov, Coleman, Franko, Frolking and Jenkinson1997; De Gryze et al., Reference De Gryze, Wolf, Kaffka, Mitchell, Rolston, Temple, Lee and Six2010). The model was calibrated using the Combined Parameter estimation (Doherty, Reference Doherty2010) and Trial-Error (CPTE) methodology, which was described in our previous publications (Mbonimpa et al., Reference Mbonimpa, Gautam, Lai, Kumar, Bonta, Wang and Rafique2015; Lai et al., Reference Lai, Kumar, Chintala, Owens, Clay, Schumacher, Nizami, Lee and Rafique2016). First, this study used the ‘trial and error’ method to calibrate the DAYCENT model. Then, the model was calibrated manually by adjusting values of the critical parameters until the adjusted parameters improved the simulations of CO2 fluxes. However, we could not obtain the best DAYCENT model through manual calibration. Therefore, the PEST model was used to calibrate the manually calibrated DAYCENT model further. First, the 42 most sensitive parameters (Table S1) were selected by running PEST with DAYCENT model from 87 parameters can be adjusted in a total of 599 parameters for simulating crops in the DAYCENT model (Lai et al., Reference Lai, Kumar, Chintala, Owens, Clay, Schumacher, Nizami, Lee and Rafique2016). Then, the PEST with DAYCENT models were run for calibration using the 42 most sensitive parameters and the measured CO2 flux data from the corn growing seasons in 2008 and 2009. The calibrated modelled CO2 fluxes were extracted from the outputs of the PEST calibrated model, and then the modelled v. measured CO2 fluxes (R sd) were compared. For model evaluation, we used the measured CO2 flux data from the corn growing seasons in 2011 to validate the DAYCENT model (all the measurements in 2010 were not correct due to flooding). Also, the data of corn yield, Ts and θ were used to validate the model. Based on the DAYCENT model developer, the net primary productivity (NPP) is the most critical parameter for the model validation (if the NPP for the site is incorrect, then none of the other model outputs can be expected to be representative of the conditions at the site). The corn yield can check the NPP for the study site (Parton et al., Reference Parton, Hartman, Ojima and Schimel1998). Therefore, the corn yield is necessary to validate the calibrated DAYCENT model. The model was validated by comparing the calibrated DAYCENT modelled outputs (i.e. CO2 flux, corn yield, Ts and θ) to the measured data.
Then, the calibrated and validated DAYCENT model was used to simulate R s for the long-term (we selected 2014 to 2049) using climate change (i.e. temperature and precipitation changes) scenarios. The temperature scenarios were created based on the incremental scenarios development (McCarthy, Reference McCarthy2001). Temperature scenario I (ST1, baseline temperature) in the next 36 years is the past 36-years (from 1978 to 2013) temperature. The climate data over the past 100 years showed no increasing trend in temperature (Fig. S1). Therefore, we developed scenarios II, III and IV (ST2, ST3 and ST4) by increasing the temperature by 0.5, 1.0 and 1.5°C for the next 36 years (from 2014 to 2049), respectively, and keeping the precipitation constant. The five scenarios of precipitation changes (SP1-SP5) from 2014 to 2049 were created based on the changes in precipitation from SP1 to SP5 corresponding to −30, −15, 0, +15 and +30% of the precipitation measured from 1978 to 2013 (SP3 is the precipitation in 1978–2013, i.e. baseline precipitation). The precipitation frequencies for future climate scenarios were kept the same as that of 1978 to 2013. The range was based on that reported by IPCC's projected precipitation to be approximately between −30 to 30% across the globe by 2090 relative to 1990 (IPCC, Reference Solomon, Qin, Manning, Chen, Marquis, Averyt, Tignor and Miller2007), and the temperature was kept the same to the increasing trend from 1978 to 2013 (Lai et al., Reference Lai, Kumar, Chintala, Owens, Clay, Schumacher, Nizami, Lee and Rafique2016).
The calibrated and validated DAYCENT model was also used for predicting R s in the next 36 years based on the projected climate data using a nine-member high-resolution regional climate model ensemble. This was generated using the International Centre for Theoretical Physics Regional Climate Model Version 4 (RegCM4, https://www.int-res.com/articles/cr_oa/c052p001.pdf), driven by the 6-hourly initial and boundary forcing from Global Climate Models (GCM) that were part of the 5th phase of the Coupled Model Intercomparison Project (CMIP5). Each RegCM4 integration covered 1965–2005 using the historical simulations and 2010–2050 using the Representative Concentration Pathway 8.5 (RCP 8.5) (Ashfaq et al., Reference Ashfaq, Rastogi, Mei, Kao, Gangrade, Naz and Touma2016). The nine downscaled CMIP5 GCMs include the Beijing Climate Center Climate model (BCC-CSM), Community Climate System Model (CCSM4), Centro Euro-Mediterraneo sui Cambiamenti Climatici Climate Model (CMCC-CM) (Scoccimarro et al., Reference Scoccimarro, Gualdi, Bellucci, Sanna, Giuseppe Fogli, Manzini, Vichi, Oddo and Navarra2011), Flexible Global Ocean-Atmosphere-Land System model (FGOALS) (Oleson et al., Reference Oleson, Dai, Bonan, Bosilovich, Dickinson, Dirmeyer, Hoffman, Houser, Levis and Niu2004), Institute Pierre Simon Laplace Climate Model 5 running on a low-resolution grid (IPSL-CM5A-LR), Model for Interdisciplinary Research on Climate 5 (MIROC5), Max-Planck-Institute Earth System Model running on medium resolution grid (MPI-ESM-MR), Meteorological Research Institute Coupled ocean-atmosphere General Circulation Model (MRI-CGCM3) (Yukimoto et al., Reference Yukimoto, Adachi and Hosaka2012), and the Norwegian Earth System Model (NorESM1-M) (Bentsen et al., Reference Bentsen, Bethke, Debernard, Iversen, Kirkevåg, Seland, Drange, Roelandt, Seierstad and Hoose2013). RegCM4 simulations were conducted at 18 km horizontal grid spacing with 18-levels in the vertical over a domain covering the continental United States and parts of Canada and Mexico (Ashfaq et al., Reference Ashfaq, Rastogi, Mei, Kao, Gangrade, Naz and Touma2016). The output from the RegCM4 simulations was further bias-corrected to 4 km using the methodology detailed in Ashfaq et al. (Reference Ashfaq, Ghosh, Kao, Bowling, Mote, Touma, Rauscher and Diffenbaugh2013). Finally, the bias-corrected data was used to extract the simulated temperature for the 10 points representing the study site.
Statistical analysis
The trend analysis for the measured data was conducted by using the Mann–Kendall test (the null hypothesis states that there is no monotonic trend) (Mann, Reference Mann1945; Kendall, Reference Kendall1975; Gilbert, Reference Gilbert1987) with slopes estimated by the Sen estimator (Sen, Reference Sen1968) using the package ‘mblm’ in R (Komsta, Reference Komsta2013; R Core Team, 2020). The data autocorrelation coefficients were calculated, and Autocorrelation Function (ACF) plots were drawn using the R language (R Core Team, 2020). The line plots, scatter plots with trend lines and their functions, and tables were made using Microsoft Excel 2019. Parallel-line analysis was used for comparing the simulated R ss under different climate scenarios using SAS 9.4 (SAS, 2013). The parallel-line analysis is a statistical method for comparing two datasets that are time-correlated or paired values that are not independent. It can determine whether linear regression slopes and intercepts of the two datasets are significantly different. If the slopes are not significantly different (i.e. the two-line slopes are parallel), it can test whether the line intercepts are significantly different. If the slopes are significantly different, there is no sense in testing line intercepts (Solusions4u, 2021). The distributions of the datasets were tested for normality using the Kolmogorov-Smirnov method using SAS 9.4 (SAS, 2013) when exploring the datasets. Data were transformed when necessary for building a regression model. The transformation was determined using the Box-Cox method (Box and Cox, Reference Box and Cox1964, Reference Box and Cox1982) using SAS 9.4 (SAS, 2013). Pearson correlation coefficient (r) was calculated using SAS 9.4 (SAS, 2013). Significance was determined at α = 0.05 level for all statistical analyses.
Performance of the calibrated and validated DAYCENT model was evaluated with four widely used quantitative criteria (Moriasi et al., Reference Moriasi, Arnold, Van Liew, Bingner, Harmel and Veith2007; Dai et al., Reference Dai, Birdsey, Johnson, Dupuy, Hernandez-Stefanoni and Richardson2014) that include the determination coefficient (R 2, squared correlation coefficient), per cent bias (PBIAS) (Gupta et al., Reference Gupta, Sorooshian and Yapo1999), model performance efficiency (ME/NSE) (Nash and Sutcliffe, Reference Nash and Sutcliffe1970) and the root mean squared error (the RMSE) and RSR (the ratio of RMSE to SD (standard deviation of measured data)) (Singh et al., Reference Singh, Knapp and Demissie2004). The acceptable range of the four evaluation criteria R 2, PBIAS, ME/NSE and RSR are 0.5 to 1, −25 to 25%, 0.5 to 1 and 0 to 0.7, respectively (Table S2).
Results
Soil hourly CO2 fluxes and corn yield
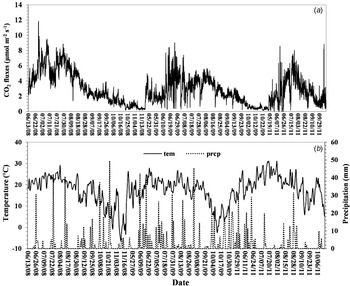
Soil hourly (2008 and 2009) and 2-h (2011) CO2 fluxes (n = 38 416) are the original measured data, presented in Fig. 1 and Fig. S2. Data showed that, in general, the hourly and 2-h R s displayed a seasonal trend with the temperature change, such as higher R s from mid-June to mid-August and lower R s in other periods for each year (Fig. 1). The maximum and minimum values of the hourly and 2-h R s were 11.8575 and −0.1225 μmol/m2/s (there was a total of 2 negative values). The median, mean and standard deviation of hourly and 2-h R s were 2.4120, 2.8250 and 1.9355 μmol/m2/s, respectively. The values of hourly and 2-h R s did not follow a normal distribution. The hourly and 2-h R s values between 0 and 3 μmol/m2/s had a higher frequency, and the values greater than 8 μmol/m2/s had a smaller frequency (Fig. S2). Several hourly and 2-h R s values increased or decreased suddenly, and a few values were extraordinarily high and low (Fig. 1(a)).
(a) Soil hourly (2008 and 2009) and 2-hour (2011) CO2 fluxes (μmol/m2/s) and (b) daily air temperature (tem) and precipitation (prcp) data corresponding to the measured days in 2008, 2009 and 2011 from the cornfield at the South Dakota site.

The corn yield at this study site was 10 432, 11 700, 9949 and 9591 kg/ha in 2008, 2009, 2010 and 2011, respectively.
Seasonal soil daily CO2 fluxes and soil temperature and moisture
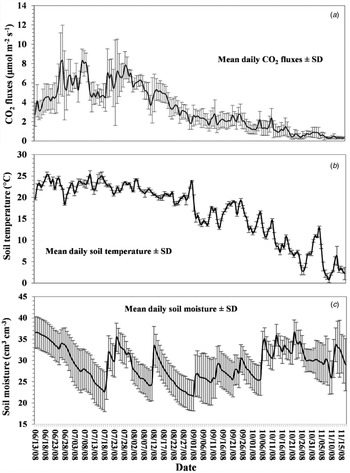
The daily CO2 fluxes (R sd) and daily soil temperature (T sd) and moisture (θ d) at the seasonal time scale are presented in Figs 2 to 4, Figs. S3 to S10 and Table 1. In 2008, the median, mean and standard deviation of R sd were 2.7, 3.3 and 2.3 μmol/m2/s, respectively. The maximum and minimum values of R sd were 8.3 and 0.30 μmol/m2/s, respectively. R sd had an increasing trend from 13 June to 30 July 2008, and a decreasing trend from 30 July to 18 November 2008, with fluctuations (Fig. 2(a)). T sd followed a decreasing trend in the 2008 growing season (Fig. 2(b)). However, θ d showed a flat pattern throughout the growing season with large fluctuations (Fig. 2(c)). Further, the trend tests showed that, overall, R sd and T sd followed a significantly reducing trend over time (P value < 0.0001 with negative slopes). In contrast, θ d did not follow a significant trend (P value = 0.71). The first-order and second-order autocorrelation coefficients (r 1 and r 2) for R sd, T sd and θ d were greater than 0.65, which indicated that these three variables had time-series autocorrelation. Further, the r 1 and r 2 for R sd and T sd were greater than that for θ d (Table 1). The ACF plots further displayed that the R sd, T sd and θ d exhibited autocorrelation with their 14, 14 and 6 lags (days), respectively (Fig. S5). There was an exponential relationship with high R 2 between R sd and T sd in the corn production field for the growing season in 2008: R sd = 0.2826e 0.1282Tsd (R 2 = 0.90) (Fig. 3(a)). However, corresponding to different θ d, the exponential relationships were different. The three ranges of soil moisture were decided by splitting the θ d dataset in 2008 into three groups with the same amount of data, namely, 22–26%, 27–31% and 32–37%. During the range of 32–37% of θ d, there was a strong exponential relationship with high R 2 (0.9) between R sd and T sd, and the exponential relationship was very strong (R 2 = 0.95) for the 27–31% of θ d. However, for the low θ d condition (soil moisture of 22–26%), the exponential relationship was weak (close linear relationship) (Fig. S8). There was a fairly weak relationship between R sd and θ d in 2008 (Fig. 4). However, the relationship between CO2 and the product of Ts and θ (Ts × θ), which is called the soil environment index (SEI), was strong. The outputs of the linear regression model (R sd0.5 = b + a × SEI + ɛ, R sd0.5 is 0.5 power of R sd) in 2008 showed that a (coefficient of SEI in the model) was positive and P value < 0.0001 (Table 2), indicating that the SEI had a significant positive impact on the R sd in the cornfield. R 2 was 0.77 (Table 2), indicating the 77% of the variance in the R sd0.5 that the SEI could explain.
(a) Means of daily soil CO2 flux (R sd) ± s.d. (standard deviation of values of four chambers), (b) means of daily soil temperature (T sd) ± s.d. (standard deviation of values of four chambers) and (c) means of daily soil moisture (θ d) ± s.d. (standard deviation of values of four chambers) from the cornfield at the South Dakota site in 2008.

The exponential relationship between daily soil CO2 fluxes (R sd) and daily soil temperature (T sd) measured in the cornfield at the South Dakota site in (a) 2008, (b) 2009 and (c) 2011. y = daily soil CO2 flux (R sd); × = daily soil temperature (T sd); R 2 = determination coefficient.

Relationships between daily soil CO2 fluxes (R sd) and daily soil moisture (θ sd) measured in the cornfield at the South Dakota site in (a) 2008, (b) 2009 and (c) 2011. y = daily soil CO2 flux (R sd); x = daily soil moisture (θ sd); R 2 = determination coefficient.

The P values of Mann–Kendall test for analysing the trend over time (days), slopes using Sen Estimator and first-order and second-order autocorrelation coefficients (r 1 and r 2)

a R sd is the daily soil CO2 fluxes (μmol/m2/s); T sd is the daily mean soil temperature (°C); θ d is the daily mean soil moisture (%, cm3/cm3).
Outputs of linear regression model (CO20.5 = b + a × SEI + ɛ) in 2008, 2009, 2011 and the 3 years

SEI, soil temperature (T s) × soil moisture (θ); ɛ, model residues
a R 2, determination coefficient; a, coefficient of SEI in the model. b, intercept in the model.
In 2009, the median, mean and standard deviation of R sd were 2.3, 2.4 and 1.4 μmol/m2/s, respectively, and the maximum and minimum values of R sd were 5.1039 and 0.1580 μmol/m2/s, respectively. R sd followed a decreasing trend from 17 May to 7 June and 26 June to 30 October 2009, and an increasing trend from 7 June to 26 June 2009, with fluctuations (Fig. S3(a)). T sd followed a decreasing trend in 2009, and θ d did not show an obvious trend (Fig. S3(b) and (c)). Further, the trend analysis showed that R sd and T sd followed an overall decreasing trend over time (P value < 0.0001 with negative slopes). In contrast, θ d did not follow a significant trend (P value = 0.42) (Table 1). The first-order and second-order autocorrelation coefficients (r 1 and r 2) for R sd, T sd and θ d were >0.45, which indicated that these three variables had time-series autocorrelation. Further, r 1 and r 2 values for R sd and T sd were greater than those for θ d (Table 1). The ACF plots further showed that R sd, T sd and θ d had autocorrelation with 12, 12 and 3 lags (days), respectively (Fig. S6). There was an exponential relationship between R sd and T sd for the corn growing season in 2009: R sd = 0.1586e 0.1452Tsd (R 2 = 0.86) (Fig. 3(b)). During the range of 32–37% of θ d, there was a strong exponential relationship with high R 2 (0.90) between R sd and T sd, and for the 27–31% of θ d, the exponential relationship was still strong (R 2 = 0.82) (Fig. S9). However, there were only five values of R sd under the low θ d condition (22–26%), which were too small to reveal a correct relationship. There was a fairly weak relationship between R sd and θ d in 2009 (Fig. 4). The linear regression model (R sd0.5 = b + a × SEI + ɛ) in 2009 showed that the a was positive and P value < 0.0001 (Table 2), indicating that the SEI had a significant positive impact on the R sd in the cornfield. R 2 was 0.72 (Table 2), indicating the 72% of the variance in the R sd0.5 that the SEI could explain.
In 2011, the median, mean and standard deviation values of R sd were 2.4, 2.6 and 1.4 μmol/m2/s, respectively, with the maximum and minimum values of 6.6 and 0.18 μmol/m2/s, respectively (Fig. S4(a)). R sd had an increasing trend from 17 May to 18 July, 2011, and a decreased trend from 18 July to 16 October 2011 (Fig. S4(a)). T sd showed the same trend in R s (Fig. S4(b)). θ d followed a decreasing trend (Fig. S4(c)). Further, the trend tests showed that R sd, T sd and θ d followed a significantly decreased trend over the observed days (P value = 0.024, <0.0001 and <0.0001 with negative slopes, respectively). The first-order and second-order autocorrelation coefficients (r 1 and r 2) of R sd, T sd and θ d were greater than 0.78, which indicated the three variables had time-series autocorrelation. The r 1 and r 2 of T sd and θ d were greater than that of R sd (Table 1). The ACF plots further showed that, overall, R sd, T sd and θ d had autocorrelation with their 10, 12 and 12 lags (days), respectively (Fig. S7). There was an exponential relationship between R sd and T sd in 2011: R sd = 0.3098e 0.1028Tsd (R 2 = 0.53) (Fig. 3(c)). Specifically, for the high θ d (38–41%), there was no obvious relationship between R sd and T sd. For the ranges of 32–37%, 27–31% and 22–26% of θ d, there were exponential relationships between R sd and T sd with 0.43, 0.74 and 0.57 of R 2, respectively (Fig. S10). There were strong relationships (a curve) between R sd and θ d in 2011, in which the R sd was highest when the soil moisture was 30.80%. When the θ d < 30.80%, the R sd increased as the θ d increased. When the θ d > 30.80%, the R sd reduced as the θ d increased (Fig. 4). The linear regression model (R sd0.5 = b + a × SEI + ɛ) in 2011 showed that the a was positive and P value < 0.0001 (Table 2), indicating that the SEI had a significant positive impact on the R sd in the cornfield. R 2 was 0.28 (Table 2), indicating the 28% of the variance in the R sd0.5 that the SEI could explain.
Diurnal soil CO2 fluxes and soil temperature and moisture
R sh, T sh and θ h at the diurnal time scale are presented in Figs 5 and 6 and Figs. S11 to S13. In 2008, R sh, T sh and θ h had a similar pattern. There was a linear relationship between R sh and T sh: R sh = 0.029T sh + 2.8756 (R 2 = 0.52). Also, the linear relation between R sh and θ h was: R sh = 0.3436θ h – 6.6463 (R 2 = 0.48). The relationship between R sh and T sh did not display daily hysteresis (Figs. 5 and S11(d)). The diurnal patterns of R sh, T sh and θ h with standard deviation in 2008 are shown in Fig. S11.
Diurnal pattern of hourly CO2 fluxes (R sh) and (a) hourly soil temperature (T sh) and (b) hourly soil moisture (θ h) from the cornfield at the South Dakota site in 2008.

(a) Diurnal hourly CO2 fluxes R sh v. hourly soil temperature T sh and (b) R sh v. hourly soil moisture θ h in 2009. y = hourly soil CO2 flux (R sh); (A) x = hourly soil temperature (T sh) and (B) x = hourly soil moisture (θ h); R 2 = determination coefficient.

In 2009, R sh, T sh and θ h followed a similar pattern. There was a linear relationship between R sh and T sh: R sh = 0.1719T sh – 0.6452 (R 2 = 0.81). The linear relationship between R sh and θ h was: R sh = 1.0201θ h – 30.442 (R 2 = 0.85) (Fig. 6). The relationship between R sh and T sh displayed a daily hysteresis loop (Fig. 6(a)).
In 2011, R sh and θ h had a similar pattern. However, T sh had different from the pattern of R sh and θ h. There was a linear relationship between R sh and T sh: R sh = 0.0071T sh + 2.5056 with R 2 = 0.0036. The linear relationship between R sh and θ h was: R sh = 1.3289θ h – 37.884 with R 2 = 0.66. The relationship of R sh and T sh displayed a daily hysteresis loop (Fig. S13(d)).
Calibration and validation of DAYCENT model
The calibrated results using the measured R s showed that the values of determination coefficient (R2), PBIAS, modelling efficiency (ME/NSE) and RSR (ratio of RMSE to SD of measured R s) were 0.71, 1.4%, 0.71 and 0.54, respectively, which were within the acceptable ranges of the four evaluation criteria (Table S2). The simulated and measured R s in the calibration period had a similar trend and magnitude with few unaligned peaks (Fig. S14). Based on the validated results, for Ts, the values of R2, PBIAS, ME and RSR were 0.80, 1.10%, 0.71 and 0.54, respectively, which were acceptable. The corresponding values for θ were 0.51, −2.7%, 0.02 and 0.99, respectively, in which the R2 and PBIAS were acceptable but ME and RSR were out of the acceptable ranges. However, the R2 (0.84) and PBIAS (1.10%) values for corn yield were acceptable (Table S2). Therefore, generally, this study's calibrated and validated DAYCENT model was acceptable.
Modelling future impacts of temperature and precipitation changes on annual soil CO2 fluxes, root CO2 fluxes and corn yield
In response to four temperature scenarios, ST1, ST2, ST3 and ST4, the four simulated annual soil CO2 fluxes RT1, RT2, RT3 and RT4 for the next 36 years (2014–2049) are presented in Table 3. For the soil CO2 fluxes, the RT1 (ST1: baseline temperature) and RT4 (ST4: + 1.5°C) were significantly different (P value = 0.018). The RT3 (ST3: + 1.0°C) and RT1 were marginally different (0.05 ≦ P value < 0.10). RT2 v. RT1, RT4 v. RT2, RT3 v. RT2 and RT4 v. RT3 were not significantly different (P value > 0.11). The means of RT1, RT2, RT3 and RT4 had an increasing trend with increasing temperature scenarios (Table 3). For the root CO2 fluxes, the RT1-4 were not significantly different from one another, and the means of RT1-4 increased as the temperature scenarios increased (Table 3). The corn yields in response to four temperature scenarios were not significantly different from one another (Table 3).
Means and P values of comparisons of the predicted annual soil CO2 fluxes, root autotrophic CO2 fluxes (R sy: RT1, RT2, RT3 and RT4) and corn yield in response to four scenarios of temperature (ST1, ST2, ST3 and ST4)

a ST1 is the temperature scenario 1 from 2014 to 2049, which is the past 36-year temperature and precipitation from 1978 to 2013 at this study site. S2, S3 and S4 are temperature scenario 2, 3 and 4, respectively, which are an increase of temperature by 0.5, 1 and 1.5°C in the next 36 years from 2014 to 2049, respectively, and keeping the precipitation constant, which was same as the precipitation from 1978 to 2013.
b P values were from the results using the Parallel-line statistical analysis method for comparing the two datasets over time.
In response to five precipitation scenarios SP1-5 (−30%, −15%, +0, +15%, +30% Precipitation from 1978 to 2013, which is baseline precipitation, i.e. SP3), the five simulated annual soil CO2 fluxes RP1-5 for the next 36 years (2014–2049) are presented in Table 4. For the soil CO2 fluxes, the RP4 and RP2 were marginally significantly different (0.05 ≦P value < 0.10). The RP2 v. RP3, RP4 v. RP3, RP5 v. RP3, RP1 v. RP2 and RP5 v. RP4 were not significantly different. The RP1 v. RP3, P5 v. RP2, RP4 v. RP1 and RP5 v. RP1 were unable to be compared because the line slopes are significantly different based on the parallel line analysis. For the root CO2 fluxes, the RP5 was significantly lower than the RP3. The RP4 v. RP3, RP4 v. RP2 and RP5 v. RP2 were marginally different. Other paired RPs were not significantly different. The means of RP1-5 reduced as the precipitation scenarios increased (Table 4). The corn yield under the SP5 was significantly lower than that for the SP3 and SP2. The corn yield under the SP4 was marginally lower than that for the SP3 and SP2. Other paired yields were not significantly different (Table 4).
Means and comparisons of the predicted annual soil CO2 fluxes, root autotrophic CO2 (R sy: RP1, RP2, RP3, RP4 and RP5) and corn yield in response to five scenarios of precipitation (SP1, SP2, SP3, SP4 and SP5)

a SP1 is the precipitation scenario 1 from 2014 to 2049, which is the past 36-year temperature and precipitation from 1978 to 2013 at this study site. SP2, SP3, SP4, SP5 are precipitation scenarios 2, 3, 4 and 5, respectively, which are 70%, 85%, 100%, 115% and 130% precipitation in the next 36 years from 2014 to 2049, respectively, and keeping the temperature constant, which was expected to increase by the same trend from 1978 to 2013.
b P values were from the results using the Parallel-line statistical analysis method for comparing the two datasets over time. ‘–’ indicates no P value here because the P value of interaction between R sy level and years < 0.05 based on the Parallel-line statistical analysis method; this situation (two lines are not parallel) needs to be future analysed for comparing the CO2 fluxes under different SPs based on different periods from 2014 to 2019.
Predicted future long-term soil CO2 fluxes
Comparisons of all pairs of ten projected soil CO2 fluxes corresponding to ten projected weather data showed that within a total of 45 pairs of the predicted CO2 fluxes, 12 pairs were significantly different (P value < 0.05), and the other 33 pairs were not significantly different (P values > 0.05) (Table S4). The 12 significant different pairs likely implied that the projected weather data corresponding to the 12 pairs had significant differences. However, most pairs of soil CO2 fluxes (73.3%) were not significant. Therefore, generally, the projected weather data were acceptable.
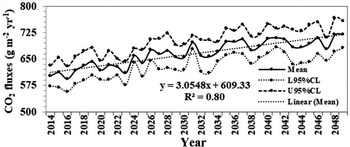
Means and 95% confidence intervals of predicted R sy for the next 36 years are presented in Fig. 7 and Table S3. The means had an increasing trend over the years: R sy = 3.0548 × year + 609.33 (R 2 = 0.80) (Fig. 7). The trend test showed that the slope was 3.1578 with a very small P value (<0.0001). Based on the equation, the predicted mean of R sy in 2014 and 2049 were 612.38 and 719.30 g/m2/year, respectively, which had a difference of 106.92 g/m2/year. The mean of predicted R sy in 2015 was 611.49 g/m2/year, and its 95% confidence interval was [569.33, 653.64] (Table S3). The mean predicted R sy from 2014 to 2049 was 665.85 g/m2/year. The mean 95% confidence intervals of predicted R sy for the means of predicted R sy in the next 36 years were 628.48 to 703.22 g/m2/year.
The means and their 95% confidence interval of forecasting annual soil CO2 fluxes R sy from the cornfield in South Dakota for the next 36 years using the DAYCENT model based on weather data predicted by ten climate models. y = yearly soil CO2 flux (R sy); x = year; R 2 = determination coefficient; L95% CL = lower 95% confidence interval; U95% CL = upper 95% confidence interval.

Discussion
Seasonal variabilities of soil CO2 fluxes influenced by soil temperature and moisture and their interaction in the cornfield
The findings from this study showed that the seasonal variabilities of R sd were closely linked to T sd and θd. The R sd increased exponentially with T sd (Fig. 3). There was a robust exponential relationship between R sd and T sd during the 27–31% range of θd. However, there were relatively weak relationships between R sd and T sd for the ranges of 38–41% or 22–26% of θd (Figs. S8–S10). Previous studies have reported the exponential dependence of respiration rate on temperature. It was originated by Van't Hoff in 1898 (Lloyd and Taylor, Reference Lloyd and Taylor1994). Lloyd and Taylor (Reference Lloyd and Taylor1994) used natural logarithms to express the case of respiration rate. Furthermore, Kominami et al. (Reference Kominami, Jomura, Ataka, Tamai, Miyama, Dannoura, Makita and Yoshimura2012) confirmed the exponential relationship and presented their function in 2012: $R_{\rm s}{\rm \;} = {\rm \;}0.0566e^{0.0717T_s}{\rm \;}\left({{\theta \over {\theta + 0.1089}}} \right)$ which was at a depth of 5-cm in their study site located in a mountainous region of western Japan. In this study, the exponential relationships of R s with T s were changed in different ranges of θ. This is likely related to the confounding effect of the association between T s and θ.
The SEI influences R s in most ecosystems (Li et al., Reference Li, Xu and Zou2006; Kanerva et al., Reference Kanerva, Regina, Rämö, Ojanperä and Manninen2007), but the relationships between R s and SEI in the ecosystems are different. A study reported that the SEI was linearly related to R s (Amacher and Mackowiak, Reference Amacher and Mackowiak2011). However, they only had a single year of temporal variation in R s. In this study, we have the 3-year data, and there was a power relationship between R s and SEI, namely, R s = i + k × SEI2 or R s0.5 = b + a × SEI. However, the degrees of relationships in 2008, 2009 and 2011 differed (Table 2 and Fig. S15). For example, the SEI can explain 77, 72, 28 and 51% of the variance in the R s0.5 in 2008, 2009, 2011 and the three years, respectively (Table 2). As the SEI increased by one unit, the R s0.5 increased 0.28, 0.24, 0.13 and 0.21% in 2008, 2009, 2011 and the three years, respectively (Table 2). The SEI can impact R s likely because the precipitation can impact soil respiration by altering both soil temperature and moisture (Gabriel and Kellman, Reference Gabriel and Kellman2014; Deng et al., Reference Deng, Zhang, Han, Chu, Zhang and Hui2018), and the temperature can influence soil CO2 by changing the soil temperature and soil moisture by evapotranspiration (Poll et al., Reference Poll, Marhan, Back, Niklaus and Kandeler2013), but deeper reasons should be further investigated.
Furthermore, the scatter plots of R s and SEI showed that R s gradually changed (i.e. increased or reduced) as SEI increased (Fig. S15). This is because as the SEI increased, the T s × θ mainly resulted in three possible situations: high T s and low θ, moderate T s and θ and/or low T s and high θ. (i) When T s was high and θ was low, the SOM decomposition and root respiration are slow due to depression of low θ (Jensen et al., Reference Jensen, Beier, Michelsen and Emmett2003; Smith et al., Reference Smith, Ball, Conen, Dobbie, Massheder and Rey2003; Mbonimpa et al., Reference Mbonimpa, Gautam, Lai, Kumar, Bonta, Wang and Rafique2015), resulting in lower R s. (ii) T s and θ were moderate, leading to the SOM fast decomposed, mainly resulting in higher R s (Raich and Schlesinger, Reference Raich and Schlesinger1992; Schimel and Clein, Reference Schimel and Clein1996; Giorgi et al., Reference Giorgi, Mearns, Shields and McDaniel1998). (iii) When low T s and high θ occurred, the SOM slowly decomposed owing to the low T s that reduces soil biological activity (Al-Kaisi and Yin, Reference Al-Kaisi and Yin2005), specifically, high θ in soils reduced transpiration due to increased stomatal resistance or anaerobic conditions by flood, thereby reducing or blocking CO2 emissions from soils (Liu et al., Reference Liu, Wan, Su, Hui and Luo2002; Kirkham, Reference Kirkham2011).
Diurnal variabilities of soil CO2 fluxes from cornfield impacted by soil temperature and moisture
The findings in this study showed distinct diurnal patterns of R sh in 2008, 2009 and 2011. The relationships among R sh, T sh and θ h at a diurnal time scale in 2008, 2009 and 2011 differed. No lags were found in 2008, but daily hysteresis loops in 2009 and 2011 were displayed (Figs. 6(a) and S13(d)). The lags between R sh and T sh have also been observed in other ecosystems and vary seasonally with θ h (Verstraete and Focht, Reference Verstraete and Focht1977; Gaumont-Guay et al., Reference Gaumont-Guay, Black, Griffis, Barr, Jassal and Nesic2006; Riveros-Iregui et al., Reference Riveros-Iregui, Emanuel, Muth, McGlynn, Epstein, Welsch, Pacific and Wraith2007; Kirkham, Reference Kirkham2011; Wang et al., Reference Wang, Zha, Jia, Wu, Zhang and Qin2014). The lags may be caused by a mismatch between the depths of T s measurement and CO2 production or by a diurnal variation in the photosynthetic carbon supply which affected the rhizospheric respiration (Kiniry et al., Reference Kiniry, Tischler and Van Esbroeck1999; Li, Reference Li2000; Subke and Bahn, Reference Subke and Bahn2010). The lags may also be attributed to different autotrophic and heterotrophic respiration responses to environmental factors (Riveros-Iregui et al., Reference Riveros-Iregui, Emanuel, Muth, McGlynn, Epstein, Welsch, Pacific and Wraith2007). Autotrophic respiration responds to photosynthetically active radiation (Li et al., Reference Li, Xu and Zou2006) and air temperature, whereas heterotrophic respiration responds primarily to Ts (Lloyd and Taylor, Reference Lloyd and Taylor1994; Winkler et al., Reference Winkler, Cherry and Schlesinger1996). Maybe plant photosynthesis is a factor in influencing diel hysteresis between R s and T s (Tang et al., Reference Tang, Baldocchi and Xu2005). In this study, the mean θ was 29.17% during the corn growing season in 2008, which was smaller than that in 2009 (32.19%) and 2011 (30.97%). The soil in 2008 was relatively drier. Therefore, the diffusion coefficient of CO2 in the air-filled pore space was large enough to facilitate the transport of autotrophic and heterotrophic CO2 from the soil. As the soil becomes drier, microbial activity declines and the time lag between photosynthetically active radiation and T s decreases due to accelerated soil heat diffusion (LI-COR, 2010). This could result in no daily hysteresis loop in 2008. Whereas, in 2009 and 2011, because the θ was higher than that in 2008, the hysteresis was formed between R sh and T sh. (Riveros-Iregui et al., Reference Riveros-Iregui, Emanuel, Muth, McGlynn, Epstein, Welsch, Pacific and Wraith2007; Liebig et al., Reference Liebig, Schmer, Vogel and Mitchell2008).
In this study, the diel variation of R s was constrained by θ, which is similar to the results of Wang et al. (Reference Wang, Zha, Jia, Wu, Zhang and Qin2014). In contrast, Tang et al. reported for an oak-grass savanna that T s largely controlled the diel variation in R s, whereas θ did not affect the diel R s cycle (Tang et al., Reference Tang, Baldocchi and Xu2005). Another situation is that the diel variation of θ was negligible or constant over a day while R s had an obvious diel variation (Gaumont-Guay et al., Reference Gaumont-Guay, Black, Griffis, Barr, Jassal and Nesic2006). In this study, the R sh and θ h had a relatively strong relationship (R 2 = 0.48, 0.85 and 0.66 in 2008, 2009 and 2011, respectively), and there was no apparent daily hysteresis loop between R sh and θ h. Perhaps, it is attributed to the humid continental climate at this study site. This climate is appropriate for corn to grow well and has a high diurnal temperature range. The high daily temperature range potentially leads to conditions where the soil temperature is lower than the dew-point temperature on most nights. As a result, condensation water often occurs on the ground (Agam and Berliner, Reference Agam and Berliner2006), increasing root activity and inducing a high root respiration rate (Wang et al., Reference Wang, Zha, Jia, Wu, Zhang and Qin2014).
Furthermore, in this study, there was a weak relationship between the diel variation of R sh and T sh (R 2 = 0.0036) in 2011. The diel variation of R sh reduced as T sh increased during 14–24 h of the day and T sh decreased during 1–14 h of the day (Fig. S13(a) and (b)). The specific reasons for this behaviour need to be further explored. However, we speculated that the unusual rainfall in 2011 (the less manual rainfall and several heavy rainfalls in this year) likely diluted or constrained the relationship between R sh and θ h measured from July to October in 2011.
Predicted soil CO2 fluxes from cornfields impacted by climate changes
The predicted results in this study using the DAYCENT model showed that the mean annual CO2 fluxes under the temperature scenarios ST4 and ST3 (i.e. air temperature increase of 1.5 and 1°C) would be 4.49 and 3.15% higher than ST1 in the next 36 years. The impacts of ST4 and ST3 on R sy were significant (Table 3). These findings differ from the results from the switchgrass land in South Dakota, which showed that the impacts of temperature increases of 1°C or higher on R s were not significant (Lai et al., Reference Lai, Kumar, Chintala, Owens, Clay, Schumacher, Nizami, Lee and Rafique2016). Some studies have demonstrated that soil temperature, which is strongly related to air temperature, was the primary factor regulating CO2 emission in the growing season (Kirschbaum, Reference Kirschbaum1995; Omonode et al., Reference Omonode, Vyn, Smith, Hegymegi and Gál2007). The significant impacts of ST4 and ST3 on R sy from the cornfield in this study are likely attributed to higher SOM and more appropriate soil microenvironment built by corn plants than that for the switchgrass land, which was a marginal land (Lai et al., Reference Lai, Kumar, Osborne and Owens2018), resulting in higher residue decomposition and root respiration in corn than switchgrass (Omonode et al., Reference Omonode, Vyn, Smith, Hegymegi and Gál2007), subsequently, R sy from cornfield was stronger to soil temperature than for switchgrass. Moreover, the directions of the two effects were similar, as there was an increasing trend over the years. However, the magnitudes of the two effects could not be clearly concluded from the comparisons of predicted soil CO2 fluxes given that there were several distinct influencing factors, such as different data of soil properties, landscape positions, climate, fertilizers, land-use history and so forth at the two study sites.
The soil R sys under SP1 (−30%SP3) and SP3 (baseline precipitation) were unable to be compared (Table 4) because the two slope lines were not parallel based on the Parallel-line analysis, indicating that there was a complicated situation impacted under the drought SP1. The soil R sys under the SP2 (−15%SP3), SP4 (+15%SP3) and SP5 (+30%SP3) were not significantly different than that for the SP3 (Table 4). This is in accord with a previous study that reported that the CO2 release by aerobic respiration was primarily temperature-dependent but became moisture-dependent as soil dries (Smith et al., Reference Smith, Ball, Conen, Dobbie, Massheder and Rey2003). However, the specific impacts of precipitation on GHG emissions from the soil surface are uncertain (Omonode et al., Reference Omonode, Vyn, Smith, Hegymegi and Gál2007). This is because the soil moisture's strong dependence on precipitation affects soil CO2 fluxes by directly influencing corn root and microbial activities and indirectly on soil physical and chemical properties (Raich and Schlesinger, Reference Raich and Schlesinger1992; Schimel and Clein, Reference Schimel and Clein1996). Moreover, there was a wide range of fluctuations in R ss under drought conditions (Lai et al., Reference Lai, Kumar, Chintala, Owens, Clay, Schumacher, Nizami, Lee and Rafique2016). Therefore, it could not directly compare the R sys under SP1 (−30%SP3) and baseline precipitation (SP3).
Furthermore, the root R sy under drought SP1 and SP2 were not significantly different from that for the SP3, whereas the root R sys under wet SP5 and SP4 were significantly lower than that for the SP3 (Table 4). The effect of drought on root R sy depends on the function of plants and the response of plant roots to drought (Zhang et al., Reference Zhang, Niu, Hall, Wen, Li, Fu, Wan and Elser2014). Drought conditions may limit plant growth and decrease the input from litter and the supply of photosynthetic products to the root system and root respiration (Gomez-Casanovas et al., Reference Gomez-Casanovas, Matamala, Cook and Gonzalez-Meler2012). Drought stress may limit the number and size of soil microbial populations (Manzoni et al., Reference Manzoni, Schimel and Porporato2012; Zhang et al., Reference Zhang, Niu, Hall, Wen, Li, Fu, Wan and Elser2014). Therefore, the effect of drought on root R sy could be an indirect reflection (Scott-Denton et al., Reference Scott-Denton, Rosenstiel and Monson2006; Zhou et al., Reference Zhou, Wan and Luo2007; Zheng et al., Reference Zheng, Wang, Yu, Jia and Zhang2021). The indirect impact may result in an insignificant change in the root R sy under drought conditions. In contrast, excessive precipitation can reduce gaseous connectivity among micropores within soils, temporally reducing oxygen diffusion into and through soils and air-filled porosity (Sexstone et al., Reference Sexstone, Revsbech, Parkin and Tiedje1985), increasing stomatal resistance, hence decreasing CO2 respiration (Kirkham, Reference Kirkham2011) and corn yield, likely resulting in a significantly low root R sy and corn yield (Table 4).
However, statistically testing modelled data can always result from significant differences if simulating for enough years. Therefore, we used the DAYCENT model to predict the 36-year CO2 flux data at different scenarios in this study. The comparisons for the modelled data were to find significant differences in CO2 fluxes among different scenarios within the 36 years. The significant differences are relative, not absolute comparisons as with measured data. Therefore, our results from the comparisons were relative among the scenarios within the 36 years, hence reasonable.
Also, the predicted R sy had a significantly increasing trend over the next 36 years in terms of the projected temperature and precipitation from 2014 to 2049 at the South Dakota site using the nine climate models (Fig. 7; the positive slop with P value < 0.0001 based on the trend test). The projected daily mean temperature from 2014 to 2049 had an increasing trend (Fig. S17). The soil CO2 fluxes exponentially increased with the temperature in the cornfield (Fig. 3). Therefore, there could be a significantly increasing trend in the future soil CO2 fluxes over time. The mean R sy from 2014 to 2049 was 665.84 g/m2/year, which was 22.3% higher than the mean R sy (544 g/m2/year) from croplands (Raich and Schlesinger, Reference Raich and Schlesinger1992). These results indicated that the soil CO2 fluxes from cornfields would be significantly higher than the mean R s from other croplands. Other studies also reported that perennial crops emit less CO2 emissions than corn (Adler et al., Reference Adler, Grosso and Parton2007; Lai et al., Reference Lai, Kumar, Chintala, Owens, Clay, Schumacher, Nizami, Lee and Rafique2016).
Limitations and further work
The model in this study was calibrated using the CPTE methodology (Mbonimpa et al., Reference Mbonimpa, Gautam, Lai, Kumar, Bonta, Wang and Rafique2015; Lai et al., Reference Lai, Kumar, Chintala, Owens, Clay, Schumacher, Nizami, Lee and Rafique2016), which can obtain the best model based on the four quantitative criteria (Moriasi et al., Reference Moriasi, Arnold, Van Liew, Bingner, Harmel and Veith2007; Dai et al., Reference Dai, Birdsey, Johnson, Dupuy, Hernandez-Stefanoni and Richardson2014) and improve efficiency and accuracy of model calibration manually using ‘trial and error’ method. The measured R sd in 2008, 2009 and 2011 calibrated the DAYCENT model. Of 461 values of measured R sd in the growing seasons in 2008, 2009, 2011 and 19 values had sudden and unexplainable changes and were unable to be captured by the DAYCENT model. Also, the 19 values changed the trend of whole data over time, even though the 19 values are only 4.1% of total observations. To simulate the trend of 95.9% values using the DAYCENT model, the 19 values as outliers were removed.
Some parameters differed by 1 order of magnitude from the default in this study. The default values were determined by the model developer in Colorado, USA, while the model calibration for this study was based on the data collected in South Dakota, USA. The two states have different environmental conditions, soil types, landscapes and other relevant characteristics. The model developer has defined the lower and upper bound for each parameter. All calibrated parameters were in the predefined lower and upper bounds range. This clarifies the need for significant differences from default values for some parameters.
This study reported the temporal variability of soil CO2 fluxes from a cornfield but no spatial distribution results. This was primarily because the measurement of R s from multiple sites using the Automated Soil CO2 Flux System can be costly. However, the soil CO2 flux spatial distribution is essential for policymakers and producers to find the differences in soil CO2 emissions at different sites under various climate conditions. Based on the differences in soil CO2 emissions, one can suggest which regions should grow more corn to mitigate soil CO2 emissions. Moreover, as stated previously, the R s from cornfield would be significantly higher than the mean R s from other croplands. Therefore, future research is needed to (i) use the static chamber method (Hutchinson and Mosier, Reference Hutchinson and Mosier1981; Parkin and Venterea, Reference Parkin, Venterea and Follett2010) or flux tower measurement to measure R s at various sites for evaluating the spatial distribution of R s in cornfields, (2) explore different methods such as tillage, fertilization and irrigation methods for mitigating R s from cornfields and (3) assessing sensitivities of R ss from different croplands to changes in temperature to regulate land-use policies.
Conclusions
This study showed the findings of continuous hourly soil CO2 flux measurements from a cornfield at the South Dakota site, and especially the temporal variability of measured and modelling soil CO2 fluxes related to Ts, θ and climate changes. The findings indicate that the daily R s exponentially increased with T s constrained by θ. The SEI significantly impacted R s, but the impacts could be positive or negative based on different quantities of Ts and θ. At the diurnal scale, there were different trends in R s and dissimilar relationships among R s and T s and θ in 2008, 2009 and 2011. The predicted yearly R s in 2014–2049 significantly increased as the temperature rose by 1°C or higher, but predicted root R ss and corn yield under different temperature scenarios were not different. The predicted yearly R ss, root R ss and corn yield decreased with an increase in precipitation scenarios, but the root R ss and corn yield significantly reduced as the precipitation increased by 15% or higher. The predicted yearly R s from the cornfield based on the projected temperature and precipitation using the nine regional climate models had a significantly increasing trend, indicating that the cornfield will generate more soil CO2 emissions in the future. Future research is needed to evaluate the spatial distribution of R s, explore different methods to mitigate R s from cornfields and assess sensitivities of R ss from different croplands to temperature changes for adjusting land-use policies.
Supplementary material
The supplementary material for this article can be found at https://doi.org/10.1017/S0021859622000132
Author contributions
L. L. and S. K. conceptualized and designed the study. D. R. and M. A. projected future climate data. L. L. calibrated and validated the DAYCENT model, predicted CO2 data, performed statistical analyses, and prepared the manuscript draft. S. K., D. R. and M. A. reviewed and revised the manuscript.
Financial support
The research was supported by the funding provided by the Agricultural Experiment Station of the South Dakota State University. The regional model experiments were conducted using resources of the Oak Ridge Leadership Computing Facility, which is a DOE Office of Science User Facility supported under Contract DE-AC05-00OR22725. M. A. was supported by the National Climate-Computing Research Center, which is located within the National Center for Computational Sciences at the ORNL and supported under a Strategic Partnership Project, 2316-T849-08, between DOE and NOAA.
Conflict of interest
The authors declare there are no conflicts of interest.
Ethical standards
Not applicable.