James Carville once quipped, “Pennsylvania is Philadelphia and Pittsburgh with Alabama in between.” Footnote 1 This southern Democratic strategist’s assessment of political geography informs Obama’s controversial comments regarding a segment of the American electorate in 2008. Shortly before the Keystone State’s primary, Obama said that in difficult times, many small-town residents “cling to their guns and religion.” Footnote 2 His campaign rival, Hillary Clinton, jumped on those remarks; indeed, Obama stumbled in Pennsylvania. However, he carried Pennsylvania and the rest of the Northeast in the general election, decisively defeating Republican John McCain in 2008. To be sure, the voters that Obama disparaged were not aligned with him anyway because those with the greatest penchant for clinging to God and guns—like actual Alabamians—were disproportionately located well below the Mason–Dixon Line. Indeed, as has been true since the late 1960s (Black and Black Reference Black and Black1987), the South in 2008 was a Republican stronghold. Nevertheless, Obama notched notable victories in Florida and Virginia in both of his elections and in North Carolina in 2008—an impressive feat given that his immediate Republican predecessor, George W. Bush, swept the South in both of his presidential runs.
Regional differences in America appear to be durable and strong. Harking back to the Founding and eventually manifesting in the Civil War, the political divide between the Northeast and the South seems to be permanent. However, a complete partisan reversal of these sectional strongholds transpired in the late twentieth century. At one time, Republicans dominated presidential politics in the Northeast (Rae Reference Rae1989; Reiter and Stonecash Reference Reiter and Stonecash2011), whereas Democrats monopolized the electoral votes in the South (Black and Black Reference Black and Black1992). Today, the South is reliably red and the Northeast is solidly blue. This article examines one important reason of how Obama broke that pattern to carry some southern states: population migration.
Despite the remarkable strength of the Democratic Party in the Northeast and the equally formidable prowess of the GOP in the South, it is the evidence of increasing competitiveness in certain parts of the South that inspired this study. Only a few decades ago, the migration of residents from the Northeast and the Midwest infused the South with a healthy dose of Republicanism (Scher Reference Scher1997). Today, native Southerners are decidedly more Republican than recent Northern in-migrants, who are more Democratic in affiliation and presidential voting preferences (Hillygus, McKee, and Young Reference Hillygus, McKee and Young2015). This article examines the impact of migration to the South on voting behavior in the 2008 and 2012 presidential elections. Our analysis of county- and individual-level data demonstrates the extent to which Northern newcomers are tilting Dixie in a Democratic direction.
SOUTHERN MIGRATION PATTERNS
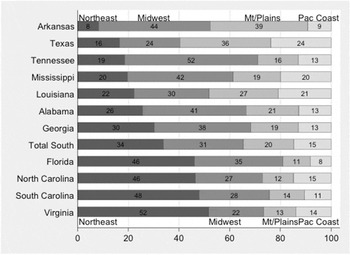
We classify Southern newcomers according to the five state-regional categories defined by Black and Black (Reference Black and Black2007): the Northeast, the South, the Midwest, the Mountains/Plains, and the Pacific Coast. Footnote 3 Because we are interested in the influence of in-migration to the South on presidential voting patterns, South-to-South migration is not discussed. Figure 1 shows the percentage of movers to the South in each southern state and South-wide, according to the region from which newcomers migrated (i.e., the Northeast, the Midwest, the Mountains/Plains, and the Pacific Coast). The states are rank-ordered from the least to the greatest percentage of movers from the Northeast. The data total 100% based on the percentage breakdown of migrants from the Northeast, the Midwest, the Mountains/Plains, and the Pacific Coast in each state. These are one-year American Community Survey (ACS) data estimated by the US Census Bureau in 2012.
Percentage of Regional In-Migration by Southern State, 2012
Source: American Community Survey, 2012.
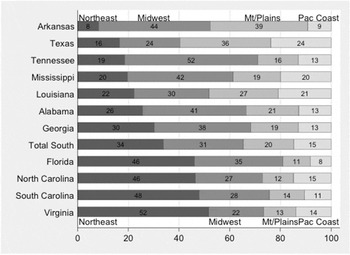
On the lower end, only 8% of migrants to Arkansas hail from the Northeast, whereas on the higher end, a majority (52%) of Northern newcomers to Virginia came from the Northeast. After Arkansas, Texas and Tennessee exhibit the lowest rates of Northeastern in-migration; these Rim South states are then followed by three Deep South states—Mississippi, Louisiana, and Alabama—which have proportionally higher Northeastern residents. Footnote 4 All of the previously mentioned states and Georgia—with the next highest percentage of Northeastern in-migrants at 30%—have a higher percentage of newcomers from the Midwest than from the Northeast. Texas is the only state with a plurality of in-migrants from the GOP-dominant Mountains/Plains. After Georgia, a notable Eastern Atlantic Seaboard pattern manifests with Northeasterners constituting a clear plurality of in-migrants to Florida, North Carolina, South Carolina, and Virginia. Overall, the most recent arrivals to the South are slightly more than 33% from the Northeast, 31% from the Midwest, 20% from The Mountains/Plains, and 15% from The Pacific Coast.
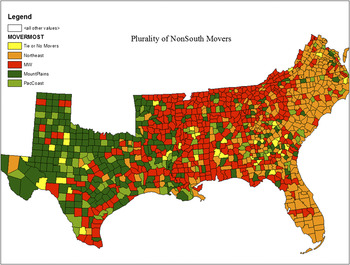
The map in figure 2 is a more fine-grained visual inspection of recent southern migration patterns, indicating the plurality regional category (the Northeast, the Midwest, the Mountains/Plains, and the Pacific Coast) of newcomers to the South at the county level. Unlike the state-level data in figure 1, which were based on one-year ACS data in 2012, the county-level data in figure 2 are based on five-year ACS data from 2008 to 2012. By highlighting the modal region from which movers come, figure 2 is an insightful illustration of recent migration patterns to the South.
Modal Regional Origin of Movers into The South, 2008–2012

Starting in the West with Texas, the predominant pattern of Mountains/Plains in-migrants is evident. We also see a fairly broad scattering of counties with a plurality of newcomers hailing from the Pacific Coast, whereas Midwest in-migrants are prevalent in several counties in Central, East, and South Texas (with a few in the panhandle). Moving eastward into Arkansas and Louisiana, the pattern of in-migration found in Texas begins to give way to a new pattern in which in-migrants from the Midwest dominate the middle of Dixie: Eastern Arkansas, Mississippi, most of Alabama, Tennessee, Western Virginia, Western North Carolina, and the South Carolina upcountry.
The in-migration pattern found in Georgia is interesting because of a fairly broad and representative distribution of newcomers from the four Northern regions. Indeed, it is evident that Georgia is an outlier versus the other four Atlantic Seaboard states that exhibit an obvious in-migration pattern of Northeastern dominance. With the exception of the Deep South state of South Carolina, the massive influx of Northeasterners to the Rim South states of Virginia, North Carolina, and Florida partly explains their presidential battleground status and Obama’s success there, despite narrowly losing North Carolina in 2012 (Hood and McKee Reference Hood and McKee2010). Of course, the presentation in figure 2 can only go so far—perhaps providing more “grist” for speculative arguments than actual confirmation. Hence, we conducted multivariate assessments at the county and individual levels to estimate the extent that recent Northern in-migration contributes to voting behavior in the South.
Given that states with high Yankee in-migration are also those that flipped blue in 2008 and 2012, the previous summary data provides an initial impression that migration patterns co-vary with Southern presidential voting.
DATA AND METHODS
Given that states with high Yankee in-migration are also those that flipped blue in 2008 and 2012, the previous summary data provides an initial impression that migration patterns co-vary with Southern presidential voting. However, multivariate analysis is necessary to demonstrate that the role of migration in ballot preferences is not due to confounding factors. We analyzed both county- and individual-level survey data to provide multilayered evidence for understanding how migration influences presidential voting in the southern United States. The individual-level analysis used the 2008 American National Election Survey (ANES) data, whereas the county-level models relied on data collected from multiple sources including presidential election returns for 2008 and 2012 from Dave Leip’s Atlas of US Presidential Elections and control variables from the ACS five-year county-level estimates, as well as the Association of Religion Data Archives (ARDA). Footnote 5 As was the case for descriptive data previously presented, we used Black and Black’s (Reference Black and Black2007) regional classifications to assess variations in the relationship between Southern in-migration and presidential voting behavior in the 2008 and 2012 elections.
To estimate the relationship between migration and voting behavior, we began with county-level models. The South has 1,143 counties and county equivalents. Regarding analysis, counties have a few shortcomings (e.g., population heterogeneity) but the advantages exceed the deficiencies. Unlike cities and legislative districts, county boundaries are mostly stable over time. They also are exhaustive, with counties and their equivalents encompassing the entire nation. Finally, counties are the smallest common unit for which we could aggregate our control variables and our two variables of interest: migration and election data. Similar to other studies using geographic units to explain individual-level behavior, county-level estimates suffer from potential ecological-inference problems; therefore, we reinforce our findings with an individual-level model. However, with smaller units, there is less risk of this inferential problem. Although there are outliers within large urban-dominated counties of more than a million residents (e.g., Harris County, Texas, and Miami–Dade, Florida), the average county population in the South is far less—approximately 85,000.
In general, our analytic strategy was to regress two-party presidential votes onto in-migration percentages from non-South regions with a spatial maximum-likelihood model. The independent variable of interest was migration into the South from the four Northern regions (the Northeast, the Midwest, the Mountains/Plains, and the Pacific Coast); a within-South migration measure also is included. To measure this relationship at the county level required the use of the ACS five-year migration-flow estimates. Respondents were asked whether “they had lived in their current residence one year ago” and, if so, where that was. In essence, this created a large matrix of migration among all of the counties in the United States in a given five-year period, using 2008—2012 data. For each of the 1,143 counties in the South, we counted the number of people who migrated from non-South counties and coded them for their region of origin (e.g., the Northeast). To make sense of migration as a proportion of a southern county’s population, we totaled all of the migrants from each northern region and divided the result by each county’s population. This proportion is generally very low, of course, with means of less than 1% and maximum percentages in the single digits. The dependent variable was the presidential vote, which was measured by Obama’s average two-party, county-level vote share between 2008 and 2012.
Our second analysis used cross-sectional individual-level ANES data from the 2008 presidential election to gauge the relationship between population migration and presidential voting behavior. To the extent possible, we attempted to mirror the county-level analysis; therefore, the models include several control variables akin to the county models. There are some differences worth describing. First, there are necessary differences in the way that variables were measured. With aggregate data, we used percentages for most measures; with survey data, the variables were all coded as dummies. Second, the typical measurement risks inherent in survey work applied. Over-reporting political participation and other socially desirable behaviors influences survey-based inferences. Third, we were able to control for party identification, unlike in the spatial models. Fourth, there is a difference in the way migration was measured. For the county-level ACS data, the survey asked about relocating in the past year. For the ANES data, the migration question was: “Where is it that you grew up?,” which captured a somewhat different sense of migration—one that spanned a longer time frame. Footnote 6
RESULTS
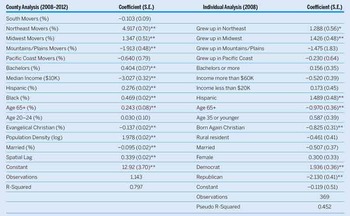
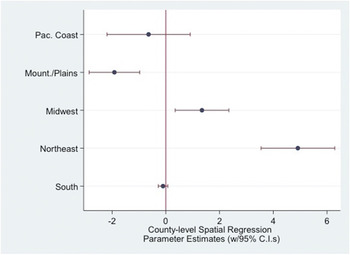
To convey the relationship between migration patterns and presidential voting preferences, table 1 displays both county- and individual-level regression results. The county model shows that rising levels of in-migration from the Northeast and the Midwest shape higher Democratic presidential voting tendencies. In contrast, increasing the number of migrants from the Republican stronghold of the Mountains/Plains into southern counties moves the tendencies in the other direction. Footnote 7 Figure 3 shows the salient parameter estimates, highlighting the importance of population flows from the Northeast, the Midwest, and the Mountains/Plains in affecting Southern presidential voting in the 2008 and 2012 elections. For instance, a 10% increase in newcomers from the Northeast to a southern county increases the Democratic presidential vote in 2008–2012 by approximately five percentage points.
County- and Individual-Level Analysis of the Southern Presidential Vote in 2008 and 2012

Notes: The county analysis is a spatial maximum-likelihood model (**p ≤ 0.01, *p ≤ 0.05) of the average vote won by Obama between 2008 and 2012. Sources include ACS five-year estimates, Dave Leip’s Atlas of US Presidential Elections, and the Association of Religion Data Archives. The individual analysis is a logistic regression of vote choice (**p ≤ 0.01, *p ≤ 0.05, 1 = Obama vote, 0 = McCain vote) based on data from the 2008 ANES. Black voters were omitted due to a lack of voting variability (100% for Obama). “Grew up in The South” is the omitted variable of comparison.
Regional Origin of Movers to Southern Counties and the Presidential Vote in 2008–2012
Notes: Model (n = 1,143) includes controls for education (Bachelors percentage); median income; percentages of Hispanics, blacks, those older than age 65, those ages 20–24, Evangelical Christians, and married; population density (logged); and a spatial lag (see table 1). Sources include ACS five-year estimates, Dave Leip’s Atlas of US Presidential Elections, and the Association of Religion Data Archives. Positive estimates indicate factors predicting an Obama vote.
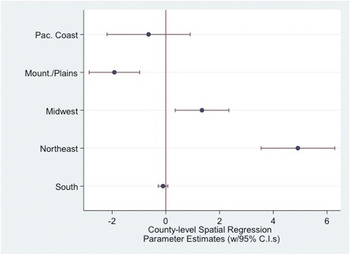
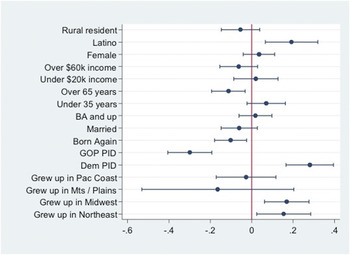
Table 1 also displays results for a logistic regression of vote choice in the case of non-black Southern voters (McCain and Obama voters only) in the 2008 presidential election. Footnote 8 With “Growing up in The South” as the omitted comparison category, we found that respondents who grew up in the Northeast and the Midwest were much more likely to vote Democratic. We ran postestimation marginal effects on the logit coefficients from table 1 and plotted them in figure 4. Figure 4 reveals the substantive relationship between where respondents grew up and their voting preferences in 2008. These first differences in the probability of voting for Obama in 2008 show the point estimate as well as the 95% confidence interval for the independent variables from the second model in table 1. Most of the control variables behave as conventional wisdom would predict, with Southern Latinos more likely to vote for Obama, older Southerners and Born Again Christians preferring McCain, and party identification indicators in the expected direction as well.
Finally, among those who did not identify with a major party, the swing was by far the largest: native Southern Independents (including “leaners”) were approximately 39% likely to cast a vote for Obama, whereas otherwise identical Southern residents raised in the Northeast had an approximate 70% chance of supporting the Democrat in 2008.
Predicted Probabilities of Southern Presidential Vote in 2008
Notes: Postestimation first differences were calculated from table 1 results (with 95% confidence intervals). Positive estimates indicate factors predicting an Obama vote; negative values favor McCain. Estimates with confidence intervals that cross the zero point are not statistically significant (e.g., rural resident).

For the southern in-migration variables—even after controlling for known correlates of vote choice—growing up in the Northeast or the Midwest significantly increased the likelihood of preferring the Democratic presidential candidate. Where a respondent grew up did more to explain voting tendencies in this model than other factors often discussed in predicting presidential preferences among Southerners, including gender, marital status, and education level.
Consider the presidential preferences of native Southerners vis-à-vis voters who grew up in the Northeast. Assuming a typical Republican (i.e., setting the other controls at their modal values), a native Southerner had an approximate 7% probability of voting for Obama in 2008, whereas a Republican who grew up in the Northeast had an approximate 22% probability of backing the Democrat. Comparing a typical native Southern Democrat with an otherwise identical Democrat who grew up in the Northeast shifts the likelihood of voting for Obama from 82% to 94%. Finally, among those who did not identify with a major party, the swing was by far the largest: native Southern Independents (including “leaners”) were approximately 39% likely to cast a vote for Obama, whereas otherwise identical Southern residents raised in the Northeast had an approximate 70% chance of supporting the Democrat in 2008.
FINAL THOUGHTS
Before 2008, the last time that Virginia had given its electoral votes to a Democrat was in 1964 for Lyndon Johnson. Indeed, even in 1976, when the South’s own Jimmy Carter won 10 of the 11 ex-Confederate states, it was the Old Dominion that narrowly backed Gerald Ford. In 1992 and 1996, Bill Clinton managed to pluck four Southern states; however, in neither election did the Arkansan wrest Virginia from the Republican-win column. This 44-year Democratic presidential drought is remarkable, and an important reason for its eventual end was observed within select communities in Virginia.
Consider the case of Manassas Park, a small city of fewer than 20,000 people who reside within the orbit of the Washington, DC suburbs. With its population rapidly increasing via Northern in-migration, Manassas Park exemplifies the more dynamic, growing communities in the South. It has a racially diverse demographic profile resembling the national average (i.e., 10% black, 30% Latino, and slightly more than 50% white); however, its above-average population growth is attributable to in-migration from the Northeast and the Midwest. Another noteworthy attribute of Manassas Park is that it voted reliably Republican in the 1980s and 1990s but has tilted dramatically in the other direction since 2008. In 1988, Michael Dukakis earned only 30% of its votes; in 1992 and 1996, Bill Clinton picked up only 42% and 40%, respectively; and Al Gore managed about the same percentages in 2000. In 2004, John Kerry did slightly better with 45%, but Barack Obama took 60% in 2008 and 62% in 2012.
How much does in-migration influence southern presidential voting patterns? Manassas Park was an archetype for our thesis; however, we found that, in general, Southern communities that witness moving vans coming in from the Northeast and the Midwest tilt toward Democratic voting habits. Manassas Park and similar locales are microcosms of the latest changes to Southern politics. It may be true that within various regions of the United States, partisan sorting has contributed to greater political homogeneity and, on a macro-scale, has accounted for the large swaths of red and blue regions coloring the presidential map (Bishop and Cushing Reference Bishop and Cushing2008; Black and Black Reference Black and Black2007; Levendusky Reference Levendusky2009; McKee and Teigen Reference McKee and Teigen2009). However, this article demonstrates that migratory patterns into the South are disrupting this partisan uniformity. In fact, it is because most of the regions outside of the South are considerably more Democratic that Dixie in-migration leads to these important changes in presidential voting behavior. When enough Manassas Parks are aggregated, a deep-red presidential stronghold such as Virginia turns purple and has an important role in shaping the outcome of presidential elections.