

INTRODUCTION
Considerable research attention has concentrated on factors that influence the commitment that employees feel toward to their organizations. Much of this research focuses on what, broadly, can be considered internal characteristics associated with the company: policies, practices and structural features of the firm, the nature of the work, and the people with whom one works (e.g., Meyer, Stanley, Herscovitch, & Topolnytsky, Reference Meyer, Kam, Goldenberg and Bremner2002). Relatively little is known about how employees’ attitudes are influenced by events that originate outside, but can have impact upon, their organization. This is not surprising as such events, by their very nature, are often unexpected and unpredictable, rendering the appropriate timing of attitude measurement quite challenging (Johns, Reference Hui and Triandis2006).
The contribution of this panel study, conducted in a large Venezuelan organization, lies, in part, with the serendipitous opportunity that we had to assess employee commitment before and after a series of dramatic, aggressive, and unexpected political events. In that regard, this research is in the tradition of work such as that examining the effects, on employee attitudes and behaviors, of the 911 attacks (Byron & Peterson, Reference Byron and Peterson2002; Ryan, West, & Carr, Reference Meyer, Stanley and Vandenberg2003), the 2008–2009 economic crisis (Laumer, Eckhardt, Maier, & Weitzel, Reference Kushnir, Fried and Malkinson2011), or the assassination of a Prime Minister (Kushnir, Fried, & Malkinson, Reference Kaufman and Rousseeuw2001). It differs from this work, however, in that the events in question were directed specifically at the particular organization that we examined. Thus, we were able to gain some insight into the interplay among targeted external events, senior managerial reactions to those events, and employee commitment to the organization. Finally, and to the best of our knowledge, this is the first panel study analyzing changes in organizational commitment profiles, across time, that may be influenced by forces external to the organization. Increasing our understanding of how such changes might occur is critically important, we would argue, given the growing body of evidence (e.g., Meyer, Kam, Goldenberg, & Bremner, Reference Meyer and Allen2013; Meyer, Stanley, & Parfyonova, Reference Meyer, Stanley, Herscovitch and Topolnytsky2012) that an employee’s particular commitment profile has implications for his or her work-related reactions and behavior.
The context and precipitating events
This study was conducted in Caucagua, Venezuela, at a bottling plant within the privately held Empresas Polar conglomerate, the largest private organization in the country. At the time this research was conducted, the holding company provided formal employment to more than 30,000 individuals, operated 28 plants, and had more than 190 branches, agencies, and distribution centers located across the Venezuelan territory. The bottling plant involved in this research was the largest within the company’s non-alcoholic beverages division.
The employee survey data reported here were collected at two time points, one in January and the other in July 2009. During this period, the organization did not undergo any internal employee-related interventions or changes to basic operations. In other ways, however, it was a particularly tumultuous period both for Venezuelans and, in particular, for the employees and managers at Empresas Polar. At the time of the first survey, although senior management was mindful of the possibility of political interference in the organization, it was operating in a relatively normal and stable manner. Between then and the second survey, 6 months later, however, the organization received a great deal of unwanted, and threatening attention from Venezuela’s then President Hugo Chavez.
As a result of the collapse in oil prices from 147 USD per barrel in July 2008 to 45 USD at the beginning of 2009, in an economy with a high dependency on the international prices of the vital commodity, the Venezuelan government reacted to this contingency by establishing a new law. Specifically, the law forced companies in the food and beverage sector, to put a large proportion of their products (70–95%) under a system of controlled prices that were tightly monitored by the government. As a mechanism by which to enforce compliance with this new law, the government of Venezuela instructed the Army to take control over some plants, among them two owned by Empresas Polar.
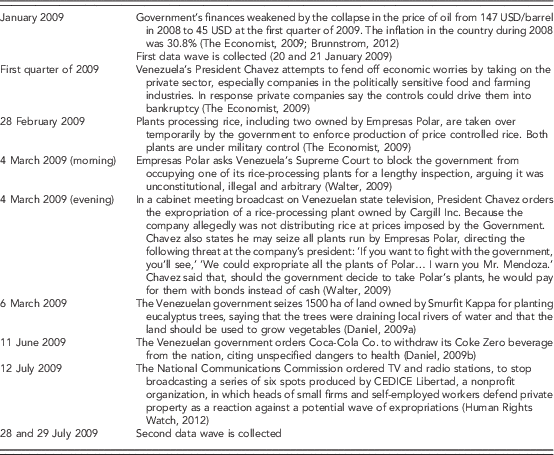
After a long and laborious inspection by government officials at two of its facilities, with the permanent presence of soldiers from the Venezuelan army, the organization’s senior management responded with a lawsuit presented to the Supreme Court. In the lawsuit, they argued that the lengthy inspection was unconstitutional, illegal and arbitrary. A few hours later, in a cabinet meeting broadcast by the state television, at prime time, Chavez stated that he could expropriate all the plants of Empresas Polar. (A detailed timeline of these events are summarized in Table 1.) The timing of these incidents, relative to our surveys, afforded us a unique opportunity to explore the potential impact that such events would have on employee commitment to the organization.
Chronology of events between the two waves of data collection

Organizational commitment
In keeping with much contemporary commitment research, we drew from the three-component model of commitment (Allen & Meyer, Reference Allen and Meyer1990; Meyer & Allen, Reference Laumer, Eckhardt, Maier and Weitzel1991, Reference Meyer and Allen1997), which conceptualizes commitment as a force that binds an individual to a target course of action, in this case, remaining with the organization. The model, which has received extensive empirical examination and meta-analytic support (e.g., Meyer et al., Reference Meyer, Kam, Goldenberg and Bremner2002) in the research literature, conceptualizes commitment as having three distinct components. Affective commitment (AC) refers to the employee’s emotional attachment to, identification with, and involvement in the organization, characterized by a desire to stay with the organization. In short, employees with strong AC remain with the organization because they ‘want to.’ Continuance commitment (CC) refers to the employee’s awareness of the personal costs associated with leaving the company. Employees with strong CC remain because they feel they ‘have to’ do so. Finally, normative commitment (NC) reflects an obligation felt toward the organization; in other words, it refers to the employee’s feeling that he or she ‘ought to’ stay in the company. According to the three-component model, an individual’s commitment is best characterized, not in terms of each of the components considered individually, but as a profile made up of all three. Thus, employees with different affective–continuance–normative ‘commitment profiles’ are theorized to have different relationships with their organizations and to behave and react accordingly.
It was not entirely clear to us, therefore, what impact these events might have on these three components of commitment and, hence on employees’ commitment profiles, thus, we stopped short of making specific predictions and, instead, drew on existing theory and research – within both social and organizational psychology – to offer the following speculations.
Affective and Normative Commitment
Conceptually, affective commitment and normative commitment are distinct. As meta-analytic work has shown, however, antecedents of the two constructs tend to be similar in nature with relations involving NC somewhat weaker than those involving AC (Meyer et al., Reference Meyer, Kam, Goldenberg and Bremner2002). Generally speaking, key ‘antecedent’ variables of both of these dimensions include those work experiences that signal to employees that the organization supports them (e.g., fair treatment, empowerment, transformational leadership).
It is difficult to know, a priori, how employees interpreted the organization’s response to Chavez’s demands. To the extent that the response was seen as support for employees, which seems likely, we speculate that both AC and NC would increase. Alternatively, in this unique situation, positive effects on NC might be particularly strong. Recall that NC is based on the mindset of obligation, the feeling that one owes the organization one’s loyalty either out of a sense of moral duty or indebtedness. Under typical organizational conditions, strong feelings of this sort may not be easily evoked. Thus, the relatively modest work experience effects on NC, reported in the literature (Meyer et al., Reference Meyer, Kam, Goldenberg and Bremner2002) may simply reflect that, in most settings, the intensity of work experiences that could trigger NC is quite modest. That is, they fall with an ‘expected’ or ‘typical’ range – nothing egregious, nothing remarkable. One could argue that the situation here, and that Empresas Polar managers stood up for the organization and its employees, falls considerably out the normal range of experiences that researchers typically examine in commitment studies. To the extent that these experiences were interpreted as special, or even remarkable, support for employees (coupled with the potential ‘moral tone’ the situation evoked), one might expect effects on NC to be stronger than on AC.
Continuance Commitment
Research evidence supports the theoretical idea that the ‘perceived costs’ associated with leaving one’s organization is negatively related to CC (Meyer et al., Reference Meyer, Kam, Goldenberg and Bremner2002). That is, employees who perceive the costs associated with leaving to be high (and/or alternatives to be low) will express strong CC and, correspondingly, those who see minimal costs associated with leaving with express weak CC (Meyer et al., Reference Meyer, Kam, Goldenberg and Bremner2002). Making a priori predictions about the impact of these events on CC is particularly challenging, however, as it is difficult to predict the type of cost assessments that Empresas Polar employees might make. In this situation, how much would be lost upon leaving the organization? Possibly, believing their organization to be under some threat from the government – whether it be closure, censure, or nationalization – employees might feel a lessening in the costs associated with leaving and, thus, feel decreased CC. Alternatively, employees might construe their challenging work experiences (particularly if they were involved in any resistance activities) as ‘investments’ in the organization that, once made, would be costly to forfeit, thus leading to increased CC. Further complicating this, of course, is the turbulent and uncertain employment picture that existed in Venezuela at the time. Given that Empresas Polar was seen as one of the most prestigious and well-paying employers in Venezuela, leaving under any circumstances might carry high costs.
Commitment profiles
Although it is interesting to speculate how the events involving Empresas Polar might influence the separate components of commitment, an approach that is more consistent with current commitment theory involves consideration of commitment profiles (Gellatly, Meyer, & Luchak, Reference Everitt, Landau and Leese2006; Meyer et al., Reference Meyer, Stanley, Herscovitch and Topolnytsky2012). The person-centered approach recognizes that the variables under study can combine differently for some types of individuals than they do for others. Therefore, this approach focuses on identifying and comparing groups of individuals sharing similar patterns of variables within a population (Meyer, Stanley, & Vandenberg, Reference Meyer, Stanley and Parfyonova2013). As such, this approach is well suited to research that examines how combinations of variables vary across time. It is relevant to highlight at this point, that most of the existing profile studies have focused on the implications of these on behavior and well-being. Little attention has been paid to how profiles are formed or their temporal stability (Kam, Morin, Meyer, & Topolnytsky, Publication year: Reference Kabins, Xu, Bergman, Berry and Wilson2016).
Of the several possible commitment profiles, research evidence shows that the most common profiles are: the fully committed (high scores on the three components: ACN), the uncommitted (low scores on the three components: acn), the CC-dominant, the AC/NC-dominant and the AC-dominant (Meyer et al., Reference Meyer, Stanley, Herscovitch and Topolnytsky2012; Kabins, Xu, Bergman, Berry, & Wilson, Reference Joreskog2016; Kam et al., Publication year: Reference Kabins, Xu, Bergman, Berry and Wilson2016).
A relevant mechanism through which the events described here might have influenced organizational commitment, in particular the potential transitions in the commitment profiles of the employees, is psychological reactance. Brehm and Brehm (Reference Brehm and Brehm1981: 91) describe reactance as ‘the motivational state that is hypothesized to occur when a freedom is eliminated or threatened with elimination.’ Typically, individuals feel they have some freedom to select their employer. For Empresas Polar employees, Chavez’s demands – and the possibility that a socialist Government could become their new employer – threatened this particular freedom. It seems reasonable to suggest that employees who were motivated to reestablish that freedom could do so by (a) increasing liking for the threatened choice (Brehm, Stires, Sensenig, & Shaban, Reference Brehm, Stires, Sensenig and Shaban1966), possibly expressed via increased levels of affective and/or NC, switching their profiles into an AC, NC or AC/NC-dominant, (b) denying the existence of the threat (Worchel, Andreoli, & Archer, Reference Worchel, Andreoli and Archer1976), that is, maintaining the same profile considering that the threaten was not real, like thinking it was just a media spectacle, or (c) exercising a different freedom to gain feeling of control and choice (Wicklund, Reference Wicklund1974), such as switching the type of attachment to the firm in which the employee feels more control, for example, moving from a mainly AC to a material one (continuance). Overall, the present study – conducted, as it was, during an unusual time in the organization’s history and a tumultuous period within the nation’s history – is very much an exploratory one.
METHOD
Context, participants and procedure
Data were collected from a unit of Empresas Polar employees in two waves, approximately 6 months apart. This unit was implementing a process of continuous improvement in its manufacturing and warehousing activities, based on the practices of its global partner, a leading multinational in the food and beverage sector based in the United States. Because of the external political events, and some internal issues regarding the leader in charge of the implementation of the process, no changes in activities or practices that could bolster the levels of commitment of the employees took place between the two waves of data collection. Thus, this context represented a unique opportunity to examine any changes in the commitment profiles of the employees under the pressure of external events.
Because the plant was unionized, union support for the study was secured. Subsequently, with the help of the HR department, and the random selection function associated with the organization’s database software, approximately one third of the employees in the unit (n=335 of 1008) were randomly selected and asked to participate in the research. Supervisors were instructed to release participating employees during their shifts to go to a training room where the questionnaires were administered. Surveys were distributed and collected by one of the researchers without involvement of company representatives. In order to match the cases between the two waves of data collection, employees were requested to provide the last three digits of their national identification number.
All 335 randomly chosen employees agreed to participate in the first survey. However, 22 surveys were discarded due to incomplete answers, leaving data from 313 employees (93% effective response rate). After 6 months, a general message was sent inviting those who had completed the first survey to complete another one. Although 209 employees responded, data from 57 were discarded either because of incomplete information or because inconsistencies with the last three digits of the ID number made matching impossible. Of the 152 participants for whom we had both sets of data, 88.9% were male, mean age was 30.3 years (SD=7.00), and mean organizational tenure was 3.07 years (SD=3.59). Levels of education completed were distributed as follows: junior high school (3.3%), high school (59.6%), and university/post graduate (37.1%).
Measures
To assess the three components of commitment, we administered Spanish-language versions of the Affective Commitment Scale, Continuance Commitment Scale and Normative Commitment Scale. Consistent with many commitment researchers, we opted for the 6-item versions of these scales (18 items in total; Meyer & Allen, Reference Laumer, Eckhardt, Maier and Weitzel1991). This instrument (Arciniega & González, Reference Arciniega and González2006) has been used in Latin America and Spain and has adequate psychometric properties. In this sample, the six internal consistency estimates (Cronbach’s α) ranged from 0.65 to 0.77 (mean=0.73; see Table 3). Of these, all but one (Continuance Commitment Scale; Wave 1) was <0.70 and the other five coefficients were similar to those reported in the study in which the Spanish version of the questionnaire was initially validated (Arciniega & González, Reference Arciniega and González2006). Information about employee age, tenure, education, and gender was also collected.
Analyses
First, in order to detect any potential bias, with respect to initial commitment levels, in the participation of those individuals who took part in both waves versus those who did so only at Wave 1, t-tests were conducted comparing the means for each of the three components of commitment. No differences in initial AC, NC, or CC scores were observed (p>.05), suggesting that any concern about bias in initial commitment is unfounded.
Second, as the external harassment of the firm could have changed employees’ interpretation of the commitment constructs, measurement equivalence of the three scales was assessed. Thus, independent confirmatory factor analyses were conducted with the data from both waves. Next, a sequence of multi-group confirmatory factor analyses with incremental restrictions were conducted (Vandenberg & Lance, Reference Vandenberg and Lance2000). Once measurement equivalence was confirmed, paired-sample t-tests were conducted on each of the three commitment measures.
We then proceeded to determine the commitment profiles observed at both waves. Although many commitment researchers have used variable-centered approaches (e.g., regression; SEM) to examine how commitment components combine, cogent arguments favoring the use of person-centered approaches (e.g., cluster analysis; latent profile analysis) in order to examine commitment profiles have been forwarded (e.g., Meyer, Stanley, & Vandenberg, Reference Meyer, Stanley and Parfyonova2013). In this study, we used two-step cluster analysis to determine the clusters in the samples at both waves. An algorithm is used to determine the number of clusters through an optimization process, as described below, following an exploratory approach, instead of fixing the number of clusters a priori. It is relevant to highlight at this point, that in contrast to some other methods used in the commitment profile literature to determine the number of clusters in the data, the two-step cluster analysis relies on an algorithm, rather than researcher judgment, to determine the number of clusters, thus reducing subjectivity.
RESULTS
Measurement equivalence
Confirmatory factor analyses were conducted to examine the fit of the construct structure of the three-component model of organizational commitment to the data from both waves. Although the maximum likelihood has been demonstrated to be robust to minor departures in normality (Chou & Bentler, Reference Chou and Bentler1995), the scaled χ2 S-B proposed by Satorra and Bentler (Reference Ryan, West and Carr1994) was used in this study as it has been shown to be a very well-behaved estimator across different levels of non-normality. At Wave 1, the three oblique factor structure obtained a good fit (χ2 S-B=271.03, df=132, CFI=0.904, RMSEA=0.084), the same happened at Wave 2 (χ2 S-B=217.96, df=132, CFI=0.922, RMSEA=0.066). Next, we examined measurement equivalence of the commitment measures across time.
Although numerous approaches have been used to evaluate measurement equivalence (cf. Hui & Triandis, 1985; Vandenberg & Lance, Reference Vandenberg and Lance2000), there is general agreement that the multi-group confirmatory factor analytic model (Joreskog, Reference Johns1971) is the most powerful and versatile technique. Based on this method, we conducted multi-group confirmatory factor analyses to test each of the seven conditions of invariance proposed by Vandenberg and Lance (Reference Vandenberg and Lance2000) with the purpose of demonstrating strict invariance between the two waves. If these constraints are validated, then it could be said the construct held the same meaning for the employees at both data collection waves.
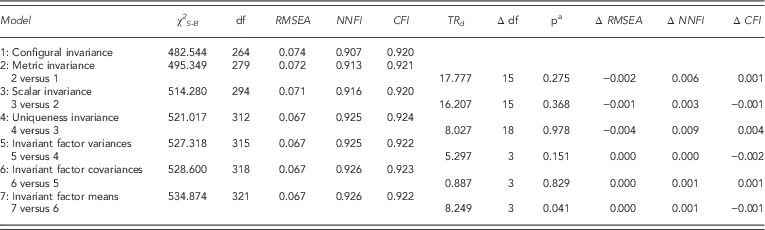
Table 2 presents results of the series of nested models of the invariance hierarchy, from the least restrictive model (i.e., the configural model, Model 1, positing only an equivalent factor structure across samples) to the most restrictive model of the hierarchy (i.e., Model 7), where the means of the latent constructs are constrained to be equivalent across groups. All indices suggest that both configural and metric invariance models (i.e., Models 1 and 2) provide adequate fit to the data. The very small change in the comparative fit index between Models 1 and 2, and the non-significance of the TRd, support the idea that the invariance constraints imposed by Model 2 over Model 1, did not significantly lessen the goodness-of-fit of the least restrictive model. A very similar pattern exists with the rest of the nested models (Models 3–7). In all cases, the variations for each pair of nested models are <0.01 for the comparative fit index, the root mean square error of approximation, and the non-normed fit index, supporting the inferences of measurement equivalence from the less restrictive model to the most constrained between the subjects in both data collection periods.
Summary of results for the sequence of measurement equivalence tests between the two waves

Note. χ2 S-B=Satorra–Bentler scaled χ2; CFI=comparative fit index; df=degrees of freedom; NNFI=non normed fit index; RMSEA=root mean square error of approximation; TRd=Satorra–Bentler scaled χ2 difference test.
p a value for the TRd with Δ df test.
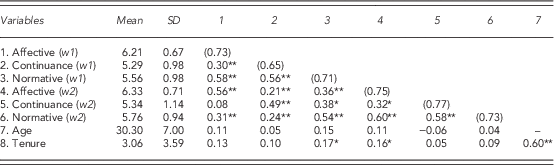
Given the level of measurement equivalence between the two waves, it appears that the constructs under study had the same meaning for the employees at both time points. Thus, for each of the three commitment measures, we compared scale means across the two data collection waves. Table 3 shows means, standard deviations, and correlation coefficients among all variables. Consistent with our speculations, we observed significant increases in both AC, Wave 1=6.21 and Wave 2=6.33 (t=−2.22, df=151, p=.028), and NC, Wave 1=5.56 and Wave 2=5.76 (t=−2.75, df=151, p=.007). No significant difference was found, however, for CC.
Means, standard deviations and intercorrelations among study variables

Notes. Cronbach’s α’s for each scale are reported on the diagonal. Commitment scores are based on a 7-point scale. Age and tenure are expressed in years.
w1=Wave 1, w2=Wave 2.
*p<.05, **p<.01.
Cluster analyses
To determine the number of clusters in both waves, the two-step auto-cluster procedure developed by SPSS was employed. This classification technique is designed to reveal the number of clusters within a data set. First, a sequential clustering approach scans the cases one-by-one, and determines, based on distance criteria, if each new case should merge with the previously formed clusters or start a new cluster. Second, a cluster method is conducted on the sub-clusters, generated in the previous step, to find the number of clusters based on an agglomerative hierarchical clustering approach. The algorithm utilized by this procedure, automatically computes the number of clusters through an optimization process. The number of clusters is determined by minimizing within-cluster variation, and maximizing between cluster variation (Everitt, Landau, & Leese, 2001; Kaufman & Rousseeuw, Reference Kam, Morin, Meyer and Topolnytsky2005).
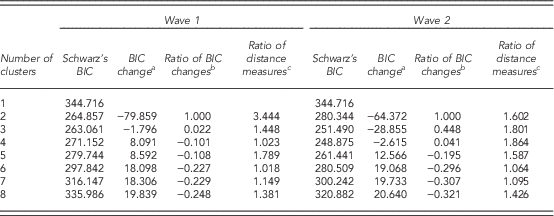
To examine the clusters at each wave, the score of each participant on the three commitment dimensions were used as the features (i.e., independent variables) in the analyses. At Wave 1, two large clusters emerged. Table 4 shows the results from the two-step cluster analyses for both waves. Usually, smaller values on the Bayesian Information Criterion (BIC) indicate better adjustment. However, there are clustering problems when the BIC continues to decrease as the number of clusters increases. In such situations, changes in the BIC and changes in the distance measure are evaluated to determine the best cluster solution. Then, the best solution will have the largest ratio of BIC changes and the largest ratio of distance measures. In Wave 1, BIC continued to decline from the two clusters to three clusters solutions. Examination of the ratio of BIC changes and the ratio of distance measures indicates that the improvement from two to three clusters does not worth the additional complexity. Both ratios reached their respective maximums with two clusters. Hence, the two clusters model was selected as the most appropriate model for Wave 1. The relative importance analysis, provided by the software, suggests that the NC scores were most influential in determining the clusters, followed by CC scores. In other words, NC was the variable with the lowest variance within the clusters, and at the same time, the one with the largest variability between them.
Summary of Schwarz’s Bayesian Information Criterion (BIC) diagnostics to determine the number of clusters at both waves

Notes.
a The changes are from the previous number of clusters in the table.
b The ratios of changes are relative to the change for the two cluster solution.
c The ratios of distance measures are based on the current number of clusters against the previous number of clusters.
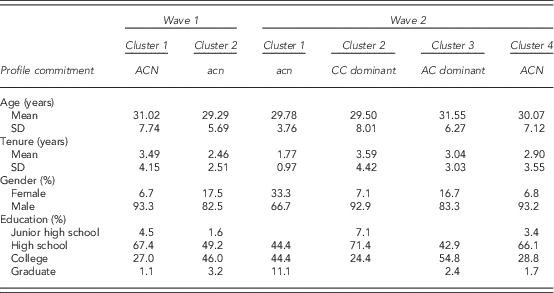
Cluster 1 consisted of 89 participants. Comparisons made between the means and distributions of the three commitment components in this cluster with those in the total sample at Wave 1, indicate that employees in this cluster had high means on all three commitment dimensions. Cluster 2 included 63 employees; in comparison with the total sample, employees in this cluster had lower scores on all three commitment dimensions. Thus, it appears that, prior to the events outlined in Table 1, employees at Empresas Polar showed only two commitment profiles: the fully committed profile, that is, high on the three dimensions (ACN), and the uncommitted profile, low in the three dimensions (acn). Table 5 shows the socio-demographic characteristics of the individuals grouped on each cluster at both waves. As can be seen, Cluster 2 at Wave 1 concentrates a higher proportion of employees with college education, than those at Cluster 1. It is also worth mentioning that the proportion of women in Cluster 2 is higher than in Cluster 1.
Socio-demographic characteristics of the individuals on each cluster at both waves.

Note. AC dominant=affective dominant; ACN=fully committed; acn=uncommitted; CC-dominant=continuance dominant.
From the data collected in Wave 2, four clusters emerged. This solution was chosen because it had the smallest BIC value (248.875), with relatively large ratios of BIC (0.041) and distance measure (1.864) change (see Table 4). Again, the variable with the highest influence on cluster formation was NC, followed by CC. Cluster 1 (n=9; ‘uncommitted’) was lower, on all three commitment components, than the total sample. Cluster 2 included 42 participants; this cluster could be classified as ‘CC-dominant.’ Cluster 3 included 42 employees and was classified as ‘AC-dominant.’ Finally, Cluster 4 included the largest number of employees (n=59) and based on its comparison with the total sample had the highest scores on all three commitment components (ACN), being classified as ‘fully committed.’ As can be seen in Table 5, Cluster 1 at Wave 2 is characterized by having the largest proportion of women and the employees with the lowest average in tenure. Regarding the employees grouped at Cluster 2, they are mainly employees with high school and with the highest mean concerning tenure. The main feature of the subjects in Cluster 3 is their level of education, 54.8% of them had attended College, and 2.4% had done postgraduate studies. The characteristics of individuals in Cluster 4 are very similar to the ones of Cluster 2, the only differences are a marginaly higher level of education and a lower mean in tenure.
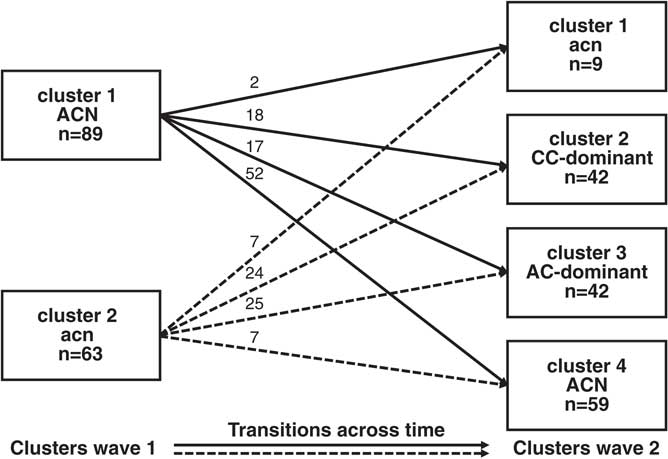
Figure 1 summarizes the results of the two-step cluster analyses in both waves. According to a recent review, the four profiles shown here have been the most commonly found in the literature, regardless of which statistical technique was utilized in determining them (Meyer et al., Reference Meyer, Stanley, Herscovitch and Topolnytsky2012).
The composition of the clusters at both waves, and the transitions across time. Note: Solid line arrows represent the transitions of employees from Cluster 1 at Wave 1, to the four clusters at Wave 2. Dotted line arrows represent the transitions of employees from Cluster 2 at Wave 1 to the four clusters at Wave 2. AC=affective dominant, ACN=fully committed, acn=non committed, CC=continuance-dominant

As can be seen in Figure 1, 52 of the 89 employees who were in the fully committed cluster (ACN) at Wave 1, maintained that profile, and only two out 89 moved to the uncommitted cluster (see solid line arrows at Figure 1). Regarding the 63 employees showing an uncommitted profile (acn) at Wave 1, only 7 maintained that profile at Wave 2, and 7 moved to the fully committed cluster (ACN) at Wave 2 (see dotted line arrows at Figure 1). Based on these results, we took a close look at the main transitions, that is, the employees who moved from the two clusters at Wave 1, to the new clusters that emerged at Wave 2: the CC-dominant and the AC-dominant. First, we focused on the individuals who were initially in the uncommitted cluster (acn) and who moved to the CC-dominant or AC-dominant clusters. Cluster 2 (‘uncommitted’ employees) at Wave 1 included 63 employees. Of these, at Wave 2 (see the two central dotted line arrows at Figure 1), 24 had moved to the CC-dominant cluster and 25 to the AC-dominant cluster. We used demographic data to examine what characterized those employees whose AC strengthened following the political events at the organization. χ2 analysis results show that the ‘uncommitted’ employees with higher education (college vs. high school) were more likely to develop an AC-dominant profile pattern at Wave 2 (χ2=5.50, df=1, p=.018). Results of t-tests suggest that tenure played little role in movements from Cluster 2 at Wave 1 to Clusters 2 and 3 at Wave 2, but that older employees were more likely (t=−3.24, p=.002) to move, after the challenging events, from the uncommitted cluster at Wave 1 to the AC-dominant cluster.
Regarding the employees who moved from the fully committed cluster (ACN) at Wave 1 to the AC-dominant cluster and the CC-dominant cluster (see the two central solid arrows at Figure 1), it seems that level of education also may have played a key role in the transitions. A χ2 test between level of education between the 18 employees who moved to the CC-dominant cluster and the 17 who clustered in the AC-dominant profile, revealed a marginally significant difference (χ 2 =6.44, df=3, p=.053) suggesting that more educated employees were characterized by an AC-dominant profile after the threat of nationalization of the company’s facilities. No significant differences were found for employee tenure or age.
DISCUSSION
Although a great deal of research attention has been paid to the organizational commitment construct, this is one of a very few studies examining external influences on employee work attitudes and, most certainly, the first organizational commitment study conducted against a backdrop of political conflict between organizational leaders and a national head of state. Three aspects of our findings seem particularly interesting and may add something to our understanding of how commitment is shaped and altered.
First, we found no evidence that employees’ CC for the organization was altered by the events described here. Possibly, the events were simply too complex, and in flux, to provide employees with a clear picture of how (or whether) the ‘costs’ associated with leaving the organization had changed.
Second, we find interesting the relative impact that the events we studied appear to have exerted on the other two commitment components. Research in the commitment literature (e.g., Meyer et al., Reference Meyer, Kam, Goldenberg and Bremner2002) generally suggests that AC and NC share many work experience correlates; usually, however, relations are more modest for NC than AC. Such was not the case in this study. Instead, although both AC and NC increased significantly during the 6-month period of the study, changes in NC were stronger. Why might this be the case? Although this is speculative, our data hint at the possibility that, in most organizational contexts that researchers examine, work experience effects on NC might be constrained by the modest content and/or range represented by the experiences that are typically studied – and by the nature of NC itself. Feelings of moral obligation toward a company may not develop or change easily. Indeed, particularly robust drivers of NC might only be those in which employees experience unusual ‘obligation-arousing’ events. Such work experiences may be rare in organizational settings. Further, when they do occur, they are likely to be idiosyncratic to individual employees and, thus, would not produce observable NC effects at the sample level. The events summarized in this study, however, were dramatic and were experienced broadly by all employees. We suggest that the attacks on Empresas Polar may have provoked something akin to moral outrage among employees (‘how dare you mess with my company!’). Further, it seems possible that, by standing up to the attackers as they did, senior management imbued employees with a strengthened sense of obligation to Empresas Polar (‘they did this for us!’). Taken together, this may have created a situation that is especially likely to provoke a stronger-than-usual increase in NC among employees.
Third, it appears that the nature and distribution of the commitment profiles changed over the time period that we studied. At Wave 1, the cluster analysis suggested that Empresas Polar employees tended not to differentiate, level-wise, among the three commitment components; employees were either high (ACN), or were low (acn), on all three components. As can be seen in Figure 1, by Wave 2 there was a considerable reduction in the number of uncommitted (acn) profiles and a more modest, but still sizeable reduction in the fully committed (ACN) profiles. Over half of the Wave 1 profiles, however, became more differentiated at Wave 2, suggesting that the events the employees experienced may have caused many to develop a more complex, or nuanced, understanding of their relationship toward the organization than they had before, such as the effect of psychological reactance. With respect to this, it is interesting– and perhaps not surprising – that, of the person variables we examined (age, tenure, gender, education), only education level was associated with the move to a differentiated profile. In a recent study, Kam et al. (Reference Kabins, Xu, Bergman, Berry and Wilson2016) examined the impact of a complex organizational initiative involving extensive operational and structural change over an 8-month period. Despite these changes, commitment profiles showed remarkable temporal stability, prompting the authors to speculate that dramatic events and/or those that pose an external threat might be more likely to alter the factors that underlie commitment profiles. The present study – which assesses commitment profile change in the face of dramatic external events – is the first study to provide evidence consistent with this intriguing possibility and, in so doing, makes an important contribution to the employee commitment literature.
Limitations, strengths, and potential implications
Like any empirical research, of course, this organizational study has both strengths and limitations. Although it represented 15.07% of the population of interest, we recognize that this is a small scale study, involving only two waves of data, that was conducted in one organization, and, quite clearly, without ‘control group’ employees. Further, we acknowledge the respondent attrition from Wave 1 to 2; as reported above, however, we note that no significant differences with respect to initial commitment were found among those who participated in only one versus both surveys. Finally, although we do not see this as a research limitation, per se, we certainly acknowledge that anything other than a conceptual replication of this particular study is highly unlikely!
On the positive side, we examined organizational commitment, across time, in a part of the world where the construct has received very little empirical attention. Moreover, the timing of our surveys afforded us a serendipitous opportunity to examine, and gain some insight from, the interplay among commitment constructs and dramatic organizational/political events. As such, our findings may have some implications for practitioners working in other sectors, or other areas of the world, that are subject to rapid or extensive changes in the external/distal environment and that may affect employees’ commitment. Such might be the case, for instance, in companies extracting or producing commodities (e.g., mining or oil sectors). If the price of a barrel of oil drops dramatically, as occurred between June 2014 and August 2015, or if the international price of silver shows a sustained decrement, as was the case between 2013 and 2016, it seems likely that the commitment profiles of employees working in those companies will be vulnerable to change. Robust changes in political landscapes within a region, or country, may also provoke such effects. Further, how these external changes will play out with respect to employee commitment profiles may well depend on management reactions to the external changes, and – importantly – employee perceptions of these reactions. For all these reasons, human resource management professionals operating in such sectors, or regions, would be well advised to conduct regular ‘commitment audits’ (Allen, Reference Allen2010) of their employees, examine potential challenges associated with the observed commitment profiles, and, based on the extensive commitment profile literature consider taking steps to address these challenges.
Acknowledgements
The participation of the first author in this project was supported by the Asociación Mexicana de Cultura A.C. The second author was supported by the Social Sciences & Humanities Research Council of Canada (410-2007-0742). This manuscript is an original work that has not been submitted to nor published anywhere else.