I. INTRODUCTION
Over the past two decades, various synthetic approaches have been reported to synthesize colloidal CdSeReference Newton, Ramaswamy, Mandal, Joshi, Kumbhar and Sardar1 nanocrystals (NCs) namely, sonochemical,Reference Murcia, Shaw, Woodruff, Naumann, Young and Long2 hydrothermal,Reference Luan, Yang, Fan and Tu3 radiolysis,Reference Williams, Adams, Kotov and Savage4 and microfluidic routes.Reference Kang, Chang, Dai and Chen5 Most of these methods lead to satisfactory production of high quality NCs possessing very narrow size distribution and high quantum yields. With a priority to avoid the toxic effect of the cadmium precursor,Reference Williams, Adams, Kotov and Savage4 a nonorganometallic precursor of cadmium has been presently used in a very simple setup that can be scaled up to produce CdSe colloidal nanocrystals of good morphology and high optical property. To obtain a better understanding of the relative importance of the solvent used during synthesis and its effect on the structural and optical properties of the CdSe NCs, the prepared NCs have been extracted in three different polar solvents namely ethanol, DMF, and acetonitrile.
The characterization of the obtained NCs which exhibit size-dependent optical property provides a convenient means for fundamental research on the intrinsic effects in the nanoregime and facilitates the monitoring of the growth process of small particle clusters. Since nanocrystals lie in the transition region between molecular species and bulk materials, understanding their growth kinetics becomes very important to interpret their properties. The optoelectronic properties deduced by observations of UV-visible and photoluminescence (PL) spectra have been used to study the important parameters necessary for evolution of the quality of CdSe NCs like particle size, size disparity, and concentration of NCs along with the growth kinetics.
NCs are zero-dimension structures, and minute factors like the nature of the solvent being used for extraction can have significant effect on its optoelectronic properties. There exists a strong relationship between crystallite size and the optical absorption spectra. Changes in the optical gap or absorbance onset of a semiconductor material as a function of the particle size occur due to quantum confinement effects.Reference Efros and Efros6–Reference Alivisatos9 Hence, quantum confinement has a key role in the determination of the size-dependent properties of semiconductor nanocrystals. There are two important effects associated with quantum confinement and the first one is the size-dependent band gap of the nanocrystals, as mentioned above. The well known size-dependent transmission and emission colors of semiconductor nanocrystals are the direct results of this effect. As the particle size decreases and becomes comparable to either the de Broglie wave length or the excitonic Bohr radius (rB), spatial confinement of the charge carriers occurs. This confinement leads to quantization of energy levels and the formation of discrete states. Distinct peaks corresponding to transitions from the valence band to discrete states in the conduction band appear in the absorption spectrum. However, the second major effect, the size-dependent extinction coefficient, evaluated experimentally gives accessibility to the desired quality of nanocrystal samples and aids in the determination of the concentration of nanocrystals in solution.
PL is an important parameter for NCs, and drastic changes were observed in PL spectra with a change in the solvent being used for extraction. PL demonstrates the important role of states in the nanocrystal energy band gap associated with the surface and/or defects. The PL spectrum of CdSe QDs may be composed of three bands: the high energy band (band-edge emission) that can be explained by different recombination mechanisms, such as recombination of the delocalized electron–hole (e–h) pairs or recombination through localized states, possibly of surface origin; the low energy band in the near-IR spectral range, which originates from donor–acceptor recombination involving deep defect states associated with vacanciesReference Babentsov, Riegler, Schneider, Ehlert, Nann and Fiederle10 and; additional emission peaks of much lower intensity (and at higher energy) attributed to the radiative recombination of an electron in a p state with a hole in a p state of photogenerated carriers.Reference Troparevsky and Franceschetti11
Further, the effect and role of the solvent to disturb the surface morphology of CdSe with aging were studied to analyze and conclude for a stable solvent for the isolation of the so-prepared CdSe. The stability of the NC surface at any given moment of time depends on the rates at which matter adheres to the surface or leaves it, and this depends on the passivation of surface atoms. The paper reports the structural characterization of NCs by different techniques to demonstrate the surface composition, surface ligand coverage, nanosurface structure, including interior interfaces of synthesized CdSe dots extracted and how these parameters vary with precipitating solvents.
The comparative precipitation efficacy of different solvents demonstrated in this paper is new of its kind and important to select a precipitating solvent, more so in the pilot scale synthesis.
II. MATERIALS AND METHODS
A. Materials
Cadmium oxide (CdO, Aldrich), trioctyl phosphine (TOP, Fluka, Germany), trioctyl phosphine oxide (TOPO, Sigma Aldrich, Germany), tetradecyl phosphonic Acid (TDPA, Alfa Aesar, Ward Hill, MA), selenium powder (Se, Aldrich), and the solvents acetonitrile, N,N-dimethyl formamide and ethanol from Merck Emplura (Germany) were used without any further purification.
B. Synthesis
The synthesis of CdSe NCs were done through a simple setupReference Lopez-Luke, Wolcott, Xu, Chen, Wen, Li, De La Rosa and Zhang12,Reference Kongkanand, Tvrdy, Takechi, Kuno and Kamat13 with a high purity of 99.9999% of nitrogen gas being allowed to flow into a 3-necked flask before the start of the experiment. A mixture of 1.1-mM TDPA and 4 g of TOPO were heated to dissolution followed by the addition of 0.039-mM CdO. The reaction temperature was raised to 300 °C and cooled gradually to 270 °C. Se-TOP, which was prepared by adding 0.26-g Se powder in 4.25-mL TOP under nitrogen flow (being stirred for 1 h), was injected at once into the 3-necked flask containing CdO precursor. The reaction temperature drops to 270 °C. It was further increased to 280 °C, and the growth was quenched in toluene by withdrawing various NCs at an interval of every 20 s. As the paper involves postpreparative treatment, a more detailed procedure is given. Aliquots (1 mL) of crude solution were concentrated by a factor of 3 and the corresponding solvent namely ethanol/DMF/acetonitrile was added until the solution becomes slightly turbid. The precipitate was isolated by centrifugation and resuspended in toluene. The method of extraction was repeated twice to obtain QD-1, QD-2, and QD-3, respectively and was subjected for further studies. Extraction of QD-1 required three times the solvent quantity unlike QD-2 and QD-3.
C. Characterization
Fine NC powders were prepared by repetitive precipitation followed by extraction, with different solvents and drying. An analogue vortex mixer was used to enhance the extraction efficiency. The prepared powders were characterized for phase identification using x-ray diffraction (XRD) patterns recorded by a Shimadzu x-ray diffractometer 7000 with Cu Kα radiation at a scan rate of 1°/min. The crystallite size and the lattice parameters were determined by Scherrer's equation, where crystallite size = Kλ/βcosθ, β = broadening of the diffraction line measured at half maximum intensity; λ = wave length of the x-ray radiation; θ = Bragg angle; and K ≅ 0.89 for spherical particles. An energy dispersive x-ray (EDX) analyzer was used in conjugation with field emission scanning electron microscope (FESEM) (Carl Ziess, Germany) to detect the elements and surface morphology. NCs lost their structure when subjected to high energy beam and hence were gold coated for detection of islands in QD-3 in FESEM micrographs. Absorption and emission spectra were recorded using the Shimadzu UV-1800 PC spectrophotometer and Shimadzu RF 5301 PC spectrofluorophotometer (Japan), respectively, where 200 μL of CdSe was suspended in 3 mL of toluene for recording the spectra. Atomic force micrographs (AFM) were recorded using APE Research, model F 80 AFM with SPM data analysis software. Samples for transmission electron microscopy (TEM) were prepared by dropping dilute solution of nanocrystals onto 400-mesh carbon-coated grids followed by solvent evaporation and analysis by a Phillips10 transmission electron microscope (Netherlands).
III. RESULT AND DISCUSSION
The formation of CdSe nanocrystals extracted in different solvents was monitored by UV-visible absorption spectroscopy as depicted in Fig. 1. The continuous red shift of the absorbance with time indicates the consecutive growth of NCs, and there is systematically a large shift of absorbance edge of NCs toward longer wave length, with increase in particle size. Extracting order of NCs in different solvents did not have any significant effect on absorption spectra except for an increase in absorption with aging. The band gap of CdSe NCs remains unchanged indicating the retention of the nature of NCs in all the solvents and even on aging. The “Y” parameter is kept constant throughout the plots in Fig. 1 for accurate comparison.
An absorbance and PL spectra of NCs extracted in different solvents: (i) ethanol; (ii) DMF; and (iii) acetonitrile; (a) 0 days, (b) 7 days, and (c) 14 days.

The PL spectra gave some important indications. The PL spectra in the inset of Fig. 1 analyzed without aging (plot “a”) for the NCs extracted in three different solvents, depicted a very narrow size distribution and high crystallinity. The main emission peak at 2.24 eV and weak emission at 1.77 eV are ascribed to the emission of ground state exciton and deep level emission, respectively.Reference Babentsov, Riegler, Schneider, Ehlert, Nann and Fiederle10 The deep level emission arises not from impurity but from the intense lattice defect associated with vacancies, due to much greater surface to volume ratio in NCs. This emission does not change with crystallite size unlike the excitonic emission. The high energy emission at 2.79 eV observed only in ethanol and acetonitrile extracted immediately after 20 s of attaining growth temperature indicates the presence of interface state in these less stable NCs (at very early stages of growth) which undergo radiative recombination of photogenerated carriers.Reference Vega Macotela, Torchynska, Douda, Pena Sierra and Shcherbyna14 With aging, excitonic emission is strongly quenched unlike the deep level luminescence. The quenching of excitonic emission with aging can be due to slow aggregation, ligand dissolution, or slow surface oxidation. NCs must have suffered gradual oxidation during the period of storage. So, most of the excited hole relax nonradiatively at surface states. Aging does strongly affect PL intensity in all the three QDs suggesting the need for further stabilization such as capping to avoid the leaching of core QDs. The capping and the material study thereof shall be communicated as a set of new study in the coming issue. The extent of radiative recombination increases proportionately with aging in all the NCs.Reference Murray, Norris and Bawendi15 The disturbance in surface morphology with aging due to increased interface states can cause enhanced radiative recombination in NCs extracted from higher polar solvents. The mechanism of enhanced passivation of NCs within less-polar molecular containers as shown in Scheme 1 (polarity order, acetonitrile > DMF > ethanol) during extraction can avoid interface states unlike more polar molecules that cause enhanced radiative recombination giving rise to high energy PL peaks.
Schematic representation of the mechanism of passivated QDs within less-polar molecular containers.
The mean particle size (D) is correlated with the position of the exciton peak in the above ensemble absorption spectraReference William Yu, Qu, Guo and Peng16 as per D = (16,122 × 10−9)λ4 − (2.6575 × 10⁻⁶)λ3 + (1624 × 10−3)λ2 − (0.4277)λ + 41.57, ΔE is the transition energy in eV and corresponds to 1st absorption peak, and λ (nm) is the wave length of the first excitonic absorption peak of the corresponding samples. The concentration of NCs are obtained from the ratio of absorption to extinction coefficient (e) per mole of CdSe NCs synthesized, where “e” represents the fitting curve of the experimental data using a function similar to the equation e = 1600 ΔE (D)3 as per the literatureReference William Yu, Qu, Guo and Peng16 but with a different proportionality constant and a constant path length of radiation used for recording the spectra. The concentration of NCs as observed in Fig. 2 remains constant upto 40 s and then decreases drastically within 20 s and almost remains constant beyond 60 s. It can be stated that upto 40 s, the NCs are in the nucleation phase and beyond 60 s, they exhibit the growth phase.Reference van Embden and Mulvaney17 The linear decrease in concentration and increase in the particle size up to 60 s can be attributed to the dissolution of CdSe during growth.Reference William Yu, Qu, Guo and Peng16 If it is carefully observed, QD-3 has the highest concentration before 60 s and the lesser concentration beyond 60 s. More polarity of acetonitrile allows extraction of higher concentration of smaller NCs. With regard to aging, in general, the concentrations of all the NCs increase by a percent of 6–7 with an aging of 7 days and by 16–17 with an aging of 14 days, with the least being the QD-3 concentration on aging.
Concentration of NCs extracted in diverse solvents as a function of time during growth.
Figure 3 substantiates linear growth of particles upto a size of 2.7 nm and an exponential growth beyond 2.8 nm, being very much typical to any of the quantum dot behavior. The plots in general depict a decrease in particle size with aging, and it is more pronounced in particles extracted in the growth phase (bigger sized) and in QD-1. More clearly from the inset (indicated by arrows), it can be inferred that the bigger-sized particles in QD-3 undergo rapid Ostwald ripening on aging.Reference Merz, Lee and Furdyna18 Ripening is a process where small sized dots are consumed by larger dots. The mechanism of Ostwald ripening leads to a decrease in the concentration of NC with an increase in particle size.Reference Peng, Wickham and Alivistatos19 DMF appears to be optimum with respect to concentration and sizes of NCs. Therefore, factors like aggregation, ripening, and oxidation become important with polarity.
Particle size of NCs extracted in diverse solvents as a function of time during growth.
The fluorescence wave length is directly correlated with the particle size as dictated by the quantum confinement; a broad full width half maximum (FWHM) indicates a broad distribution of particle sizes. The monodispersity plot in Fig. 4 implies that aging and growth time affect the size distribution in all the three NCs. When there is a high monomer concentration, as in the initial nucleation phase, the size distribution focuses and once the monomer concentration is depleted, the size distribution defocuses, increasing the FWHM.Reference Murray, Kagan and Bawendi20 The monodispersity of aged NCs extracted in ethanol showed better monodispersity among all its aliquots. It suggests the importance of hydrophobic interaction to avoid surface defects and increase stability. The higher and steady monodispersity in aged QD-1 was an important parameter to indicate the high quality of NCs that existed even after 14 days of aging.
FWHM of the emission spectra of NCs extracted in diverse solvents as a function of time during growth.
Applications such as solar cells wherein QDs were used as sensitizers to absorb visible light and induce electrons into the wide band gap semiconductor require good size distribution with specific small sizes of NCs and the ethanol extracted NCs were observed to suit this application better. DMF which yields NCs with lesser interfacial defects (and lesser radiative recombinations) could be preferred to applications such as bioimaging wherein the fluorescence of NCs was exploited to act as fluorescent tags to biomolecules.
A. Structural analysis
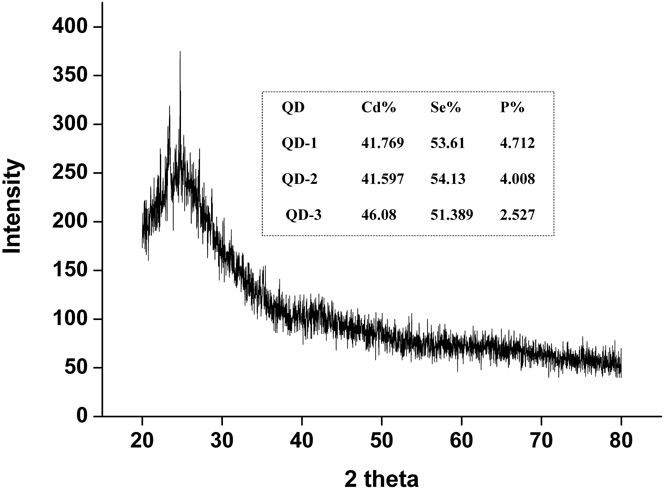
The unaged NCs (all three) at a growth time of 40 s were used for characterization. The XRD patterns obtained for all three QD-1, 2, and 3 powders showed no difference and are as displayed in Fig. 5. Peaks at 2θ = 25, 42.1, and 49.5° can be attributed to (002), (110), and (112) CdSe planes, which are consistent with the characterized peaks of wurtzite CdSe.Reference Jasieniak, Bullen, van Embden and Mulvaney21 Both the d-spacing and the intensities were identical to the theoretical values of 100% wurtzite phase of CdSe [JCPDS 65-3436]. The crystallite size of NCs was calculated using Scherrer's equation and was found to be 1.2 nm, with the lattice parameters a = 4.06 Å and c = 7.19 Å (in agreement with the wurtzite structure). EDX analysis depicted in the inset of Fig. 5 gives the atomic weight percent of Cd, Se, and P. The passivation of NCs by phosphonic acid derivative is discussed elsewhereReference Lee, Whitley, Meulenberg, Wolcott, Zhang, Prendergast, Lovingood, Strouse, Ogitsu, Schwegler, Terminello and van Buuren22,Reference Li and Peng23 The ratio of Cd:Se:P in QD-3 being least with ‘P’ as in 0.9:1:0.05, indicates that a large number of nanocrystal surface atoms are being unpassivated as compared to QD-1 of ratio 0.8:1:0.09. Acetonitrile is more capable of solvating the unreacted cations (Cd), which may have resulted in excess Cd as seen from EDX analysis. The unpassivated sites are more accessible to Cd and Se present in the reaction mixture, which may increase the tendency to form islands in QD-3. Hence, it can be correlated with the Ostwald ripening and arise of interface states in QD-3.
XRD pattern for CdSe QDs 1–3; inset: EDX composition of CdSe in atomic weight percent extracted in different solvents.
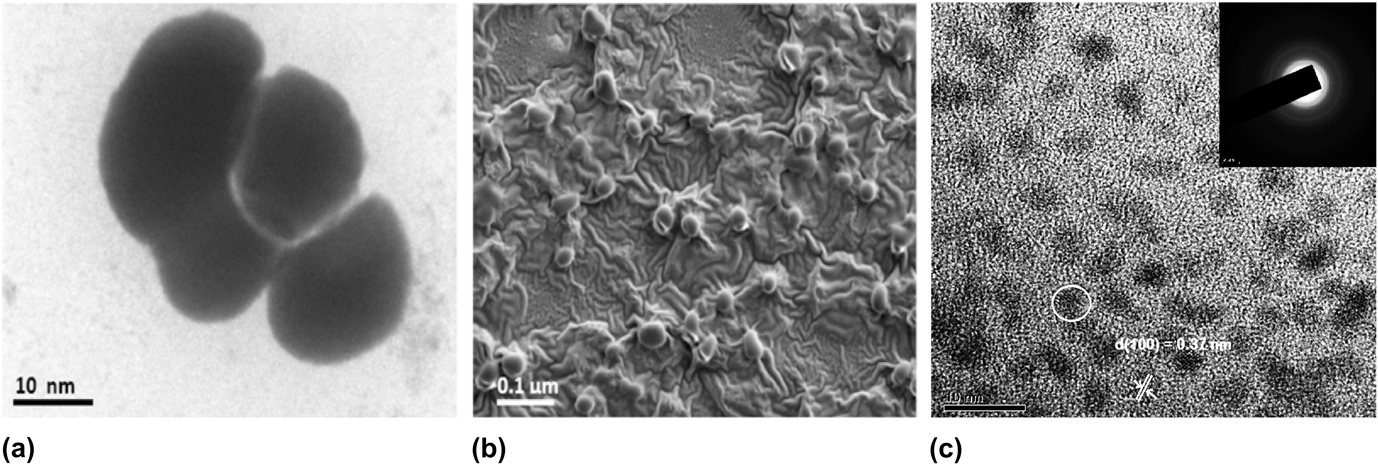
Figure 6(c) represents the HRTEM image of CdSe nanoparticles extracted in ethanol before any aging, in which well-resolved lattice fringes could be found. The particles tend to lie with their major (0001) facet parallel to the support film, with an interplanar spacing of 0.37 nm for hexagonal CdSe (100) planes. It depicts fairly spherical dots of CdSe NCs with a diameter averaging between 3 and 5 nm for the unaged samples. Figures 6(a) and 6(b) give the substantial morphology of the island formation in QD-3 for acetonitrile-extracted QDs with significantly big islands (with tendency of aggregation), spotted in the TEM and FESEM micrographs respectively for the aged samples.
(a) TEM and (b) FESEM micrographs of QD-3 after 14 days and (c) HRTEM image, depicting the d-spacing of CdSe NCs extracted in ethanol before aging; inset: the corresponding SAED pattern.
Figure 7 represents the micrographs taken as face images of AFM tapping mode. The inset in “a” indicates spontaneous formation of circular CdSe structures with a typical diameter of several micrometer in acetonitrile-extracted NCs with aging. The density of the distributed NCs obtained by deposition of 200 μL of CdSe is about 60 dots per 400 μm2 in QD-3 with an island height of 0.12 μm as shown in image “a” of Fig. 7. Ethanol extracted NCs are highly dense with small sizes (≅25 nm) of NCs as shown in Fig. 7b. The phenomenon of Ostwald ripening may have been driven by interfacial energies offered by polar solvents during extraction.Reference Kongkanand, Tvrdy, Takechi, Kuno and Kamat13 Higher unpassivation in acetonitrile-extracted QDs contributes to island formation with the dots evolving both in diameter and height proportionately.Reference Lee, Whitley, Meulenberg, Wolcott, Zhang, Prendergast, Lovingood, Strouse, Ogitsu, Schwegler, Terminello and van Buuren22 Acetonitrile although is more capable of precipitating higher concentration of small-sized NCs, the NCs were more prone to lesser passivation, to possess higher interfacial energies, to undergo Ostwald ripening, to the arise of interface states, and to form islands of NCs, which may be regarded as the adverse effects of the higher polarity existing in acetonitrile.
AFM images of (a) QD-3 after 14 days depicting the islands; inset: 1D view and (b) QD-1 distribution without aging.
IV. CONCLUSION
Combination of XRD, TEM, SEM, EDX, UV-Vis, and PL techniques demonstrated the presence of high-quality QDs with good optical properties and surface composition from the synthesis method used. The study gains significance in providing an insight into the observable differences existing in the optoelectronic properties, surface morphology, and the topology of the same NCs extracted in different solvents. Polarity of solvents influences the concentration of NCs extracted, particle sizes, monodispersity, surface passivation, and surface states. Studies on aging substantiated the adverse effects of acetonitrile to extract lesser surface-passivated NCs leading to Ostwald ripening and island formation.
ACKNOWLEDGMENTS
The author acknowledges MNRE, India, for financial support and Jain University for providing the facility to carry out the research work.