Implementing a successful hand hygiene program requires reliable data on performance rates to catalyze and direct improvement efforts. The method of tracking hand hygiene compliance, however, can greatly affect perceived hand hygiene adherence and, thus, the urgency and impetus for change. Reference McLaws and Kwok1 Many hand hygiene programs rely upon a small number of infection preventionists and quality improvement personnel to conduct surveillance. The reliability of these observations has been questioned, though, because observers are often known to frontline staff, tend to perform most of their observations on weekdays during day shifts, and are only able to complete a limited number of observations per month. In addition, tasking dedicated staff alone with surveillance may decrease frontline providers’ sense of ownership and responsibility for hand hygiene performance. Consequently, some hospitals have transitioned to mass observation programs that emphasize collective ownership and responsibility for both observations and performance amongst all healthcare providers. Reference Sickbert-Bennett, DiBiase, Schade Willis, Wolak, Weber and Rutala2–Reference Talbot, Johnson and Fergus4 This approach leads to large increases in observations but still allows for the possibility of residual biases including the Hawthorne effect, selection bias, and confounding. Reference Jeanes, Coen, Gould and Drey5 In particular, frontline workers may be more likely to mark peers as compliant compared to workers from other professional groups. We sought to characterize hand hygiene compliance among professional groups depending on whether observations were conducted by members of their own professional group versus members of other professional groups.
Methods
Brigham and Women’s Hospital (BWH) is an 803-bed acute-care hospital in Boston, Massachusetts. Our hand hygiene program includes the inpatient, emergency, and perioperative areas of the hospital and tasks healthcare workers within each area with monitoring hand hygiene for their peers and other professions. Each department is given a target number of observations to perform each month and a compliance goal to meet. Departments are encouraged to assign all members of the department to conduct a minimum number of observations. All hospital staff are required to take an online training program that includes guidance to only record observations if they were able to directly observe the entire opportunity and how to grade specific scenarios such as a staff member carrying items into or out of a room or assisting a patient to leave or enter their room. Compliance and observation data are continually displayed on a dashboard viewable to all employees and are regularly reviewed in hospital-wide safety huddles in order to incentivize both staff and department leaders to sustain high compliance and observation numbers.
We conducted an analysis of hand hygiene compliance data collected by frontline healthcare workers and ancillary staff between January 1, 2019, and December 31, 2019. Observations were recorded using SpeedyAudit smartphone or web-based applications (HandyMetrics, Toronto, ON, Canada). All auditors were required to complete an online training module on how to perform hand hygiene observations including criteria for eligible observations, the proper use of the data collection applications, and tips on how to maintain anonymity during observations.
Performance rates were calculated as the number of compliant hand hygiene episodes divided by the total number of hand hygiene opportunities. We defined hand hygiene opportunities as entering and exiting a patient’s room. If hand hygiene was the first thing someone did when entering a patient’s room or the last thing they did on exiting a patient’s room, we considered this compliant. Observers recorded the location and profession of the staff that they observed, as well as whether they washed their hands or missed the hand hygiene opportunity.
Compliance data were sorted by ancillary and nonancillary groups and then stratified by profession. The ancillary group included central transport, environmental services, food services, pharmacy, phlebotomy, rehabilitation services (physical therapy, occupational therapy and speech therapy), and respiratory therapy. The nonancillary staff included physicians, nurses, nurse practitioners, physician assistants, and patient-care assistants (including emergency room and operating room assistants). We compared HH performance rates within each professional group by whether the observations were performed by members of the same versus different professional groups. Compliance rates were compared using χ2 tests calculated using OpenEpi open-access software (version 3.01).
Results
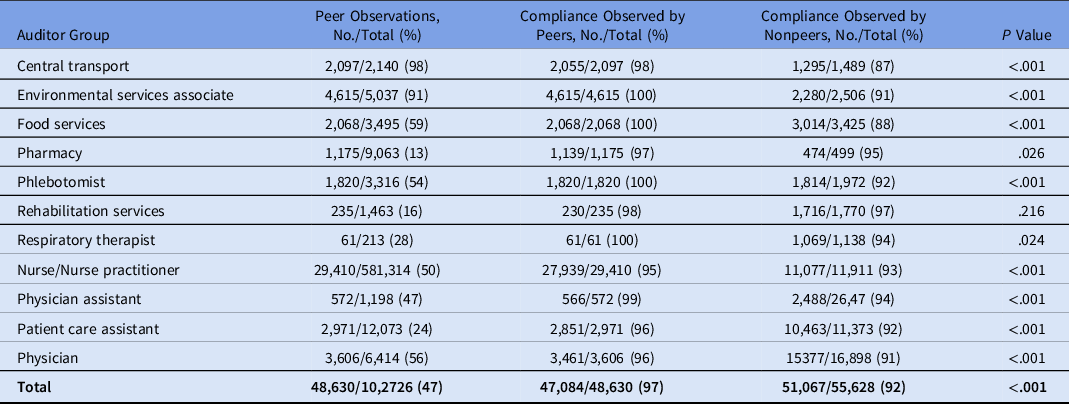
During the 1-year study period, there were 102,726 observations: 24,727 recorded by ancillary staff and 77,999 recorded by nonancillary staff. Of the 24,727 ancillary observations 12,071 (48%) were peer observations; of the 77,999 nonancillary observations, 36,559 (47%) were peer observations (Table 1). The percentage of peer versus nonpeer observations varied by profession. Amongst central transport workers, for example, this percentage was 98% for peers and 2% for nonpeers; for pharmacists, this percentage was 13% for peers and 87% for nonpeers.
Peer Observation Rates and Compliance Rates for Peer and Nonpeer Observations

The overall hand hygiene compliance rate was 94%. Compliance rates differed between peer versus nonpeer observations of the same profession. Central transport workers, for example, reported the compliance of their own group to be 98%, whereas members of other groups reported the compliance of central transport workers to be 87% (P ≤ .001). Similar differences were detected for food service workers (100% vs 88%; P ≤ .001), respiratory therapists (100% vs 94%; P = 0.023), doctors (96% vs 91%; P ≤ .001), nurses (95% vs 93%, P ≤ .001), and others. The profession with the most comparable compliance rates was rehabilitation services (98% vs 97%; P = .22).
Discussion
Hand hygiene programs require credible performance data to monitor progress and to identify areas for improvement. Acquiring valid performance data, however, can be very challenging. We found that most groups reported higher compliance rates for members of their own group versus nonpeers’ observations of their performance. These differences were most marked among members of ancillary groups. We further found that some groups were much more likely to monitor their peers rather than nonpeers, another potential source of bias.
Many strategies have been proposed to mitigate observational biases in hand hygiene programs including electronic monitoring systems, weighting observations differently depending on observer credentials, and performing independent data validation exercises. Electronic monitoring may decrease observational biases, such as the Hawthorne effect, but they are expensive to implement, they require workers to carry an electronic tab, they can elicit privacy concerns, and sometimes they make systematic errors that undermine confidence in their reports. Reference McLaws and Kwok1 Duplicate monitoring and independent audits are alternative strategies to assess the reliability of manual observations and foster quality improvement. Our study suggests a further strategy for increasing the reliability of hand hygiene observations, namely differentiating between observations of peers versus nonpeers and either relying on nonpeer estimates alone to track hand hygiene rates or weighting peer versus nonpeer observations differently. We also suggest encouraging hand hygiene observers to focus on recording hand hygiene events among nonpeers either exclusively or as a minimum percentage of observations and to record all observed hand hygiene opportunities regardless of whether compliant or noncompliant.
Incorporating more education into hand hygiene programs may help decrease variation in observations. Educational efforts should emphasize the need to record hand hygiene events among nonpeers as well as peers and the importance of recording all observed hand hygiene opportunities regardless of whether they are compliant or noncompliant.
Limitations of our study include the lack of an independent gold standard to corroborate whether peer or nonpeer observations were more accurate and lack of qualitative interviews to try to discern reasons for differences in peer versus nonpeer observations.
In sum, we detected significant differences between professional groups’ audits of their own hand hygiene performance and estimates of their performance made by other groups. Hospitals should consider strategies to mitigate biases in hand hygiene observations including increasing the frequency of data validation exercises, switching to electronic monitoring systems, or differentiating between peer versus nonpeer observations.
Acknowledgments
None
Financial support
No financial support was provided relevant to this article.
Conflicts of interest
All authors report no conflicts of interest relevant to this article.