I. INTRODUCTION
Nanosized titanium dioxide has been intensively investigated by experiments and computer simulations for its technological importance.Reference Schneider1 Ye et al.Reference Ye, Sha, Jiao and Zhang2 analyzed the characteristics of nanocrystalline brookite-based TiO2, using thermodifferential and x-ray diffraction techniques. Petkov et al.Reference Petkov, Holzhuter, Tronge, Gerber and Himmel3 did electron microscopy of nanophase amorphous-layered TiO2 produced by sputtering and sol–gel dip coating methods. Zhang et al.Reference Zhang, Chen, Banfield and Waychunas4 measured micro-Raman spectra of nanosized TiO2 powder prepared by vapor hydrolysis. Ahonen et al.Reference Ahonen, Kauppinen, Joubert, Deschanvres and Tendeloo5 observed that anatase synthesized in air transformed to rutile at 973 K, whereas anatase synthesized in nitrogen persisted up to 1173 K, and phase transformation is also affected by the interface nucleation and the presence of impurities.Reference Okada, Yamamoto, Kameshima and Yasumori6–Reference Yang, Mei and Ferreira8
Wang et al.Reference Wang, Deng and Li9 and Nakade et al.Reference Nakade, Matsuda, Kambe, Saito, Kitamura, Sakata, Wada, Mori and Yanagida10 synthesized rutile and anatase TiO2 by chemical solution method, and Wu et al.Reference Wu, Lin, Chen, Wang, He, Feng and Xu11 did sol-hydrothermal synthesis to produce nanoparticles of TiO2. Aruna et al.Reference Aruna, Tirosh and Zaban12 and Zhang and BanfieldReference Zhang and Banfield13 produced rutile titania particles by autoclaving process. Ranade et al.Reference Rande, Navrotsky, Zhang, Banfield, Elder, Zaban, Borse, Kulkarni, Doran and Whitfield14 studied energetics of nanocrystalline TiO2 prepared by mixing the solutions of TiCl3 and NH4OH, whereas Wei et al.Reference Wei, Skomski, Balamurugan, Sun, Ducharme and Sellmyer15 studied magnetism of TiO and TiO2 nanoclusters prepared by oxidation of Ti clusters. These experimental findings suggest that nanosized TiO2 can exist in anatase, rutile, and brookite structures and these become amorphous below 673 K.Reference Zhang, Chen, Banfield and Waychunas4, Reference Ahonen, Kauppinen, Joubert, Deschanvres and Tendeloo5 The exhibited refractive indices, chemical and photochemical reactivities also depend upon the fabrication conditions, heat treatment, and size of the nanoparticles as the atomic network in differently prepared samples may not be the same.
Molecular dynamics (MD) simulations have also been carried out using Matsui and AkaogiReference Matsui and Akaogi16 (MA) force field to study collision and fusion processes.Reference Collins, Smith, Harrison and Forester17 The temperature-dependent thermodynamical propertiesReference Naicker, Cummings, Zhang and Banfield18, Reference Filyukov, Brodskaya, Piotrovskaya and de Leeuw19 of crystalline TiO2 nanoparticles and sintering in rutile and anatase nanoparticles are also investigated.Reference Koparde and Cummings20 Hoang et al.Reference Hoang, Zung and Trong21 used MA potential to study size-dependent structural properties at 350 K and pressure-induced structural transitions in amorphous phase TiO2.Reference Hoang22 HoangReference Hoang23 also studied glass transition and thermodynamics of liquid and amorphous TiO2, whereas Vinh et al.Reference Vinh, Quan, Hiep, Hong, Nhan and Hung24 studied the density-dependent structure of amorphous TiO2 using variable charge potential.Reference Rino and Studart25 However in these investigations the spatial confinement is not accounted for.
In general, the atomic distribution in the amorphous phase nanoparticles depends upon spatial confinement (i.e., shape factor) and intrinsic geometry of the atomic network.Reference Lei, de Graff, Thorpe, Wells and Sartbaeva26 Therefore, structural properties of differently prepared samples may be different and the atomic network in the different regions of the same sample may also be different. In view of this it is important to generate structural models of amorphous phase nanoparticles of TiO2, and to investigate the structural properties taking into account the spatial confinement and to compare the results with the experimental data.
Here, we generated three samples of TiO2 of 3-nm size through different heating and quenching rates. The pair correlation functions, bond lengths, coordination numbers (CNs), bond angles, and dihedral angles are calculated. The correlations are found significant up to 10 Å and these vanish at the particle size. The overcoordinated Ti and O atoms are found in the core regions, 6- and 3-fold coordinated Ti and O atoms are found in the central parts, and undercoordinated Ti and O atoms are in the vicinity of the surfaces. The calculated averaged bond lengths for short-range interparticle correlations agree with the experimental results and earlier calculations. The bond angles and dihedral angles get distributed over complete range in the amorphous phase and the closer strained atomic network is predicted. The relative variance in the strain parameters in three samples is within 4%.
II. COMPUTATION AND SAMPLES PREPARATION
We generated rutile nanoparticles using MA force field:

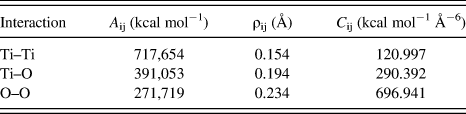
The first term in Eq. (1) is Born–Meyer repulsive potential, second term is dipole–dipole interaction, and third term is Coulombic interaction between ions. Here, r ij is the distance between ions i and j, A ij and C ij are the strength parameters of repulsive and attractive dipole–dipole interactions, respectively, and ρ ij is critical screening length. These parameters are given in Table I. The fractional charges q i of Ti and O ions are +2.196 and −1.098 e, respectively. Here, the ions are assumed as rigid spheres and three-body interactions are not accounted for.
Interaction parameters of Eq. (1).

MD simulations are carried out using DLPOLY,Reference Smith and Todorov27 which involves Verlet integration algorithm. A large tetragonal crystal structure of TiO2 is generated using lattice parameters a = b = 4.594 Å, c = 2.959 Å, and u = 0.305. A sphere of 3-nm diameter is cut from the center of the above structure, and excess Ti and O atoms are removed from the surface to obtain charge balance and charge neutrality. The sphere consists of 454 units of TiO2.
The optimization of sphere is carried out in microcanonical ensemble by “zero” temperature MD using 0.002 ps time step. Periodic boundary conditions are not used, and all the ion–ion interactions are included in the simulation by ensuring that the cut off lengths in the calculations of force and energy are greater than the diameter of the nanoparticle in all the simulations by 10 Å.Reference Naicker, Cummings, Zhang and Banfield18 Long-range Coulomb interactions are calculated using damped shifted force Coulomb sum. A time step ∆t = 0.002 ps is used, and the simulations are carried out for sufficiently long time to ensure that the sample reaches steady state.
The heating and quenching of the samples are done in NVT ensemble using Berendsen thermostat, whereas equilibration after heating or quenching is done in NVT ensemble by using Nose–Hoover thermostat. The relaxation constant of both the thermostats is 0.5 ps.
The dynamical method is used to generate three amorphous TiO2 samples from the liquid quench using different heating and quenching rates as given below.Reference Singh, Prakash, Shukla and Prasad28
Sample-I (SI): We heated the crystalline sample up to 5000 K at the rate of 5.0 × 10¹⁴ K/s as done by Rino and StudartReference Rino and Studart25; however, our sample get disintegrated and this may be due to the choice of our two-body potential. Therefore, the sample was heated up to 4000 K at the rate of 2.0 × 10¹⁴ K/s to destroy the memories of its initial structure and then equilibrated for 100 ps. It was further quenched at the rate of 1.8425 × 10¹⁴ K/s (i.e., 0.1% per ∆t) until it reached at 315 K and again equilibrated for 100 ps.
Sample-II (SII): We started with the equilibrated sample at 4000 K as for SI, then quenched at the rate of 5.0 × 10¹⁴ K/s until it reached at 2123 K, and equilibrated for 100 ps. The sample was further quenched from 2123 to 315 K at the rate of 5.0 × 10¹⁴ K/s and equilibrated for 100 ps. It is likely that in this process the dynamics of sample may have been reduced, therefore to relax the sample it is again heated up to 2123 K at the slower rate of 2.0 × 10¹⁴ K/s and equilibrated for l00 ps. Finally, it is quenched at the rate of 2.5 × 10¹⁴ K/s up to 315 K and equilibrated for 100 ps.
Sample-III (SIII): A spherical crystalline sample of 6-nm diameter consisting of 10,884 atoms was heated up to 4000 K at the rate of 2.0 × 10¹⁴ K/s as for SI, then quenched at the rate of 4.00 × 10¹⁴ K/s up to 0 K. Out of this amorphous bulk, a sample of 3-nm size is cut from its core region. It is again heated up to 400 K at the rate of 4.00 × 10¹⁴ K/s and equilibrated for 100 ps. It is then quenched at the rate of 10.625 × 10¹² K/s up to 315 K and equilibrated for 100 ps. This sample consists of 426 units of TiO2.
III. RESULTS AND DISCUSSION
Atomic trajectories from MD simulations are used to calculate positional and orientational correlations. For statistical average, 100 simulations each over a time span of 0.6 ps are carried out at 315 K and the averagedReference Naicker, Cummings, Zhang and Banfield18 pair correlation functions, CNs, bond lengths, bond angles, and dihedral angles are calculated.
A. Correlation functions
Two-body correlations are determined by partial pair correlation functions (PPCFs) g αβ(r) defined as

where  is the number of β particles in the shell between r + ∆r around an α particle. The angular brackets denote the ensemble average and the average over all the α particles. The number density ρ = N/Ω, with N = N Ti + N O, and Ω is the volume of the system; c β = N β/N is the concentration of β particles, and N β is their number. The total pair correlation function g(r) is defined as

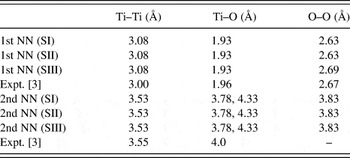
The calculated (PPCFs) for Ti–Ti, Ti–O, and O–O pairs are shown in Fig. 1, Fig. 2, and Fig. 3, respectively. The peak positions are the nearest neighbor (NN) distances. These results along with experimental dataReference Petkov, Holzhuter, Tronge, Gerber and Himmel3 are given in Table II.
The calculated results for partial pair correlation function (PPCF) g(r)(Ti–Ti) for three samples of 3-nm-size amorphous TiO2 at 315 K and the results obtained from the analysis of experimental data of Petkov et al.Reference Petkov, Holzhuter, Tronge, Gerber and Himmel3

The calculated results for PPCF g(r)(Ti–O) for three samples of 3-nm-size amorphous TiO2 at 315 K and the results obtained from the analysis of experimental data of Petkov et al.Reference Petkov, Holzhuter, Tronge, Gerber and Himmel3

The calculated results for PPCF g(r)(O–O) for three samples of 3-nm-size amorphous TiO2 at 315 K and the results obtained from the analysis of experimental data of Petkov et al.Reference Petkov, Holzhuter, Tronge, Gerber and Himmel3

Calculated first and second nearest neighbor (NN) distances of Ti–Ti, Ti–O, and O–O group of atoms for three samples (SI, SII, SIII) of amorphous TiO2 nanoparticle of 3-nm size at 315 K.

The experimental results calculated by Petkov et al.Reference Petkov, Holzhuter, Tronge, Gerber and Himmel3 (Ti–O) correlation shows a broad shoulder at 3.78 Å and sharp peak at 4.33 Å.
Sample-I, SI; Sample-II, SII; Sample-III, SIII.
The Ti–Ti PPCF given in Fig. 1 shows the first two splitted peaks at 3.08 and 3.53 Å, which are the first two Ti–Ti NNs for all three samples. These two NN distances show the edge-vertex linking of TiO6. The oscillatory nature of PPCF continues with broad peaks up to 10 Å, and beyond 10 Å PPCF decreases to zero. An intercomparison of the PPCFs for SI, SII, and SIII shows that Ti atoms with large interparticle separations are more compressed in SIII as compared to SI and SII. HoangReference Hoang23 found the first two Ti–Ti NN distances at 3.0 and 3.47 Å, whereas Rino and StudartReference Rino and Studart25 found the distances at 2.90 Å and at 3.35 Å. Petkov et al.,Reference Petkov, Holzhuter, Tronge, Gerber and Himmel3 in the analysis of their experimental data for the samples obtained by sputtering and sol–gel dip coating methods, found these NN distances at 3.0 and 3.55 Å are in close agreement with our calculated results. The other Ti–Ti NN distances found in the Petkov et al.Reference Petkov, Holzhuter, Tronge, Gerber and Himmel3 data analysis also agree with our calculated results.
The calculated Ti–O PPCFs given in Fig. 2 show that the first NN Ti–O atoms are at 1.93 Å and second NNs are at 3.78 and 4.33 Å for all the samples. It is evident from calculated PPCFs that the relative positions of Ti and O atoms in all the samples remain nearly unchanged and these agree with the experimental data done by Petkov et al.Reference Petkov, Holzhuter, Tronge, Gerber and Himmel3 The analysis of wide angle x-ray scattering results done by Zhang et al.Reference Zhang, Chen, Banfield and Waychunas4 for 2-nm particle yield Ti–O bond length of 1.94 Å, whereas analysis of x-ray absorption fine structure (EXAFS) results done by Yeung et al.Reference Yeung, Maira, Stolz, Hung, Ho, Wei, Soria, Chao and Yue29 for 3-nm particle yield Ti–O bond length of 1.93 Å. These results also agree with our calculations. For bulk amorphous TiO2, Ti–O first NN distance is 1.96 Å.Reference Naicker, Cummings, Zhang and Banfield18 Hence it is likely that the inner part of the nanosamples is more compressed as compared to bulk. The intercomparison shows that the peak heights for SII, SI, and SIII are in the increasing order.
The results for O–O PPCFs are shown in Fig. 3. The first NN distances for SI and SII is at 2.63 Å, whereas for SIII it is at 2.68 Å. The second NN distance in all the samples is 3.83 Å. The third NN distance for SIII is 5.08 Å, whereas for SI and SII it is 5.03 Å. The O–O bond length calculated by Petkov et al.Reference Petkov, Holzhuter, Tronge, Gerber and Himmel3 is 2.67 Å. The other NN distances from experimental dataReference Petkov, Holzhuter, Tronge, Gerber and Himmel3 also agree with our calculated results. The O–O bond length calculated by Rino and StudartReference Rino and Studart25 is 2.65 ± 0.05 Å, whereas the O–O bond length calculated by HoangReference Hoang23 is 2.59 Å. An intercomparison shows that the oxygen atoms with large interparticle separations get differently distributed in SI, SII, and SIII.
The weighted sum of PPCF g(r) for three samples along with the experimental data is shown in Fig. 4. The six NN distances for three samples are in the vicinity of 1.92, 2.63, 3.03, 3.53, 3.78, and 5.08 Å, and out of these, the first three are Ti–O, O–O, and Ti–Ti distances, respectively, which agree with the analysis of experimental data.Reference Petkov, Holzhuter, Tronge, Gerber and Himmel3, Reference Zhang, Chen, Banfield and Waychunas4 However, Rino and StudartReference Rino and Studart25 found these distances in the vicinity of 1.77, 2.65, and 3.55 Å. The oscillations in g(r) are significant up to 10 Å, and beyond 10 Å g(r) decreases to zero at 30 Å as found in the PPCFs.
The calculated results for total pair correlation function g(r) for three samples of 3-nm-size amorphous TiO2 at 315 K and the results obtained from the analysis of experimental data of Petkov et al.Reference Petkov, Holzhuter, Tronge, Gerber and Himmel3

The normalized peak heights for small interparticle separations agree with the experimental data. However, the peak heights for large interparticle separations deviate significantly as the shape factor is not accounted for in the analysis of the experimental data and in the earlier calculations.Reference Hoang, Zung and Trong21, Reference Rino and Studart25 If we write Eq. (2) as

which gives

where the radial distribution function R(r) for the bulk approaches to  at large distances. Lei et al.Reference Lei, de Graff, Thorpe, Wells and Sartbaeva26 have shown that the large distance limit of R(r) depends upon the shape and size of the nanomaterial. For nanomaterial of finite size in all three dimensions, R(r) will be exactly zero at and beyond the largest distances within the material.Reference Lei, de Graff, Thorpe, Wells and Sartbaeva26 This is exactly what we have found in our calculations of g(r).
The atomic pair distribution function G(r) is given as

Petkov et al.Reference Petkov, Holzhuter, Tronge, Gerber and Himmel3 and Zhang et al.Reference Zhang, Chen, Banfield and Waychunas4 calculated G(r) using the relation

where,  is reduced experimental structure factor for wave vector
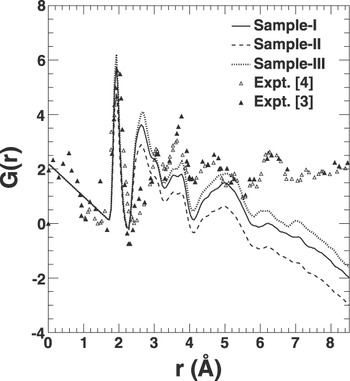
 . Petkov et al.Reference Petkov, Holzhuter, Tronge, Gerber and Himmel3 used the data of electron structure factor, whereas Zhang et al.Reference Zhang, Chen, Banfield and Waychunas4 used the data of x-ray structure factor in the calculation of G(r). We used Eq. (6) to calculate G(r) for SI, SII, and SIII samples. These results along with the those given in Refs.Reference Petkov, Holzhuter, Tronge, Gerber and Himmel3 and Reference Zhang, Chen, Banfield and Waychunas4 are shown in Fig. 5.
Calculated pair distribution functions G(r) for three samples of amorphous TiO2 of 3-nm size at T = 315 K and the results obtained from the analysis of experimental data of Zhang et al.Reference Zhang, Chen, Banfield and Waychunas4 and Petkov et al.Reference Petkov, Holzhuter, Tronge, Gerber and Himmel3

The averaged NN distance of 2.6 Å, found in the results of Petkov et al.,Reference Petkov, Holzhuter, Tronge, Gerber and Himmel3 agrees with our calculations, whereas such NN distance is absent in the analysis of Zhang et al.Reference Zhang, Chen, Banfield and Waychunas4 Other averaged NN distances in the vicinity of 3.1 and 3.8 Å also agree with the experimental findings.
B. Coordination numbers
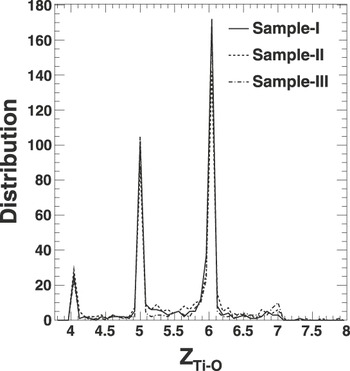
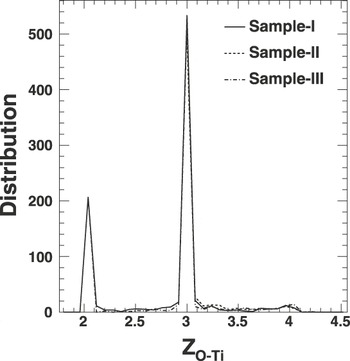
The calculated distribution of CNs Z Ti–O of Ti and Z O–Ti of O atoms is shown in Fig. 6 and Fig. 7, respectively. Evidently Ti atoms have the CNs 4, 5, 7, and 8 in addition to 6, and O atoms have CNs 2 and 4 in addition to 3.
The distribution of coordination number (CN) of Ti atoms (Z Ti–O) of amorphous TiO2 of 3-nm size at T = 315 K for the three samples.

The distribution of CN of O atoms (Z O–Ti) of amorphous TiO2 of 3-nm size at T = 315 K for the three samples.

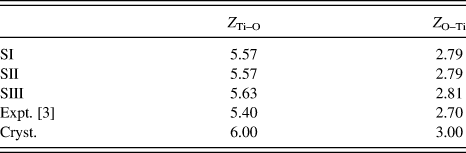
The averaged CNs for amorphous phase are tabulated in Table III. These get reduced by about 6–7% from CNs of crystalline bulk; however; the calculated results agree with the predictions of Petkov et al.Reference Petkov, Holzhuter, Tronge, Gerber and Himmel3 within the deviation of 3–4%. SIII is about 1% more coordinated than SI and SII.
The calculated averaged coordination numbers (CNs) of Ti and O atoms for three samples (SI, SII, SIII) of 3-nm-size amorphous TiO2 nanoparticle at 315 K.

The experimental results are from the data of Petkov et al.Reference Petkov, Holzhuter, Tronge, Gerber and Himmel3
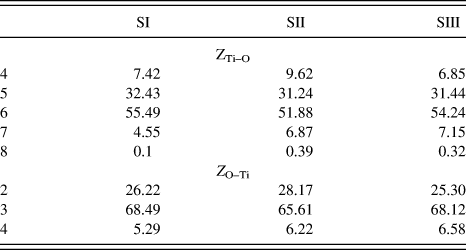
The relative percentage of Ti and O atoms having varied CNs are given in Table IV. Overall, 52–55% Ti atoms are sixfold coordinated, 31–32% Ti atoms are fivefold coordinated, 7–10% are fourfold coordinated, 5–7% are sevenfold coordinated, and few Ti atoms are even eightfold coordinated. It is found that over- and undercoordinated Ti atoms are in the core and surface regions, respectively. The x-ray absorption near edge structure data indicates that the curvature of the surface reduces CN from 6 to 5 and 4.Reference Rajh, Poluektov, Dubinski, Wiederrecht, Thurnauer and Trifunac30, Reference Chen, Rajh, Jager, Nedeljkovic and Thurnauer31 However in the binary glasses containing TiO2, most of the Ti atoms are fourfold coordinated with O atoms.Reference Manzini, Antanioli, Bersani, Lottici, Gnappi and Montonero32
Relative percentage of Ti and O atoms with CN Z Ti–O = 4, 5, 6, 7, and 8 and Z O–Ti = 2, 3, and 4 for three samples (SI, SII, SIII) of 3-nm-size amorphous TiO2 nanoparticle at 315 K.

On the other hand, 66–68% O atoms are threefold coordinated and these are in the core and central regions of the samples. About 5–7% O atoms become fourfold coordinated and these atoms are in the core region. Nearly 25–28% O atoms are twofold coordinated and these are distributed in the central and surface regions. Evidently the relative variance in the distribution of Ti and O atoms in three samples is within 4% due to different preparation procedures.
C. Bond lengths, bond angles, and dihedral angles
1. Bond lengths
We found that Ti–O bond lengths of crystalline sphere are 1.95 and 1.99 Å. In the amorphous phase these get distributed between 1.76 and 2.2 Å, although the most probable average bond length is nearly 1.93 Å and few averaged bond lengths are between 3.5 and 10 Å as these atoms are distributed in the vicinity of surface. Manzini et al.Reference Manzini, Antanioli, Bersani, Lottici, Gnappi and Montonero32 found two Ti–O separations of 1.79 and 1.93 Å in amorphous sol–gel TiO2; however the Ti–O bond lengths in tetrahedrally coordinated TiO2 vary between 1.63 and 1.82 Å.Reference Bragg33
The Ti–Ti bond length of 2.95 Å for crystalline TiO2 gets distributed between 2.77 and 4.0 Å in the amorphous phase. We found that the majority of bond lengths are 3.04, 3.5, and 3.62 Å in SI, 3.05 and 3.24 Å in SII, and 2.90, 3.04, and 3.56 Å in SIII. According to Petkov et al.Reference Petkov, Holzhuter, Tronge, Gerber and Himmel3 it can be argued that shorter Ti–Ti bond lengths of 3.04 Å in SI, 3.05 Å in SII, and 2.90 and 3.04 Å in SIII are related to pairs of Ti atoms, which share the edges of centered Ti–O octahedra. The longer ones, 3.62 Å in SI, 3.24 Å in SII, and 3.56 Å in SIII bond lengths are of the pair of atoms in the octahedra having common vertex.
The crystalline sphere of O–O bond lengths of 2.53 and 2.77 Å get dispersed between 2.3 and 4.5 Å in the amorphous phase. The average bond length for SI and SII is 2.63 Å and for SIII it is 2.69 Å. The O atoms with average O–O bond lengths greater than 3 Å are found differently distributed in SI, SII, and SIII. The number of bonds with bond length less than 2.77 Å increases. Hence, O atoms get more compressed in the amorphous phase.
2. Bond angles
The distributions of averaged bond angles ‹O–Ti–O, ‹Ti–O–Ti, ‹Ti–Ti–O, ‹Ti–O–O, ‹Ti–Ti–Ti, and ‹O–O–O are calculated. It is noted that for spherical crystalline nanoparticle, most of the ‹O–Ti–O bond angles are 81, 90, and 98.5° except the few bond angles of 53, 69, 111, and 127°. However, in amorphous phase, these get dispersed from 10 to 180° although majority of bond angles are between 70 and 120°. Although the bond angle distributions for SI, SII, and SIII are similar, most of obtuse angles are found between the atoms in the vicinity of surface. SII has maximum and SI has minimum number of particles with ‹O–Ti–O = 90°. Rino and StudartReference Rino and Studart25 found ‹O–Ti–O at 90°.
The crystalline bond angles ‹Ti–O–Ti of 98 and 131° get distributed between 20 and 170° in the amorphous phase, and majority of the bond angles are obtuse angles. SI and SII have larger number of atoms with ‹Ti–O–Ti = 127°, whereas SIII has large number of atoms with bond angles ‹Ti–O–Ti = 108 and 120°. Rino and StudartReference Rino and Studart25 found these angles at 90 and 130°, which are related to edge and vertex connectivity between TiO6 units of TiO2 and corresponds to the splitting of the first peak in g(r)Ti–Ti. Similarly, the discrete bond angles ‹Ti–Ti–O and ‹Ti–O–O in crystalline sphere get redistributed in the amorphous phase. The number of acute bond angles ‹Ti–O–O increases in the amorphous phase as compared to bond angle ‹Ti–Ti–O although the relative distribution for these bond angles in three samples is similar.
In the distribution of bond angles ‹Ti–Ti–Ti and ‹O–O–O involving metallic and gaseous atoms it is noted that the number of acute bond angles between metallic and gaseous atoms increases as compared to crystalline sphere, as these atoms make a closer network in the amorphous phase. We found that the large number of oxygen atoms make the bond angle ‹O–O–O = 60 and 120°, which is similar to that found in the calculations of Rino and Studart.Reference Rino and Studart25
3. Dihedral angles
The dihedral angles between the planes involving two Ti and two O atoms (i.e., ‹O–Ti–O–Ti, ‹Ti–O–Ti–O, ‹O–Ti–Ti–O, ‹O–O–Ti–Ti, ‹Ti–O–O–Ti), one O and three Ti atoms (i.e., ‹O–Ti–Ti–Ti, ‹Ti–O–Ti–Ti, ‹Ti–Ti–O–Ti, ‹Ti–Ti–Ti–O), one Ti and three O atoms (i.e., ‹Ti–O–O–O, ‹O–Ti–O–O, ‹O–O–Ti–O, ‹O–O–O–Ti), and four Ti and four O atoms (i.e., ‹Ti–Ti–Ti–Ti, ‹O–O–O–O) are also calculated.
It is noted that most of the dihedral angles ‹O–Ti–O–Ti in the crystalline sphere are 0, 90, 180, and 270°. However in the amorphous phase these are nearly uniformly distributed between 0 and 360° with small peaks in the vicinity of 30, 75, 120, 148, 225, and 330° for SI, but these peaks are at 0, 45, and 110° for SII, and for SIII, these peaks are at 96, 186, 290, and 315°. Thus, the planar orientation becomes nearly random for all the three samples. The similar reorientation is found for the dihedral angles ‹Ti–O–Ti–O, ‹Ti–O–Ti–Ti, ‹O–O–Ti–O.
In the crystalline TiO2, few atoms make the dihedral angle ‹O–O–O–O involving at least four O atoms of 10°. However, in the amorphous phase many oxygen atoms migrate and constitute the planes involving at least three O–O bonds. It is found that SI has large number of dihedral angles of 70 and 280°, whereas SII and SIII have large number of dihedral angles of 315 and 264° respectively.
The crystalline phase dihedral angles ‹Ti–Ti–Ti–Ti at 0 and 180° get distributed between 0 and 360°. The SI has larger number of planes subtending dihedral angles ‹Ti–Ti–Ti–Ti of 238 and 325°, whereas SII and SIII have these angles at 174 and 276°, respectively. Similar results are found in the analysis of other dihedral angles. Thus, the orientational dynamics of O and Ti atom differs from each other; however, this dynamics in differently prepared samples is at small variance.
IV. CONCLUSIONS
Two-body potential is used to generate three samples of 3-nm size using different heating and quenching rates. We started with initial atomic arrangement of rutile structure and used open boundary conditions which are better suited for finite size amorphous nanoparticles of TiO2. It is continuously checked that the samples are in amorphous phase. Although the classical entropy of all the samples is the same, the intrinsic geometry of atomic network in these samples is found different.
The significant particle correlations are found up to 10 Å separation and vanish at the nanoparticle dimension. The calculated results agree with the experimental data for small r; however, there are significant deviations at large r as the shape factor is not accounted for in the analysis of experimental data. The local atomic densities may also be different in the simulated and experimental nanoparticles. The dispersion in the calculated results for three samples is similar to those found in the experimental data. The calculated results also agree with the other calculations based on MA potential; however, the results deviate about 10% from those obtained using variable charge potential. The effect of three-body interaction is yet to be investigated.
The examination of atomic coordinates reveal that the bond lengths, bond angles, and dihedral angles are differently distributed in the core, central, and the surface regions of each nanoparticle. It is noted that the Ti–Ti and O–O pairs expand and squeeze differently in core, central, and outer regions of the samples such that the Ti–O bond lengths remain evenly distributed. The atomic density increases in the core of the samples and decreases in the vicinity of the surface.
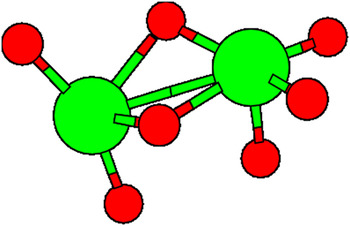
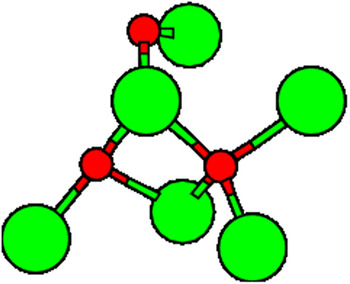
The deviations in the structural parameters from the crystalline structure make it evident that the strain field is significant and it is at variance in the different regions of the nanoparticles. Most of the overcoordinated strained structures are in core region, and undercoordinated strained structures are in the surface regions of the sample. We generated differently coordinated Ti and O atoms using atomic coordinates from the different regions of the SI and these are shown in Fig. 8, Fig. 9, and Fig. 10. The changed bond lengths, distorted bond angles, and dihedral angle are evident from the diagrams.
The 4- and 5-fold coordinated Ti atoms in 3-nm-size amorphous TiO2 sample SI at 315 K.

The 6- and 7-fold coordinated Ti atoms in 3-nm-size amorphous TiO2 sample SI at 315 K.

The 2-, 3-, and 4-fold coordinated O atoms in 3-nm-size amorphous TiO2 sample SI at 315 K.

The quantitative variance in the strain parameters which is within 4% may change the electron density of states in these samples. Hence the mechanical, electrical, and optical properties will also be changed. The non-bonded and bonded Ti and O atoms with long bond lengths found in the vicinity of the surface may be significant for the sintering process.
ACKNOWLEDGMENTS
The authors thank Dr. G.S.S. Saini and Dr. Ralph Meyer for their suggestions. The financial assistance from University Grants Commission New Delhi for Emeratus Fellowship grant is acknowledged.