Introduction
CHD is the most common birth defect and accounts for nearly one-third of all major congenital anomalies, affecting up to 9 in 1000 live births. Reference van der Linde, Konings and Slager1,Reference Liu, Chen and Zühlke2 CHD is defined as a structural anomaly of the heart and/or the great vessels that arises during embryogenesis. Reference Dolbec and Mick3–Reference Luca, Miron and Mîndru5 Approximately 80% of cases have multifactorial causes, with varying combinations of genetic and environmental factors. Reference Blue, Kirk and Sholler4 About one-quarter of children with CHD present with chromosomal abnormalities, most commonly Down syndrome
Feeding difficulties and malnutrition are well-documented challenges in children with CHD. Reference Kelleher, Laussen and Teixeira-Pinto6–Reference Ibrahim, Mostafa and Sobhy10 Increased metabolic demands, poor feeding endurance, and the need to target weights before surgery contribute to inadequate oral intake. Reference Arslan8,Reference Trabi, Dunitz-Scheer and Scheer11 Although it is widely assumed that malnutrition negatively affects postoperative outcomes, empirical evidence remains limited. Reference Argent, Balachandran and Vaidyanathan9
Oster et al. Reference Oster, Lee and Honein12 showed that low birth weight in children with CHD reflects reduced physiological reserves, immature organ systems, and greater vulnerability to surgery, infection, and circulatory stress. As a result, nutritional management frequently involves enteral tube feeding to ensure adequate caloric intake and adequate growth. Reference Luca, Miron and Mîndru5,Reference Medof-Cooper, Irving and Hanlon13 However, tube dependency can persist even after the initial indication for tube placement has resolved. Reference Dunitz-Scheer, Marinschek and Beckenbach14 Sagiv et al. Reference Sagiv, Tjoeng and Davis15 demonstrated that more than half of all children who underwent a cardiac surgery continued to require tube feeding postoperatively.
Tube dependency is associated with unintended adverse effects such as oral and tactile aversion, no appetite, recurrent retching, gagging, and vomiting. Reference Dunitz-Scheer, Marinschek and Beckenbach14,Reference Braegger, Decsi and Dias16,Reference Pahsini, Marinschek and Khan17 Despite full enteral tube feeding support, approximately 30% of tube-dependent children do not gain weight at all, Reference Khan, Marinschek and Pahsini18 thus resulting in greater loss caused by adverse effects than the intended nutritional benefit can compensate. For all these children, an individual tube weaning strategy must be implemented to allow them to experience oral feeding and remove their feeding tubes. Interest in home-based weaning methods has increased in recent years, and although best-practice guidance specific to CHD remains limited, Reference Slater, Spader-Cloud and Fridgen19 a few programmes have been described in the literature. Reference Marinschek, Dunitz-Scheer and Pahsini20–Reference Horsley, Hill and Kaskie25 Home-based approaches may offer several advantages, including feeding environments, reduced caregiver and child stress associated with hospitalization, decreased risk of nosocomial infection, and greater opportunities for responsive, individualised feeding. Reference Marinschek, Dunitz-Scheer and Pahsini20–Reference Marinschek26 Nevertheless, home-based tube weaning might also raise concerns regarding safety, efficacy, and ideal timing of weaning for children with CHD and overall complex medical needs.
In this study, the “Graz Model of Tube Weaning”, has been utilized. Reference Marinschek, Dunitz-Scheer and Pahsini20 It provides both a fully remote children telemedical weaning programme (Netcoaching) and a hybrid model consisting of a two-week intensive on-site intervention followed by Netcoaching for up to 35 days after the final tube feed (see Supplemental Material, Appendix 1). Each tube wean is led by a specialised paediatrician and supported by a clinical psychologist and/or feeding therapist. In addition to therapy sessions, the on-site programme provides daily sensory groups and integrated psychotherapeutic, psychological, and educational support. The model is grounded in two principles: (1) Allow hunger: reduce tube feeds under daily medical/telemedical supervision in order to encourage the child to express new sensory experiences and feel hungry without starving them (somatic level) and (2) promoting child autonomy through a developmentally informed, child-led approach.
The present study aims to evaluate tube weaning outcomes in children with CHD treated within a structured multidisciplinary programme offering both telemedical and on-site formats.
Materials and methods
The objective of this study was to evaluate outcomes of tube weaning using the “Graz Model of Tube Weaning” in a large cohort of tube-dependent children with CHD. The main focus was on the weaning effectiveness across both treatment formats (Netcoaching vs. Eating School), changes before and after intervention, and clinical characteristics relevant to determining best practices. A further aim was to identify areas requiring additional research to optimise nutritional management, developmental outcomes, and quality of life in this medically fragile population.
All children were enrolled in the “Graz Model of Tube Weaning” between January 2016 and end of 2024. Eligible participants were children ages two months to five years with a confirmed diagnosis of CHD who were receiving at least 60% of their total nutritional intake via enteral tube feeding (nasogastric, gastrostomy, jejunal, or gastrojejunal).
All participants completed one of two treatment formats within the “Graz Model of Tube Weaning”: a two-week intensive on-site outpatient programme (Eating School) followed by structured online aftercare, or a fully telemedical home-based programme (Netcoaching). Prior to treatment initiation, each child underwent a standardised multidisciplinary assessment procedure (including videos, medical records and filling out a specific medical questionnaire) conducted by two independent paediatricians, a feeding therapist (physiotherapist or occupational therapist), and a clinical psychologist. Allocation to treatment groups was non-randomised and primarily based on parental preference, taking into account practical considerations such as travel distance, time constraints, and financial aspects. There was no minimum age requirement or developmental prerequisite to participate in the Eating School. Children of all ages and developmental profiles were eligible to participate, provided there were no medical contraindications to group-based therapy. Similarly, the choice of intervention was not linked to the duration of tube feeding. However, medical contraindications limited eligibility for the Eating School due to its group-based structure and associated infection risk. Children requiring respiratory support or tracheostomy care, central venous catheters, immunodeficiency, or close medical monitoring were advised to participate in the Netcoaching telemedicine program instead. In total, allocation followed an individualised approach guided by parental preference, logistical feasibility, and medical safety, rather than feeding severity. Thus, while both treatment formats followed the same therapeutic principles, the Eating School provided a more intensive, location-based, hands-on intervention involving one or two paediatricians, two educators, one feeding therapist (either a physiotherapist or an occupational therapist), one clinical psychologist, one psychotherapist and one or two interns training to become psychotherapists or psychologists and one cook, whereas Netcoaching represented a fully remote and exclusively home-based approach, supervised by a smaller interdisciplinary team including only one medical doctor, one feeding therapist (physiotherapist or occupational therapist) and one clinical psychologist.
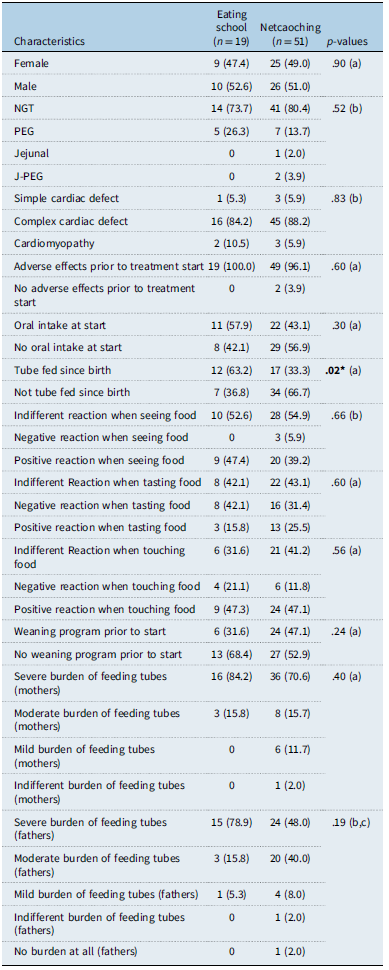
All key differences between programmes are summarised in Table 1. Demographic data, received by caregiver’s answers, included chronological age, sex, gestational age, and country of referral. Clinical characteristics encompassed: CHD classification (isolated simple cardiac defects such as ventricular septal defects; complex cardiac defects; or isolated cardiomyopathy considered analogous to heart failure, assigned by two independent medical doctors) and type of enteral feeding (asogastric, gastrostomy, gastrojejunal tube). Feeding-related variables collected at baseline from parents included adverse effects of tube feeding (e.g., oral or tactile aversion, gagging, and vomiting), developmental indicators of oral feeding skills (such as initial oral intake status, behavioural responses to seeing, touching, or tasting food, and tube feeding since birth), and history of prior tube-weaning attempts. Caregiver also reported parental burden in the medical questionnaire used prior to treatment initiation. Additionally, in order to analyse the growth development (including weight-for-age z scores and height-for-age z scores), and due to its international study sample, authors utilised Center for disease control and prevention standards-z-values for body mass index 27 comparing those at time of treatment start to those at date of discharge.
Baseline characteristics of the treatment groups

Table 1. Long description
The table compares demographic and clinical characteristics of two treatment groups, Eating school and Netcoaching, for children with cardiac defects and feeding issues. It includes data on sex, type of enteral feeding, cardiac defect classification, adverse effects prior to treatment, oral intake at start, tube feeding since birth, reactions to food, weaning program history, and parental burden. The table has 32 rows and 4 columns, with column headers Characteristics, Eating school (n = 19), Netcoaching (n = 51), and p-values. Notable trends include a higher percentage of children with complex cardiac defects and adverse effects prior to treatment in both groups. The Eating school group has a higher percentage of children tube fed since birth, while the Netcoaching group has a higher percentage of children not tube fed since birth. Parental burden is also reported, with a higher severe burden for both mothers and fathers in the Eating school group.
Note: Differences were tested with Crosstabs (Chi2-test(a); Fishers exact test (b)); one dad, participated in the Netcoaching and gave no answer, thus he was excluded from the analyses (n = 50)(c). Nasogastric tube (NGT), gastrostomy (PEG), jejunal tube (Jejunal), gastrojejunal tube (J-PEG). Statistical significance of p-values is described as p < .05. Sign. effects are marked bold.
All data collected were provided by primary caregivers or medical professionals involved in the child. Weaning outcomes were classified by treatment team as either fully tube weaned or partially tube weaned. Partial weaning included children who transitioned to full oral intake for nutrition but continued to require supplemental tube feeding solely to meet prescribed fluid requirements as determined by the local paediatric cardiology team. Children were considered fully tube weaned after a minimum of 35 consecutive days without any tube feeding, provided they demonstrated stable health status and appropriate weight development. Total duration of tube feeding and time to complete weaning were recorded. For age-related analyses, participants were stratified into three groups: children <1, children aged 1–2 years, and children aged >2 years of life.
The total number of participants required for this study was calculated by an a-priori analysis by using G*Power Software 3.1.9.6 software (University Kiel, Germany) for computing differences between two dependent variables (matched pairs) with a stronger effect size f2(V) of .5 (and a power of .95). Output data were calculated for a study size of at least 45 participants (noncentrality parameter Δ = 3.35; critical t = 1.68; df = 24).
Inclusion criteria were (1) diagnosis of CHD, (2) age between two months and five years, (3) receipt of at least 60% of nutritional intake via enteral tube feeding, (4) completion of either tube-weaning programme, and (5) availability of complete pre- and post-treatment data. Exclusion criteria included incomplete datasets and discontinuation or premature termination of the intervention for any reason.
This study was approved by the Ethics Committee of the Medical University of Graz (36-085 ex 23/24) and conducted in accordance with the requirements of the Declaration of Helsinki.
Data analysis
Statistical analyses were performed with SPSS for Windows Version 26.0. Interval-scaled data were tested for normal distribution using Kolmogorov–Smirnov tests within the groups. Normally distributed data were described by frequencies, mean values, and standard deviations. For non-parametric data median values and interquartile ranges to describe the sample. Paired sample t-tests were conducted to examine pre-to-post changes in growth parameters. T-test for two independent variables was used for two groups comparison in metric data. For comparisons of non-parametric parameters, Kruskal–Wallis-H-Tests and Mann–Whitney-U-Tests (Z) were used. All statistical tests were two-sided. Differences were considered statistically significant below a p-value of .05.
Results
Description of the sample
A total of 83 children with CHD enrolled in the two programmes. Data of 13 children were excluded due to interruption of the programme by caregivers (n = 9), missing data (n = 2), being still in progress (n = 1), or no feeding tube at treatment start due to prior self-weaning attempt (n = 1) (see Supplemental Material, Appendix 2).
Seventy children completed the treatment. Out of these, 51 children successfully ended the Netcoaching treatment (72.9%), leaving 19 children (27.1%) participating in the Eating school. 36 children were male (51.4%). The median age of the all children (n = 70) completing the programme was 1.67 years (interquartile: .73–1.49). In total, median gestational age was 39 weeks (interquartile range: 37–40). 55 children (78.5%) were tube fed via a NG-tube, 12 had a PEG-tube placed, one child was fed via a J-tube and two children had a J-PEG. Tube placement occurred right after birth in 41 participants (58.6%), in the other children, the feeding tube was inserted later in life. 30 children out of 70 (42.9%) already participated in another tube weaning programme prior to this treatment but failed there. Participants were referred from multiple countries, including Germany (n = 31; 44.2%), the United States (n = 9), Austria (n = 9), the United Kingdom (n = 4), Switzerland (n = 3), and the Netherlands (n = 3), and single referrals from Australia, Belgium, France, Hong Kong, Lithuania, Norway, Sweden, and Poland.
Based on cardiac diagnosis: 61 children (87.1%) were classified as having complex cardiac defects that were not easily remedied. Four children presented with isolated simple cardiac defects, including ventricular septal defects, and five children were diagnosed with cardiomyopathy, including one child at high risk for cardiac failure. The classification of CHD was based on published definitions 28 (see Supplemental Material, Appendix 3). A significantly greater proportion of children enrolled in the Eating School program had been tube fed since birth compared to those in the Netcoaching group. Apart from age distribution, no further statistically significant differences between treatment groups were observed. Children enrolled in Netcoaching were significantly younger than those treated in the Eating School program. An overview of demographic and clinical characteristics by treatment group is provided in Tables 1 and 2.
Treatment differences (Eating School vs. Netcoaching)

Table 2. Long description
The table compares treatment differences between Eating School and Netcoaching programs for children with cardiac defects. It includes parameters such as gestational age, age in years, treatment duration in months, and duration until last tube feed in months. The table has four rows and five columns, including columns for Eating School and Netcoaching with their respective median and interquartile range values, and a p-value column. Notable trends include significant differences in age distribution and treatment duration, with children in Netcoaching being younger and having a longer treatment duration compared to those in the Eating School program. The duration until the last tube feed is also significantly different between the two groups.
Note: Differences were tested with Mann-Whitney-U tests Z; non-parametric data are presented as Median (MD) and interquartile range (IQR); gestational age (GA); Statistical significance of p-values is described as p < .05. Sign. effects are marked bold.
p-value age in years = 0.006; treatment duration in months= 0.003; duration until last tube feed in months = 0.000121.
Adverse effects of long-term tube feeding Eating School vs. Netcoaching
According to caregiver reports, 68 children (97.1%) showed multiple adverse effects of tube feeding such as vomiting, retching, gagging, no appetite, oral food refusal/food aversion, gastroesophageal reflux disease, granulation tissue, skin irritation around the tube entry area, sweating prior to treatment.
At treatment initiation, 33 children (47.1%) demonstrated some degree of oral intake, accounting for up to 30% of their total daily nutritional intake. Caregivers also reported children’s behavioural responses to food-related sensory exposure prior to treatment. Positive reactions were observed in 16 children (22.9%) during tasting, in 29 children (41.4%) when visually exposed to food, and in 33 children (47.1%) during tactile interaction with food (Table 1). No statistically significant differences between the Eating School, and Netcoaching groups were identified for these variables.
Perceived caregiver burden related to tube feeding did not differ significantly between treatment groups (Fisher’s exact test = 7.35, p = .07). In general, mothers were more likely to classify their burden as severe (74.3%), while fathers were more likely to describe their burden as moderate (33.3%).
Tube weaning outcomes
In total, 70 children completed the tube-weaning intervention and met all inclusion criteria. Of these, 69 children were successfully transitioned from enteral tube feeding to oral intake, resulting in an overall tube-weaning success rate of 98.6%. One child enrolled in the Netcoaching program continued to require minimal tube-administered water at the conclusion of treatment to meet hydration needs related to underlying heart failure.
Tube weaning in children with CHD and growth parameters pre-to-post changes
In total, the weight-for-age z-score, height-for-age z-score, and standards-z-values for body mass index scores were significantly reduced after tube weaning (total pre-to-post changes see Supplemental Material, Appendix 4).
Tube weaning and growth parameters (Netcoaching vs. Eating School)
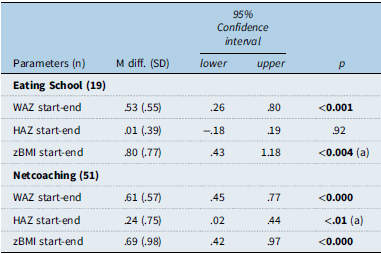
In both treatment groups, children showed significantly lower growth data over course of time, except for children participating in the Eating School. Here, children showed no significant change in height-for-age z-score data (height-for-age z-score at start: M: −1.38, standard deviation: 1.05; height-for-age z-score at end: −1.39, standard deviation: .96, p = .92). Table 3 gives an overview about the mean differences and 95% confidence intervals).
Growth parameters pre-to-post changes (Eating School vs. Netcoaching)

Table 3. Long description
The table presents growth parameters pre-to-post changes between Eating School and Netcoaching groups. It includes 6 rows and 5 columns. The columns are labeled Parameters, M diff (SD), 95% Confidence Interval (lower and upper), and p. The rows are labeled Eating school (19) and Netcoaching (51). For Eating school, WAZ start-end shows a mean difference of 0.53 with a standard deviation of 0.55, a 95% confidence interval of 0.26 to 0.80, and a p-value of less than 0.01. HAZ start-end shows a mean difference of 0.01 with a standard deviation of 0.39, a 95% confidence interval of -0.18 to 0.19, and a p-value of 0.92. zBMI start-end shows a mean difference of 0.80 with a standard deviation of 0.77, a 95% confidence interval of 0.43 to 1.18, and a p-value of less than 0.01. For Netcoaching, WAZ start-end shows a mean difference of 0.61 with a standard deviation of 0.57, a 95% confidence interval of 0.45 to 0.77, and a p-value of less than 0.001. HAZ start-end shows a mean difference of 0.24 with a standard deviation of 0.75, a 95% confidence interval of 0.02 to 0.44, and a p-value of less than 0.01. zBMI start-end shows a mean difference of 0.69 with a standard deviation of 0.98, a 95% confidence interval of 0.42 to 0.97, and a p-value of less than 0.001.
Note: Paired sample t-test for pre-to-post changes; Normal distributed data are presented as Mean differences (M diff.) and SD (standard deviation); weight-for-age z scores (WAZ), height-for-age z scores (HAZ), standards-z-values for Body Mass Index (zBMI); Statistical significance of p-values is described as p < .05.
P-value of paired sample Wilcoxon-test due to non-parametric data(a). Sign. effects are marked bold.
Tube weaning and growth parameters (age groups)
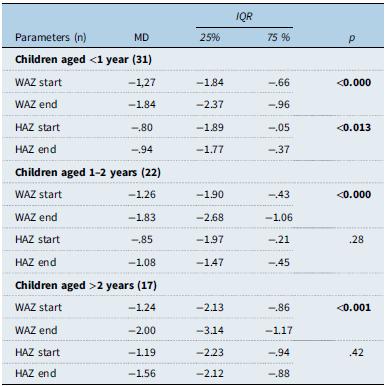
In all three age groups, children with CHD significantly lost weight (weight-for-age z-score) during and after the weaning process. Older children (>2 years of age) lost more weight-for-age z-score (difference weight-for-age z-score value pre-to-post change of .76 vs. younger age groups, which show a difference weight-for-age z-score value pre-to-post change of .57 each).
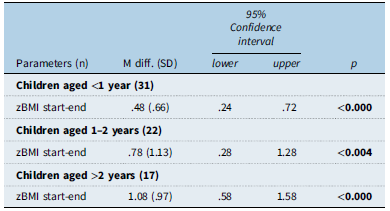
Younger children (<1 year) with CHD showed a significant transient loss of height (height-for-age z-score). Older children (>2 years) showed no significant effects in their height-for-age z-score data. In all three age groups, standards-z-values for body mass index data differed significantly pre-to-post weaning and children, no matter how old they were, showed lower standards-z-values for body mass index at end of treatment (children aged <1 year: standards-z-values for body mass index at start: M:−1.15, standard deviation: 1.11; standards-z-values for body mass index at end: M:−1.64, standard deviation: 1.19; p < .001; children aged 1–2 years: standards-z-values for body mass index at start: M: −0.80, standard deviation: 1.54; standards-z-values for body mass index at end: −1.58, standard deviation: 1.58, p < .05; children aged >2 years: standards-z-values for body mass index at start: M: −.65, standard deviation: .89; standards-z-values for body mass index at end: M: −1.74, standard deviation: 1.49; p < .001). Tables 4 and 5 summarise all growth data and differences within the three age groups.
WAZ, HAZ pre to post tube weaning changes (age groups)

Table 4. Long description
The table presents data on weight-for-age z-scores (WAZ) and height-for-age z-scores (HAZ) for children with congenital heart disease (CHD) across three age groups: under 1 year, 1-2 years, and over 2 years. The table has four rows and five columns, including parameters, mean difference (MD), interquartile range (IQR) at the 25th and 75th percentiles, and p-values. For children under 1 year, WAZ start is -1.27, WAZ end is -1.84, HAZ start is -0.80, and HAZ end is -0.94, with significant p-values. For children aged 1-2 years, WAZ start is -1.26, WAZ end is -1.83, HAZ start is -0.85, and HAZ end is -1.08, with significant p-values for WAZ. For children over 2 years, WAZ start is -1.24, WAZ end is -2.00, HAZ start is -1.19, and HAZ end is -1.56, with significant p-values for WAZ. The data indicates a significant loss in height for younger children and significant changes in body mass index across all age groups post-weaning.
Note: Paired sample Wilcoxon-test for non-parametric data pre-to-post change; Median (MD); inerquartile range (IQR); weight-for-age z scores (WAZ), height-for-age z scores (HAZ), standards-z-values for Body Mass Index (zBMI); Statistical significance of p-values is described as p < .05. Sign. effects are marked bold.
zBMI pre-to-post change in different age groups

Table 5. Long description
The table presents data on the change in zBMI (body mass index) pre-to-post treatment across three age groups of children with CHD (congenital heart disease). It includes three rows for each age group: children aged less than 1 year, children aged 1 to 2 years, and children aged over 2 years. Each row contains the mean difference (M diff), standard deviation (SD), 95% confidence interval (lower and upper bounds), and p-value. For children aged less than 1 year, the mean difference is 0.48 with a standard deviation of 0.66, a 95% confidence interval of 0.24 to 0.72, and a p-value of less than 0.001. For children aged 1 to 2 years, the mean difference is 0.78 with a standard deviation of 1.13, a 95% confidence interval of 0.28 to 1.28, and a p-value of less than 0.05. For children aged over 2 years, the mean difference is 1.08 with a standard deviation of 0.97, a 95% confidence interval of 0.58 to 1.58, and a p-value of less than 0.001.
Note: Paired sample t-test for pre-to-post change in zBMI data; Normal distributed data; Data are presented as Mean differences (M diff.) (SD: standard deviation); standards-z-values for Body Mass Index (zBMI); Statistical significance of p-values is described as p < .05. Sign. effects are marked bold.
Duration of treatment (in total)
The median total duration of the treatment was 64.5 days (interquartile range: 48.0–111.0 days). The median duration until the last tube feed in days was in total 28.5 days (interquartile range: 11.0–73.75 days).
Duration of treatment (Eating School vs. Netcoaching)
Treatment duration differed significantly between the two intervention formats (p < .05). Children enrolled in the Netcoaching program required a significantly longer treatment period compared to those participating in the Eating School program (Table 2).
Discussion
This study reports tube weaning outcomes and growth trajectories in a large international cohort of tube-dependent children with CHD who completed one of two formats of the “Graz Model of Tube Weaning.”
Overall, the findings highlight both the feasibility and the complex challenges of tube weaning in medically fragile children with complex cardiac conditions.
Across the total sample, the overall success rate exceeded 98%, leaving only 2% of children requiring additional fluids due to medical or hydration-related needs. These results demonstrate that a hunger-based and autonomy-supportive approach can be safely implemented in children with CHD, even when medical complexity and long-term tube dependence are present. Considering the limited evidence available on tube weaning strategies in children with CHD, Reference Slater, Spader-Cloud and Fridgen19,Reference Mills, Kim and Fogg29–Reference Tume, Balmaks and da Cruz30 the present findings provide clinically relevant data for guiding practice.
Most children in this study had been tube fed since birth, reflecting the increased metabolic needs caused by the underlying diagnosis and frequent early surgical interventions characteristic of CHD. Reference Arslan8–Reference Argent, Balachandran and Vaidyanathan9,31 Notably, more than 97% exhibited adverse effects commonly associated with long-term tube feeding (e.g., oral aversion, gagging, and vomiting), aligning with prior research. Reference Dunitz-Scheer, Marinschek and Beckenbach14,Reference Braegger, Decsi and Dias16–Reference Khan, Marinschek and Pahsini18,Reference Marinschek, Pahsini and Scheer32 These findings underline the importance of initiating weaning as early as medically feasible. Reference Ishizaki, Hironaka and Tatsuno33 Importantly, nearly half of participating families reported unsuccessful prior attempts in other weaning programmes, suggesting that the “Graz Model of Tube Weaning” may be particularly valuable as a tertiary intervention for complex cases.
Both treatment options, Eating School and the Netcoaching program, proved highly effective; however, some differences emerged. The baseline differences in age and prior tube feeding between groups primarily reflect parental choice rather than a structured allocation process, as children were not assigned based on severity of feeding difficulties, age, or developmental status. Both programmes followed the same therapeutic principles, minimising potential bias related to these differences. The Netcoaching program required significantly more span of time than the onsite Eating School. Interestingly, Horsley et al. Reference Ishizaki, Hironaka and Tatsuno33 could show that a longer tube weaning time was associated with older age in their telehealth-based tube weaning programme, but they included a much smaller sample (n = 16) and the “oldest” child was 23 months old.
This finding is broadly consistent with the operational realities of telemedical approaches, which rely heavily on caregiver consistency and iterative adjustment within the family’s daily routines. Reference Marinschek, Dunitz-Scheer and Pahsini20 In the current study, younger children, who were more frequently enrolled in the Netcoaching, may require closer guidance and more gradual adjustments. In contrast, the on-site treatment and care enables intensive professional modelling and rapid feedback, which may accelerate behavioural change and skill acquisition. Netcoaching may offer meaningful advantages despite longer duration, particularly in contexts where on-site capacity is constrained. Prolonged waiting periods may coincide with changes in medical stability and family circumstances, potentially necessitating additional interventions (e.g., surgeries, new therapies). Additionally, children may also have already developed a consistent personality, which in turn may affect interactions during shared meals. Reference Horsley, Hill and Kaskie25,Reference Smith, Teo and Simpson34 The Netcoaching also offers secondary benefits such as reducing infection co from hospital visits and preventing from re-traumatisation.
Tube-dependent children with CDH can and should therefore be weaned as soon as the medical status has been stabilised and the child is at home. The median total treatment duration was 65 days (including 35 days of online aftercare), while the average duration until children no longer required any tube feeds was only 29 days. These durations are comparable to results of other studies Reference Wong, Loomba and Allen35,Reference Sharp, Volkert and Scahill36 or even slightly faster than in Shine et al., Reference Shine, Finn and Allen37 who reported an average weaning duration of 52 days in their study population.
As expected, we observed significant decreases in weight-for-age z scores, height-for-age z-score, and standards-z-values for body mass index data during weaning. This pattern is typical for various weaning programmes worldwide. Reference Wright, McNair and Milligan38 Here, it is important to note that CDC growth standards 27 were used to calculate weight-for-age z scores, height-for-age z-score, and standards-z-values for body mass index for this international cohort to ensure consistency and avoid bias from multiple reference tables. Although growth patterns may differ in CHD, the use of a single standard improves comparability and internal validity. That said, children in the Netcoaching program lost more weight than children in the Eating School, likely due to their younger age and higher medically prescribed caloric demands prior to weaning. 31,Reference Ackerman, Karn and Denne39 Interestingly, the largest decline in weight-for-age z scores and standards-z-values for body mass index occurred in older children, perhaps due to longer tube dependence or more entrenched maladaptive eating patterns. In contrast, children in the Eating School showed no significant decline in height-for-age z-score, suggesting that shorter intervention periods and closer professional monitoring may help stabilise linear growth. Here, authors of the current study also want to acknowledge that height measurements in the telemedical Netcoaching (or aftercare) program may vary, but consistent home-based weight monitoring and paediatric verification provide reliable growth trajectories, while the short study duration limits interpretation of linear growth. Importantly, weight loss remained within clinically acceptable limits in this cohort, and children were classified as fully weaned only after demonstrating stable health status and weight development for at least 35 days.
In many cases, the main focus of keeping infants longer on the tube feeds is fear of weight loss. This is understandable but neglects significant other functional, developmental, and social variables that may increase the longer weaning is postponed, as delay in oral skills, delay in chewing and transitioning to solid food, possible social discrimination by the tube itself, and the overall absolute daily time spent being tube fed instead of being able to invest time in free play, communication, and social interactions. Beckenbach Reference Beckenbach40 demonstrated that formerly tube-dependent children made a developmental leap in their general development after successful weaning according to the “Graz Model of Tube Weaning.”
Long-term growth trajectories remain a critical consideration. Prior studies indicate that many children demonstrate catch-up growth after successful weaning. Reference Marinschek, Pahsini and Scheer32,Reference Shine, Finn and Allen37 Wong et al. Reference Wong, Loomba and Allen35 reported positive weight development in approximately 90% of children one year after treatment. However, postoperative catch-up growth in general is not consistently achievable in all children with CHD. Reference Argent, Balachandran and Vaidyanathan9,Reference Vaidyanathan, Radhakrishnan and Sarala41 Collectively, these findings highlight the importance of tube maintenance and tube management teams focusing on age-specific nutritional targets and offering close follow-ups, particularly in infants under one year.
Caregiver emotional burden emerged as a clinically relevant finding. Although group differences were not statistically significant, mothers reported higher levels of burden from tube feeding, consistent with previous studies. Reference Dellert, Hyams and Treem42–Reference Thorne, Radford and McCormick44 This discrepancy may reflect gender-specific caregiving roles, as mothers often assume greater responsibility for feeding. Given the high psychosocial stress experienced by families of children with CHD, integrating psychological support, which is already a key component of the “Graz Model of Tube Weaning,” is likely crucial for successful weaning and a smooth transition to age-appropriate family mealtimes. For ethical and practical reasons in this medically fragile population, caregiver burden was assessed solely through parent self-report during routine clinical intake rather than via standardised questionnaires. While this approach provided meaningful insight into family experiences, the absence of validated measures limits comparability with other studies and should be addressed in future research.
Thus said, the study has several strengths, including its prospective design, a comparatively large and medically complex cohort, and standardised implementation of the “Graz Model of Tube Weaning” across two formats and multiple countries. Further limitations include the absence of a control group, which restricts causal inference, particularly with respect to growth changes, and the lack of follow-up beyond the 35-day stability window. Treatment allocation was partly influenced by caregiver preferences and medical considerations, introducing potential selection bias; however, this approach may also enhance adherence and reflects ethical practice in medically fragile paediatric populations. Finally, several outcomes were caregiver reported and therefore subject to reporting bias, although self-report is not feasible for the age range represented. Another limitation is that the data for thirteen children were excluded due to incomplete datasets or early discontinuation, primarily for logistical or personal reasons rather than due to medical complications or treatment failure (more information see Appendix 2: flow chart of the study process). Consequently, endpoint data were missing, which prevented direct comparison between baseline and post-intervention outcomes. However, this is of limited relevance to the study’s objectives, since the analysis focused on the effectiveness of completed interventions. Furthermore, no serious adverse events occurred, and the exclusions reflect the practical challenges typically encountered in the implementation of real-world programmes rather than systematic bias. Although the Eating School group comprised just 19 participants, this sample size was deemed sufficient for a pilot study. Reference Porst45
Despite these limitations, the findings indicate that both telemedical and onsite versions of the “Graz Model of Tube Weaning” are safe and highly effective for tube-dependent children with CHD. They have the potential to improve not only nutritional status and oral skills but also autonomy, parent–child interactions, and overall quality of life.
Conclusion
Both on-site and telemedical tube weaning are equally effective and applicable for children with CHD, with a success rate above 98%. These findings support the implementation of tube weaning as early as medically appropriate to reduce adverse effects associated with prolonged enteral feeding and to alleviate caregiver burden. Although tube weaning is commonly accompanied by transient weight loss, growth challenges are inherent in children with CHD regardless of surgical status, and sustained catch-up growth is often difficult to achieve. Reference Argent, Balachandran and Vaidyanathan9,Reference Vaidyanathan, Radhakrishnan and Sarala41 While long-term outcomes were not assessed in the present study, existing evidence suggests that catch-up growth may occur following successful weaning, placing short-term weight loss into appropriate clinical context. A telemedical programme like Netcoaching program offers particular advantages for families of children with CHD, especially those anticipating additional medical procedures, as it allows weaning to occur within the home environment without time pressure or prolonged hospitalisation. Future research should focus on long-term follow-up, identification of predictors of successful weaning, and the development of age-specific weaning recommendations tailored to the unique metabolic and developmental needs of this population.
Supplementary material
The supplementary material for this article can be found at https://doi.org/10.1017/S1047951126113031.
Acknowledgements
We extend our deepest gratitude to all participated children and their families. Without them the study and resulting scientific implications would not have been possible. We are also grateful to Asa Russell, who additionally faithfully read and corrected the manuscript as a native speaker and colleague.
Author contributions
Karoline Pahsini, Sabine Marinschek and Elisabeth Beckenbach had full access to all of the data in the study and take responsibility for the integrity of the data and the accuracy of the data analysis.
Conceptualization: Karoline Pahsini, Sabine Marinschek, Elisabeth Beckenbach, Marion Russell, Sophie Stoesslein, Peter J. Scheer, Marguerite Dunitz-Scheer.
Methodology, Investigation, Data Curation, Writing - Original draft preparation, Visualization: Karoline Pahsini, Sabine Marinschek, Elisabeth Beckenbach.
Writing - Review & Editing, Supervision: Eva Reininghaus, Nina Dalkner, Marion Russell, Asa Russell, Sophie Stoesslein, Peter Scheer, Marguerite Dunitz-Scheer.
Financial support
This research did not receive any specific grant from funding agencies in the public, commercial, or not-for-profit sectors.
Competing interests
No conflict of interest
Ethical standard
The authors assert that all procedures contributing to this work were approved by the Ethics Committee of the Medical University of Graz (36-085 ex 23/24) and conducted in accordance with the Declaration of Helsinki of 1975, as revised in 2008. Data were collected during treatment. Written informed consent was obtained from all participants prior to their inclusion in the study via terms and conditions from the therapeutical center NoTube LLC.