Milk is an important commodity in the world. Approximately 10% of the world’s population is estimated to depend directly on dairy farming. In both developed and underdeveloped countries, the dairy sector promotes the sustainable livelihoods of small rural producers, generating income that supports their families (Siqueira, Reference Siqueira2019). According to data from the Food and Agriculture Organization of the United Nations (FAO), Brazil is the third-largest milk producer in the world, producing more than 34 billion litres per year, behind the United States and India (FAO, 2019; Rocha et al., Reference Rocha, Carvalho and de Resende2020).
Dairy products are one of the main sources of essential nutrients for a healthy diet. They contribute significantly to the protein, carbohydrate, lipid, and micronutrient requirements of the human diet and are primarily responsible for providing calcium to the human body (Dror and Allen, Reference Dror and Allen2014). In addition, they contribute to the intake of magnesium, selenium, riboflavin and vitamin B12 (Siqueira, Reference Siqueira2019).
Raw milk is an excellent culture medium for various microorganisms, both pathogenic and non-pathogenic (Vidal and Netto, Reference Vidal and Netto2021). For direct consumption of fluid milk, it must undergo a pasteurisation process mandated by legislation, with the aim of inactivating pathogenic microorganisms in the raw milk (Brasil, 2017). According to Brazilian legislation, after milk has been thermally processed, it must be subjected to an alkaline phosphatase (ALP; EC 3.1.3.1) test to guarantee the pasteurisation efficiency of the product (Brasil, 2018).
Currently, the official method for determining ALP activity in Brazil is an adaptation of Scharer’s visual colorimetric method (Scharer, Reference Scharer1938; Brasil, 2022). However, this technique has several limitations that compromise its application and reliability. The main problems are related to the instability of the reagents and the formation of interfering chromogenic compounds that lead to false negatives, as well as the potential for false positives caused by additives such as vanillin (Scharer, Reference Scharer1943). Its endpoint depends on a qualitative visual assessment of the colour change, a subjective process that can result in low reproducibility among analysts (Wehr and Frank, Reference Wehr and Frank2004). Despite these disadvantages, the method was used in the present study due to the requirements of Brazilian regulatory agencies and also because of its practical advantages of rapid execution and low cost.
Given the legislative requirements and to guarantee food safety for consumers, this study aimed to evaluate the official Brazilian method and compare it with the Scharer’s spectrophotometric method to provide tools for developing more sensitive methods or improve existing ones.
Material and methods
Experimental design
The study was conducted in three distinct stages. In the first stage, a comparative assessment was performed between the official Brazilian qualitative method and the quantitative spectrophotometric Scharer method. Initially, preliminary trials were carried out based on the addition of raw milk to thermally treated milk, which underpinned the development of the present research. Subsequently, still within the first stage, the accuracy of the official method was validated through the fortification of thermally treated milk with standard phenol solutions. The second stage investigated the influence of milk composition on ALP activity. Finally, the third stage consisted of applying both methods to compare analytical performance and verify the efficiency of the pasteurisation process in milk subjected to different thermal treatments.
Materials
Raw cow’s milk was purchased from two sources: Laticínio Bela Vista Ltda (Juiz de Fora, MG, Brazil) and a rural producer in Três Rios, RJ, Brazil. All milk samples were collected at the beginning of the same week in which they underwent heat treatment and analysis, and were kept refrigerated at 3 °C until use. The following analytical grade reagents were purchased from Sigma-Aldrich (Gillingham, Dorset, United Kingdom): disodium phenylphosphate dihydrate (purity ≥ 95.0%), 2,6-dichloroquinone-4-chlorimide (purity ≥ 95.0%), phenol (≥99.05%) and 1-butanol (99.8%). Anhydrous sodium carbonate, anhydrous sodium bicarbonate and copper (II) sulphate pentahydrate were obtained from CapLab® (São Paulo, SP, Brazil).
A stock solution of 1 mg ml−1 phenol was prepared in 0.1 mol l−1 hydrochloric acid for use in preparing the standard solutions for the analytical curve in Scharer’s spectrophotometric method, as well as for adding phenol to the milk solutions.
The solutions required for the application of qualitative and quantitative methods were prepared in accordance with the protocols detailed in the Supplementary Material.
Physicochemical and compositional analysis of raw milk
The pH of the raw milk was analysed using a benchtop PG1400 GEHAKA pH meter. The fat, protein and lactose contents were determined using an EkoMilk Cap-Lab milk analyser. The density was determined using a Cap-Lab thermolactodensimeter, and the dry matter (DM) was calculated using the Fleischmann formula (Pereira et al., Reference Pereira, da, Júnior and de2001). The defatted dry matter (DDM) was obtained by calculating the difference between the DM content and fat content.
Sample preparation with addition of raw milk phenol standard solution
To evaluate the sensitivity of the official Brazilian qualitative method and Scharer’s quantitative method, heat-treated milk solutions containing different concentrations of raw milk and standard phenol solution were analysed. The evaluations of the solutions with added raw milk were performed as preliminary tests to support the design of the studies in this research. All data are available in the Supplementary Material.
Preparation of heat-treated milk solutions by adding standard phenol solution
To validate the sensitivity of the methods, milk solutions with varying concentrations of standard phenol (1 mg ml−1 phenol) were prepared. The raw milk was initially heated to approximately 98 °C and then cooled to 21 °C to ensure complete inactivation of ALP. Standard phenol was then added to this heat-treated milk to achieve final concentrations ranging from 1 to 5 µg phenol ml−1 of milk.
Preparation of milk samples with different heat treatments
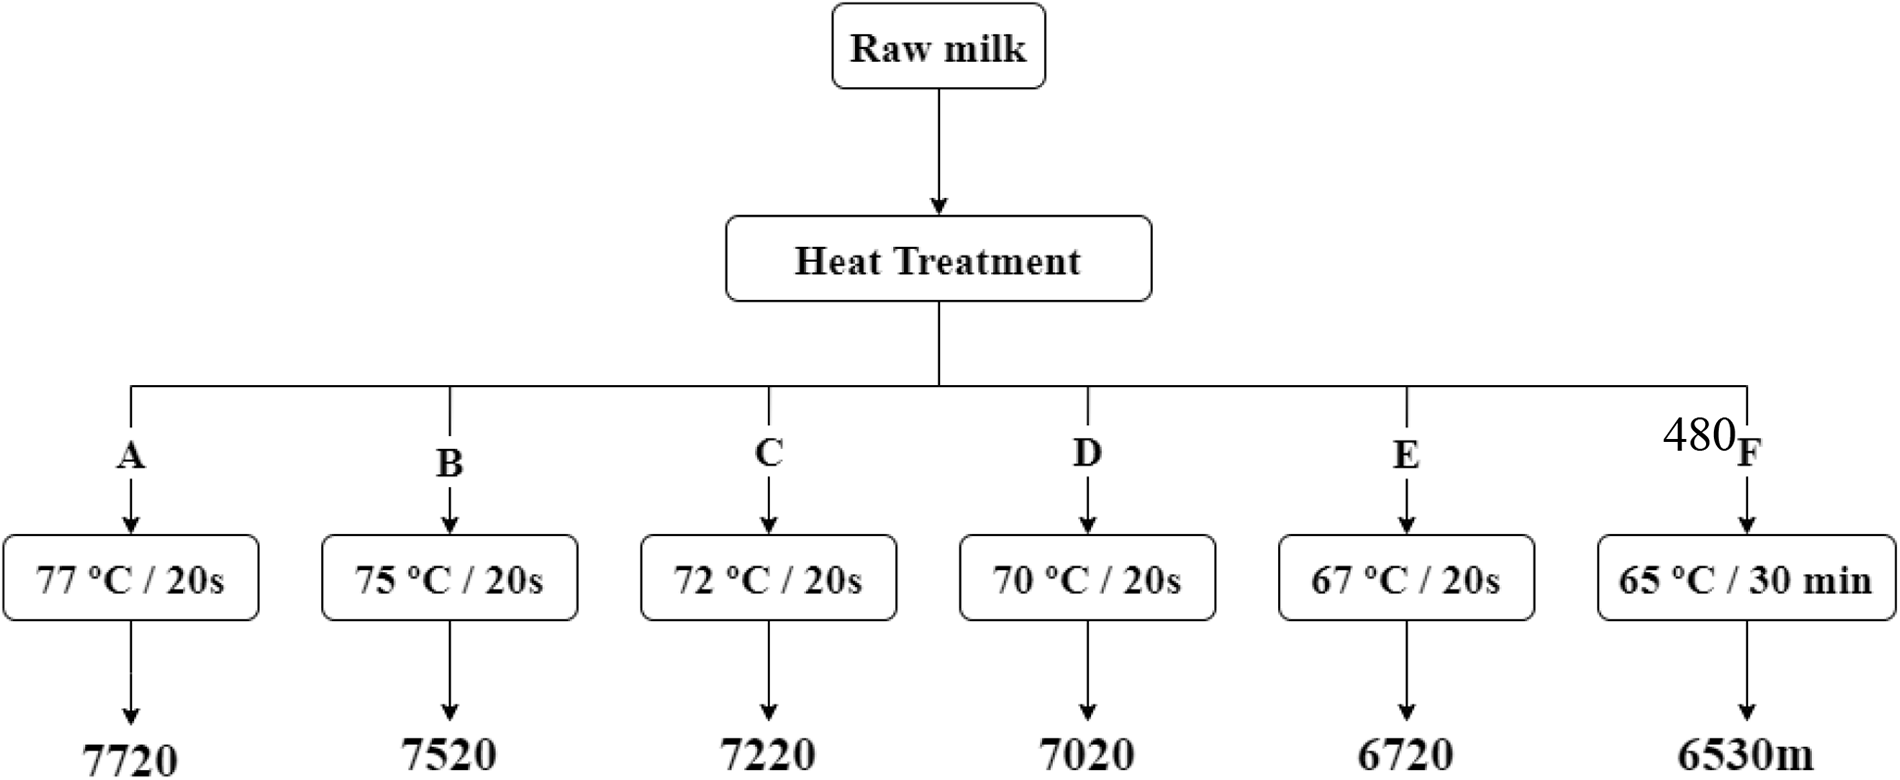
Heat treatments applied to the raw milk were conducted using a QUIMIS thermostatic bath, following the conditions outlined in the flowchart in Figure 1.
Flowchart of the heat-treatment conditions applied to raw milk. In the sample coding, the first two digits represent the heating temperature (ºC), and the last two digits represent the heating time. Thus, 7720 refers to the sample heated to 77 ºC for 20 s, 7520 – 75 ºC for 20 s, 7220 – 72 ºC for 20 s, 7020 – 70 ºC for 20 s, 6720 – 67 ºC for 20 s, and 6530 m – 65 ºC for 30 min.

The samples were prepared using 12 ml of untreated milk in glass test tubes with lids. The heating temperature was monitored with a calibrated digital thermometer inserted directly into the sample tube to ensure the target temperature was reached. Heating time was controlled with a digital stopwatch and measured only after the milk reached the target temperature. The average heating rate was 0.73 °C s−1. The heating process was terminated by removing the test tube from the bath and immediately placing it into an ice bath at 2 °C.
Using this procedure, solutions designated 7720 (77 °C for 20 s), 7520 (75 °C for 20 s), 7220 (72 °C for 20 s), 7020 (70 °C for 20 s), 6720 (67 °C for 20 s), and 6530 m (65 °C for 30 min) were prepared. In this coding, the first two digits represent the heating temperature (°C), and the last two digits represent the heating time (seconds, unless otherwise noted). For example, sample 7720 was heated to 77 °C for 20 s, while sample 6530 m was heated to 65 °C for 30 minutes.
Methods used to determine ALP activity in milk
ALP activity in milk samples was assessed using two colorimetric methods: a qualitative assay, following the official protocol established by the Ministério da Agricultura, Pecuária e Abastecimento (MAPA) (Brasil, 2022), and a quantitative assay, based on the Scharer spectrophotometric method described by the American Public Health Association (Wehr and Frank, Reference Wehr and Frank2004).
In both assays, the analytical principle relies on the hydrolysis of the monophosphoric ester bond of the disodium phenylphosphate substrate by the ALP enzyme, resulting in the liberation of phenol and phosphate. The liberated phenol subsequently reacts with the chromogenic reagent 2,6-dichloroquinone-4-chloroimide (CQC) in the presence of a catalyst to form the blue indophenol complex, the detection of which allows for the estimation of enzymatic activity (Rankin et al., Reference Rankin, Christiansen, Lee, Banavara and Lopez-Hernandez2010). This reaction is illustrated in Figure 2.
Chemical equation of the reaction involved in Scharer’s colorimetric method.

For the qualitative analysis using the official method, samples were initially homogenised at a room temperature of 21 °C. Aliquots of 500 µl were transferred into test tubes, to which 5 ml of the working substrate was added. The tubes were capped, agitated, and incubated in a thermostatically controlled water bath at 40 °C for 20 min. Subsequently, the tubes were cooled under running water, and six drops of CQC reagent and two drops of copper sulphate catalyst solution were added. The tubes were then returned to the water bath for a further 5 min. The procedure included positive (raw milk) and negative (boiled milk) controls. Results were read visually, where a blue colouration indicated a positive result for ALP, and a grey colouration indicated the absence of enzymatic activity (Brasil, 2022).
Quantitative determination via the Scharer method was performed by mixing 500 µl of the sample with 5 ml of working substrate in test tubes, followed by immediate incubation at 40 °C in a thermostatic bath for 15 min. After this period, 100 µl of CQC reagent and 100 µl of copper sulphate catalyst were added, and the mixture was incubated again at 40 °C for 5 min. To stop the reaction, the tubes were cooled in an ice bath at 2 °C, 5 ml of cold neutralised butanol was added, and the tubes were gently inverted four times. Subsequently, centrifugation was performed at 3,200 g for 5 min, and the supernatant organic phase containing the indophenol was read using a Shimadzu® UV1800 spectrophotometer at 650 nm. The phenol concentration was calculated using a standard analytical curve, with values equal to or greater than 1 µg phenol ml−1 indicating inadequate pasteurisation (Wehr and Frank, Reference Wehr and Frank2004).
Performance evaluation of Sharer’s quantitative method
The performance of the Scharer’s spectrophotometric method was evaluated based on its linearity using the coefficient of determination (R 2) and Pearson's correlation (r), and sensitivity using the limit of detection (LOD) and limit of quantification (LOQ). The linearity of the test was verified in the working range of 0.50–10.00 µg ml−1 of the phenol standard solution. The analytical curve was constructed using Microsoft Excel software, with the equation given by Abs = 0.0421C phenol + 0.0081.
The R 2 and r values were 0.9997 and 0.9998, respectively, confirming the linearity of the method. The LOD and LOQ were etermined in accordance with the guidelines established by the Agência Nacional de Vigilância Sanitária (ANVISA, 2017). These parameters were calculated using the simplified method (Equations 1 and 2) based on data from the analytical curve, where IC represents the slope of the curve and σ denotes the standard deviation of the y-intercept. The LOD and LOQ values obtained were 0.11 and 0.34 µg of phenol per ml of milk, respectively:
 \begin{equation}{\mathbf{LD}} = \,\frac{{3.3\, \times \,{{\sigma }}}}{{{\mathbf{IC}}}}\end{equation}
 \begin{equation}{\text{LQ}} = { }\frac{{10{ } \times {{ \sigma }}}}{{{\text{IC}}}}\end{equation}
Statistical analyses
All statistical analyses were conducted using R software (R Core Team 2024, version 4.2.1). The data were subjected to one-way analysis of variance (ANOVA) for a completely randomised design, and the means were compared using Tukey’s post-hoc test for Honestly Significant Difference. Statistical significance was set at P < 0.05.
Results and discussion
Evaluation of methods
The qualitative method was compared with the quantitative method to determine the concentration range (µg phenol ml−1 milk) within which the qualitative method detected the presence of ALP. Raw milk was added to heat-treated milk (inactivated ALP) at various concentrations to serve as preliminary tests. Validation of the concentration range was established by evaluating the addition of a standard phenol solution (1 µg phenol ml−1) to boiled milk.
Evaluation of ALP activity in milk samples with added raw milk
The evaluation of ALP activity in boiled milk fortified with raw milk was carried out as preliminary tests to support the development of this study. In these analyses, milk samples with 4.0% m/m fat and milk from a single producer with 5.2% m/m fat were used. The results available in the Supplementary Material (Supplementary Tables S1 and S2) indicated that fat content may influence the quantification of ALP activity (µg phenol ml−1). Based on these data available in the Supplementary Material, the accuracy of the qualitative and quantitative methods was subsequently evaluated by adding a standard phenol solution to boiled milk.
Evaluation of standard phenol added in to heat-treated milk
Given the lack of a direct relationship between the amount of raw milk and phenol concentration generated, a reliable visual detection parameter for the qualitative method (µg phenol ml−1) was developed by preparing solutions with varying concentrations of standard phenol (1 mg ml−1). The milk used to prepare these solutions had 4.5 ± 0.3 g 100 g−1 of fat, 8.5 ± 0.1 g 100 g−1 of DDM, 13.0 ± 0.1 g 100 g−1 of DM, 3.3 ± 0.1 g 100 g−1 of protein, a relative density of 1.029 ± 0.001 at 15 °C, and a pH of 6.7 ± 0.1. The results are summarised in Table 1.
Results of the official Brazilian qualitative and quantitative Scharer methods applied to heat-treated milk samples with varying concentrations of standard phenol solution added (n = 3)

* Concentration in µg phenol ml–1.
̶ Negative results for the ALP test. +Positive ALP test results.
Boiled milk refers to raw milk heated to 98 ºC in which ALP is inactivated. The phenol-containing samples represent milk solutions prepared by adding a standard phenol solution at the indicated concentrations to the heat-treated milk.
Lowercase letters (a–g) indicate the comparison of means between the samples. According to the T-test results, the theoretical and experimental concentrations were not significantly different (P > 0.05). Means were compared using Tukey’s test at a significance level of 0.05. Identical letters indicate no statistically significant difference (P > 0.05).
The qualitative method yielded a positive result from Sample 4 onwards. Therefore, the visual detection limit of the qualitative method was set at 4.13 µg of phenol ml−1 of milk. Scharer’s spectrophotometric method states that a detection limit above 1 µg of phenol ml−1 of milk is indicative of inadequate pasteurisation (Wehr and Frank, Reference Wehr and Frank2004). Thus, the qualitative method has a much lower sensitivity than the Scharer method. This can be a problem, as pasteurisation is mandatory to inactivate pathogenic microorganisms present in raw milk. If the ALP activity test results in a false negative, milk that has not been properly treated and may still contain active pathogens could be approved for consumption, compromising food safety.
The Scharer method is one of the most accepted methods for verifying the pasteurisation of milk in many countries worldwide and is the official method in Canada (Clawin-Rädecker et al., Reference Clawin-Rädecker, De Block, Egger, Willis, Mt and Messens2021). This indicates that the official Brazilian method detects the presence of the enzyme at concentrations much higher than those established using the international reference method.
Influence of milk composition on the determination of ALP activity
The composition of milk has been found to influence the assessment of ALP activity. In addition, because the fat content is prone to variation owing to various factors, such as seasonality, stage of lactation, feed, species, and animal health (Samková et al., Reference Samková, Špička, Pešek, Pelikánová and Hanuš2012; Chen et al., Reference Chen, Lewis and Grandison2014; Daley et al., Reference Daley, Armentano and Hanigan2022; Li et al., Reference Li, Ye and Singh2022), enzyme activity was compared in milk samples with three different fat levels. Comparison of the mean fat content of the milk samples revealed statistical differences (P < 0.05), while other components showed no statistical differences (Table 2).
Composition of the various types of milk used for comparing ALP activity

Table 2 Long description
The table has three columns: Semi-skimmed, Whole, High content. Row 1: FAT (g per 100 g) 0.8 plus or minus 0.1; 3.8 plus or minus 0.2; 5.3 plus or minus 0.1. Row 2: DDM (g per 100 g) 8.7 plus or minus 0.1; 8.7 plus or minus 0.3; 9.0 plus or minus 0.4. Row 3: DM (g per 100 g) 9.5 plus or minus 0.1; 12.5 plus or minus 0.5; 14.4 plus or minus 0.5. Row 4: DEN 1.033 plus or minus 0.001; 1.032 plus or minus 0.001; 1.031 plus or minus 0.002. Row 5: PRO (g per 100 g) 3.3 plus or minus 0.1; 3.4 plus or minus 0.1; 3.5 plus or minus 0.1. Row 6: LAC (g per 100 g) 4.6 plus or minus 0.1; 4.6 plus or minus 0.1; 4.8 plus or minus 0.2. Row 7: pH 6.7 plus or minus 0.1; 6.7 plus or minus 0.1; 6.7 plus or minus 0.1.
According to Tukey’s test at a significance level of 0.05, identical letters indicate that there are no statistically significant differences (P < 0.05). Capital letters (A–C) indicate a comparison of means between the components of different types of milk, as shown in the same row.
FAT, fat. DDM, defatted dry matter; DM, dry matter; DEN, relative density at 15 ºC; PRO, protein; LAC, lactose.
As ALP is a thermoresistant enzyme (Mckellar et al., Reference Mckellar, Modlert, Couture, Hughes, Mayers, Gleesonl and Rossj1994), its residual activity was assessed in samples subjected to various thermal treatments. Each milk type was subjected to the treatment conditions detailed in Figure 1 and evaluated using both qualitative and quantitative methods. The results are summarized in Table 3.
Comparison between the average residual ALP activities of the qualitative and quantitative methods (µg phenol ml–1) in milk samples with different compositions (n = 3)

Table 3 Long description
The table has four columns: Sample, Semi-skimmed, Whole and High content. Each category has qualitative and quantitative data. Row 1: Sample Raw milk, Semi-skimmed qualitative plus, quantitative 88.99 plus-minus 3.86; Whole qualitative plus, quantitative 82.00 plus-minus 30.52; High content qualitative plus, quantitative 97.64 plus-minus 13.52. Row 2: Sample 6720, Semi-skimmed qualitative plus, quantitative 12.15 plus-minus 8.73; Whole qualitative plus, quantitative 13.85 plus-minus 7.98; High content qualitative plus, quantitative 22.49 plus-minus 0.42. Row 3: Sample 7020, Semi-skimmed qualitative minus, quantitative 0.69 plus-minus 0.60; Whole qualitative minus, quantitative 1.36 plus-minus 0.48; High content qualitative minus, quantitative 2.81 plus-minus 0.56. Row 4: Sample 7220, Semi-skimmed qualitative minus, quantitative 0.64 plus-minus 0.16; Whole qualitative minus, quantitative 1.20 plus-minus 0.19; High content qualitative minus, quantitative 1.60 plus-minus 0.15. Row 5: Sample 7520, Semi-skimmed qualitative minus, quantitative 0.51 plus-minus 0.12; Whole qualitative minus, quantitative 1.15 plus-minus 0.30; High content qualitative minus, quantitative 1.73 plus-minus 0.47. Row 6: Sample 7720, Semi-skimmed qualitative minus, quantitative 0.36 plus-minus 0.23; Whole qualitative minus, quantitative 0.48 plus-minus 0.26; High content qualitative minus, quantitative 2.17 plus-minus 1.58. Row 7: Sample 6530 m, Semi-skimmed qualitative minus, quantitative 0.18 plus-minus 0.04; Whole qualitative minus, quantitative 1.19 plus-minus 0.43; High content qualitative minus, quantitative 1.07 plus-minus 0.34. Row 8: Sample Boiled milk, Semi-skimmed qualitative minus, quantitative 0.00 plus-minus 0.00; Whole qualitative minus, quantitative 0.00 plus-minus 0.00; High content qualitative minus, quantitative 0.00 plus-minus 0.00.
* Concentration in µg phenol ml–1.
In the sample coding, the first two digits represent the heating temperature (ºC), and the last two digits represent the heating time. Thus, 7720 refers to the sample heated to 77 ºC for 20 s, 7520–75 ºC for 20 s, 7220–72 ºC for 20 s, 7020–70 ºC for 20 s, 6720–67 ºC for 20 s, and 6530 m – 65 ºC for 30 min.
̶ Negative results for the ALP test. +Positive ALP test results.
According to Tukey’s test at a significance level of 0.05, equal letters indicate that there are no statistically significant differences (P > 0.05). Upper-case letters indicate comparisons of means between the different types of milk (same row), while lower-case letters indicate comparisons of means between the heat treatments (same column).
Regarding the qualitative analysis, positive results for ALP were observed exclusively in the 6720 samples. In contrast, sample 7020, characterised as under-pasteurised, yielded false-negative results across all evaluations performed on milk with varying fat contents. This indicates that the official method recommended by MAPA proved insufficient for certifying the efficiency of milk pasteurisation, highlighting limitations regarding its sensitivity to variations in the samples’ fat content.
Regarding the results from the spectrophotometric method, the semi-skimmed and whole milk samples (7020, 7220, and 7520) exhibited statistically significant differences (P < 0.05) in ALP activities, whereas sample 6530 m showed a statistically significant difference (P < 0.05) between semi-skimmed and whole milk. The high standard deviations observed for raw milk and the 6720 samples can be attributed to the fact that the mean enzymatic activities were derived from milk samples with distinct compositions and, consequently, variable initial ALP activities.
It was observed that ALP activity, indicated by phenol concentration, was higher in milk with a higher fat content. These results corroborate the findings of Painter and Bradley (Reference Painter and Bradley1997), who reported that an increase in milk fat results in increased residual ALP activity, and are further supported by Sharma and Rajput (Reference Sharma and Rajput2009), who reported that ALP activity in skimmed milk was ≈47% lower than in whole milk.
It is estimated that between 30% and 40% of ALP is adsorbed onto the fat globule membrane (Lu Q et al., Reference Lu Q, Piyasena and Mittal2001); therefore, the high levels of ALP activity in whole milk may indicate the protective effect of fat against thermal treatment (Painter and Bradley, Reference Painter and Bradley1997). Thus, the lower the fat content, the lower the protection, and the more effective the thermal treatment. This aligns with the findings of Angelino et al. (Reference Angelino, Christen, Penfield and Beattie1999), who demonstrated that the rate of ALP inactivation is dependent on fat content; specifically, milk with a higher fat content requires higher temperatures or prolonged heating times to inactivate the enzyme.
In short, it is clear that the composition of milk, particularly its fat content, influences the initial and residual (after heat treatment) activity of ALP.
Evaluation of ALP activity in milk during shelf-life
The main objective of evaluating ALP activity in the dairy industry is to verify the efficiency of pasteurisation (Andrén, Reference Andrén2021). Therefore, the residual activity of ALP in milk was investigated over a 72-h shelf-life in samples treated under different thermal conditions.
The milk samples were heat-treated according to the flowchart in Figure 1, and the residual activity of the enzyme was monitored at four different time points (T 0, T 24, T 48, and T 72), where T 0 represents the day the heat treatment was carried out, and T 24, T 48, and T 72 correspond to 24, 48, and 72 h after heat treatment, respectively.
The raw milk used to prepare the samples contained 3.8 ± 0.2 g 100 g−1 of fat, 8.7 ± 0.3 g 100 g−1 of DDM, 12.5 ± 0.5 g 100 g−1 of DM, 3.4 ± 0.1 g 100 g−1 of protein; its relative density at 15 °C and pH were 1.032 ± 0.001 and 6.7 ± 0.1, respectively. Table 4 lists the results of applying these methods.
Residual enzyme activities determined using qualitative and quantitative methods (µg phenol ml–1) to analyse milk samples subjected to different heat treatments and during shelf-life (n = 3)

Table 4 Long description
Columns: Sample; T0 Qualitative; T0 Quantitative asterisk; T24 Qualitative; T24 Quantitative asterisk; T48 Qualitative; T48 Quantitative asterisk; T72 Qualitative; T72 Quantitative asterisk. Row 1: Raw milk. Qualitative is plus at T0, T24, T48 and T72. Quantitative is 82.00 plus or minus 24.92 with superscript Aa at T0, 82.00 plus or minus 24.92 with superscript Aa at T24, 82.00 plus or minus 24.92 with superscript Aa at T48 and 82.00 plus or minus 24.92 with superscript Aa at T72. Row 2: 6720. Qualitative is plus at T0, T24, T48 and T72. Quantitative is 13.85 plus or minus 6.5 with superscript Ab at T0, 10.86 plus or minus 0.24 with superscript Ab at T24, 10.05 plus or minus 1.92 with superscript Ab at T48 and 8.10 plus or minus 2.60 with superscript Ab at T72. Row 3: 7020. Qualitative is minus at T0, T24, T48 and T72. Quantitative is 1.36 plus or minus 0.39 with superscript Ac at T0, 1.77 plus or minus 0.36 with superscript Ac at T24, 1.70 plus or minus 0.56 with superscript Ac at T48 and 2.08 plus or minus 1.84 with superscript Ab at T72. Row 4: 7220. Qualitative is minus at T0, T24, T48 and T72. Quantitative is 1.20 plus or minus 0.14 with superscript Ac at T0, 1.64 plus or minus 0.18 with superscript Ac at T24, 1.48 plus or minus 0.06 with superscript Ac at T48 and 2.54 plus or minus 1.77 with superscript Ab at T72. Row 5: 7520. Qualitative is minus at T0, T24, T48 and T72. Quantitative is 1.15 plus or minus 0.24 with superscript Ac at T0, 1.32 plus or minus 0.41 with superscript Ac at T24, 1.13 plus or minus 0.25 with superscript Ac at T48 and 2.22 plus or minus 2.16 with superscript Ab at T72. Row 6: 7720. Qualitative is minus at T0, T24, T48 and T72. Quantitative is 0.48 plus or minus 0.22 with superscript Ac at T0, 0.88 plus or minus 0.27 with superscript ABc at T24, 0.85 plus or minus 0.21 with superscript ABc at T48 and 1.95 plus or minus 0.58 with superscript Bb at T72. Row 7: 6530 m. Qualitative is minus at T0, T24, T48 and T72. Quantitative is 1.19 plus or minus 0.35 with superscript Ac at T0, 1.09 plus or minus 0.27 with superscript Ac at T24, 1.11 plus or minus 0.12 with superscript Ac at T48 and 1.57 plus or minus 1.11 with superscript Ab at T72. Row 8: Boiled milk. Qualitative is minus at T0, T24, T48 and T72. Quantitative is 0.00 plus or minus 0.00 with superscript Ad at T0, 0.00 plus or minus 0.00 with superscript Ad at T24, 0.00 plus or minus 0.00 with superscript Ad at T48 and 0.00 plus or minus 0.00 with superscript Ac at T72. Visible relationships across time: Raw milk quantitative values remain 82.00 plus or minus 24.92 at all four time points, with qualitative plus at all four time points. Boiled milk quantitative values remain 0.00 plus or minus 0.00 at all four time points, with qualitative minus at all four time points. Sample 6720 quantitative values decrease from 13.85 plus or minus 6.5 at T0 to 8.10 plus or minus 2.60 at T72, with qualitative plus at all four time points. Samples 7020, 7220, 7520, 7720 and 6530 m have qualitative minus at all four time points and higher quantitative values at T72 than at T0: 7020 from 1.36 plus or minus 0.39 to 2.08 plus or minus 1.84; 7220 from 1.20 plus or minus 0.14 to 2.54 plus or minus 1.77; 7520 from 1.15 plus or minus 0.24 to 2.22 plus or minus 2.16; 7720 from 0.48 plus or minus 0.22 to 1.95 plus or minus 0.58; 6530 m from 1.19 plus or minus 0.35 to 1.57 plus or minus 1.11.
* Concentration in µg phenol ml–1.
̶ Negative results for the ALP test. +Positive ALP test results.
In the sample coding, the first two digits represent the heating temperature (ºC), and the last two digits represent the heating time. Thus, 7720 refers to the sample heated to 77 ºC for 20 s, 7520–75 ºC for 20 s, 7220–72 ºC for 20 s, 7020–70 ºC for 20 s, 6720–67 ºC for 20 s, and 6530 m – 65 ºC for 30 min.
T 0: Day of heat treatment; T 24: 24 h after heat treatment; T 48: 48 h after heat treatment; T 72: 72 h after heat treatment.
According to Tukey’s test at a significance level of 0.05, identical letters indicate no statistical difference (2P > 0.05). Uppercase letters indicate comparisons of means between milk storage times (same row), while lowercase letters indicate comparisons of means between heat treatments (same column).
According to Tukey’s test, at a significance level of 5%, the samples showed no statistical difference (P > 0.05) in ALP activities throughout the shelf life, with the exception of sample 7720, which exhibited a difference 24 h after milk processing (T 24). In this case, the residual enzyme activity increased over time. In other cases, the ALP activity only slightly varied over the evaluation period.
With regard to heat treatment, only sample 6720 showed a significant difference (P < 0.05) compared with the other samples. This indicates that at a temperature of 70 °C, the heat treatment had a similar inactivating effect on the enzyme.
According to Scharer’s quantitative method (Wehr and Frank, Reference Wehr and Frank2004), 1 µg of phenol per ml of milk (or higher) is indicative of inadequate pasteurisation. In the qualitative method, a negative result indicates that the milk has been properly pasteurised, whereas a positive result indicates that it has not been pasteurised, or that it has been contaminated with raw milk after the thermal treatment process (Brasil, 2022).
Thus, the samples subjected to LTLT (6530 m) or HTST (7220 and 7520) pasteurisation exhibited residual ALP activities greater than 1 µg of phenol ml−1 at T0, indicating false-positive results. Only the sample treated at the highest temperature (7720) showed residual ALP activity below 1 µg of phenol ml−1. Therefore, the limit established by this method is inadequate for verifying the pasteurisation of these milk samples, highlighting the need for a new ALP activity threshold to accurately assess milk pasteurisation.
The data in Table 4 show that only sample 6720 tested positive for ALP. The under-pasteurised sample 7020 produced false-negative results at all analysis times. This indicates that the official method adopted by MAPA is unsuitable for verifying the effective pasteurisation of milk.
Therefore, more sensitive methods should be evaluated and adopted to ensure proper milk pasteurisation, thereby guaranteeing its safety for consumption.
Conclusion
The qualitative method was found to be insufficiently sensitive, as it only yielded positive results for samples with an estimated ALP activity greater than 4.13 µg of phenol ml−1. It has been shown that the composition of the milk used in the pasteurisation process influences the verification of residual enzyme activity, with fat content having a clear influence. The qualitative method did not prove to be effective in verifying the proper pasteurisation of the milk, as it tested negative for ALP in the under-pasteurised sample heat-treated at 70 °C for 20 s. In addition, the expression of the final result of Scharer’s spectrophotometric method was insufficient for verifying milk pasteurisation.
Supplementary material
The supplementary material for this article can be found at https://doi.org/10.1017/S0022029926101988.
Acknowledgements
This work was supported by the Fundação Coordenação de Aperfeiçoamento de Pessoal de Nível Superior (CAPES), Conselho Nacional de Desenvolvimento Científico e Tecnológico (CNPq) and Fundação de Amparo à Pesquisa do Estado de Minas Gerais (FAPEMIG).
Declaration of interest
None.
Statement of generative AI in scientific writing
None.