1 Introduction
The tear film contains a mixture of various proteins and other biomolecules secreted by the basal epithelial cells and the surrounding meibomian and lacrimal glands. The stability of this thin protective film is essential to the health of the eye as it shields the ocular surface from harmful environmental factors and pathogens (Selinger, Selinger, & Reed Reference Selinger, Selinger and Reed1979; Mantelli & Argueso Reference Mantelli and Argueso2008; Stevenson, Chauhan & Dana Reference Stevenson, Chauhan and Dana2012; Yañez-Soto et al.
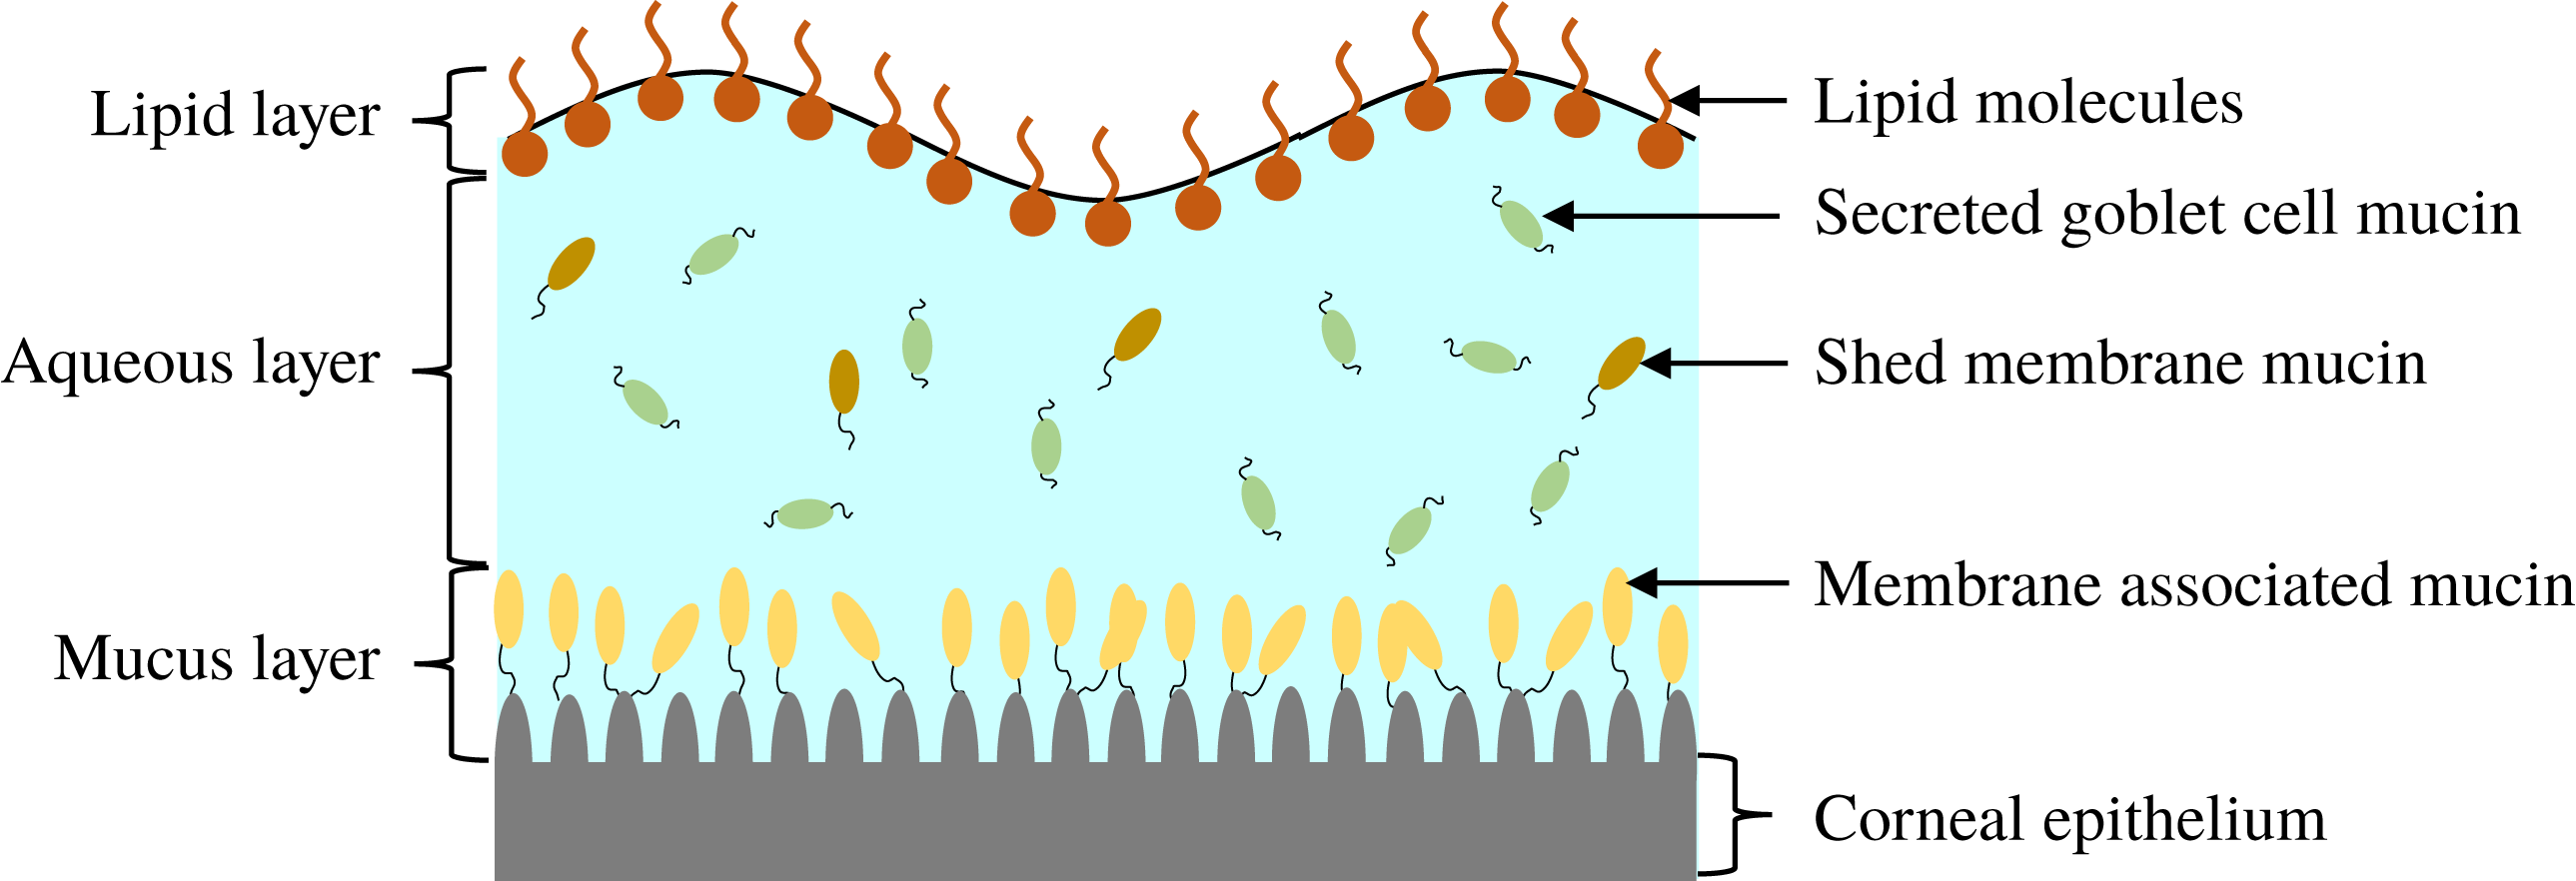
Reference Yañez-Soto, Mannis, Schwab, Li, Leonard, Abbott and Murphy2014). Traditionally, the tear film is visualized as comprising three distinct layers (Braun Reference Braun2012), as schematically shown in figure 1. The innermost mucus layer, 0.2–
 $0.5~\unicode[STIX]{x03BC}\text{m}$
in thickness, is composed of membrane-associated mucins (MAMs) that form the glycocalyx on the corneal epithelium (Gipson Reference Gipson2004), and serves as a barrier that protects the cornea from pathogens. The mucins also maintain hydration and wettability of the ocular surface (Hodges & Dartt Reference Hodges and Dartt2013). Outside the mucus layer lies the aqueous layer (2.5–
 $5~\unicode[STIX]{x03BC}\text{m}$
) that forms the bulk of the tear film. It consists primarily of aqueous tear fluid produced by the lacrimal glands with some gel-forming mucins secreted by the conjuctival goblet cells (Inatomi et al.
Reference Inatomi, Spurr-Michaud, Tisdle, Zhan, Feldman and Gipson1996). Finally, lipids secreted from the meibomian glands form a monolayer (0.02–
 $0.05~\unicode[STIX]{x03BC}\text{m}$
) atop the aqueous layer, which helps stabilize the air–tear interface and reduce evaporation (Craig & Tomlinson Reference Craig and Tomlinson1997; McCulley & Shine Reference McCulley and Shine1997; Bron et al.
Reference Bron, Tiffany, Gouveia, Yokoi and Voon2004).
Schematic illustration of the composition and structure of the pre-corneal tear film.
Our understanding of the hydrodynamics of the tear film has been summarized in a comprehensive review by Braun (Reference Braun2012). A focus of interest is the breakup process, which may occur through several different mechanisms (King-Smith, Begley & Braun Reference King-Smith, Begley and Braun2018). One is an instability driven by van der Waals attraction (Sharma & Ruckenstein Reference Sharma and Ruckenstein1985, Reference Sharma and Ruckenstein1986a ,Reference Sharma and Ruckenstein b ; De Wit, Gallez & Christov Reference De Wit, Gallez and Christov1994; Craster & Matar Reference Craster and Matar2009). Another is due to evaporation (Liu et al. Reference Liu, Begley, Chen, Bradley, Bonanno, McNamara, Nelson and Simpson2009; Peng et al. Reference Peng, Cerretani, Braun and Radke2014; Siddique & Braun Reference Siddique and Braun2015; Braun et al. Reference Braun, Driscoll, Begley, King-Smith and Siddique2018). Finally, tear films can also rupture very rapidly owing to non-uniformities in the lipid layer (Siddique & Braun Reference Siddique and Braun2015; Zhong et al. Reference Zhong, Ketelaar, Braun, Begley and King-Smith2018). Our work focuses on the first mechanism due to van der Waals attraction. As explained in the following, our primary goal is to reconcile previous van der Waals-based models with a more realistic description of the tear-film structure.
Most of our understanding of this mode of tear-film rupture has come from single-layer models (Zhang, Craster & Matar Reference Zhang, Craster and Matar2003b
; Braun & King-Smith Reference Braun and King-Smith2007; Heryudono et al.
Reference Heryudono, Braun, Driscoll, Maki, Cook and King-Smith2007; Winter, Anderson & Braun Reference Winter, Anderson and Braun2010; Deng, Braun & Driscoll Reference Deng, Braun and Driscoll2014; Siddique & Braun Reference Siddique and Braun2015) and two-layer models (TLMs) (Sharma & Ruckenstein Reference Sharma and Ruckenstein1985, Reference Sharma and Ruckenstein1986a
,Reference Sharma and Ruckenstein
b
; Zhang, Craster & Matar Reference Zhang, Craster and Matar2003a
, Reference Zhang, Craster and Matar2004). The former overlook the structure of the tear film and assign a uniform viscosity throughout its thickness. The latter posit an interface separating the aqueous and mucus layers, with its own interfacial tension as well as van der Waals interactions with the other surfaces. Most of these models assume a flat ocular surface and initially flat fluid interfaces, given the small thickness of the tear film relative to the radius of curvature (
 ${\sim}1$
cm) of the corneal globe (Braun Reference Braun2012). In the same vein, the thin-film or lubrication approximation is always adopted even though the interface may take on sharp curvatures towards the instant of rupture (Oron, Davis & Bankoff Reference Oron, Davis and Bankoff1997). The main findings of these models are that the tear film ruptures as the result of an instability driven by van der Waals attraction (De Wit et al.
Reference De Wit, Gallez and Christov1994; Craster & Matar Reference Craster and Matar2009), and that the instability is resisted to some extent by the interfacial tension as well as a Marangoni stress that arises from the lipids on the tear film that act as insoluble surfactants (Berger & Corrsin Reference Berger and Corrsin1974; Zhang et al.
Reference Zhang, Craster and Matar2003b
). Some studies have considered slip on the ocular surface (Zhang et al.
Reference Zhang, Craster and Matar2003b
; Braun & King-Smith Reference Braun and King-Smith2007; Heryudono et al.
Reference Heryudono, Braun, Driscoll, Maki, Cook and King-Smith2007), and found that slip facilitates the instability and promotes tear-film rupture. This scenario reflects the outcome of an infection in the mucus layer that may compromise the glycocalyx to induce slip on the substrate. Even though the human tear is known to be shear-thinning (Tiffany Reference Tiffany1991), non-Newtonian rheology has only been considered in a few studies (Zhang et al.
Reference Zhang, Craster and Matar2003a
, Reference Zhang, Craster and Matar2004; Jossic et al.
Reference Jossic, Lefevre, Loubens, Magnin and Corre2009; Braun et al.
Reference Braun, Usha, McFadden, Driscoll, Cook and King-Smith2012).
As noted by Braun (Reference Braun2012), more recent experiments have challenged the picture of the layered tear film. Mucin is found throughout the tear film (Prydal & Campbell Reference Prydal and Campbell1992; Chen et al. Reference Chen, Yamabayashi, Tanaka, Ohno and Tsukahara1997; Bron et al. Reference Bron, Tiffany, Gouveia, Yokoi and Voon2004; Gipson Reference Gipson2004; Govindarajan & Gipson Reference Govindarajan and Gipson2010). In the absence of a distinct boundary between the aqueous and the mucus layers, the mucin concentration forms a continuous profile within the entire tear film. To better reflect the structure of the tear film, we propose a continuous-viscosity model (CVM) as an alternative to the prevailing uniform single-layer models and TLMs. Drawing from analysis of miscible two-fluid flows in a different context (Ern, Charru & Luchini Reference Ern, Charru and Luchini2003; Usha, Tammisola & Govindarajan Reference Usha, Tammisola and Govindarajan2013; Ghosh, Usha & Sahu Reference Ghosh, Usha and Sahu2014), we introduce advection–diffusion for the mucin throughout a single, continuous tear film, which modifies the viscosity profile and in turn the hydrodynamics of the breakup.
Compared with existing models, the CVM enjoys several advantages. First, it avoids the difficulty of determining the properties of the putative mucus–aqueous interface, including the interfacial tension and van der Waals interactions (Sharma & Ruckenstein Reference Sharma and Ruckenstein1986a ; Zhang et al. Reference Zhang, Craster and Matar2003a ). Moreover, by varying the mucin diffusivity, one can model healthy tear films in which an immobile membrane-tethered mucin population maintains a permanent mucin gradient, as well as pathological conditions where mucin detachment and diffusion modify the viscosity profile and, in turn, the breakup process. Thus, the model can provide a potential linkage between the hydrodynamic features of the breakup and the onset and progression of eye infection. Finally, the model can be generalized to account for additional mechanisms in tear-film dynamics. For example, one can explicitly model the growth and proliferation of bacterial colonies in a similar fashion to mucin. Although at present we only consider viscosity as a function of the mucin concentration, viscoelasticity of the polymers can be introduced straightforwardly.
The rest of this paper is organized as follows. In § 2, we present the CVM for the tear film, with details of non-dimensionalization and parameter values. Then we present the linear stability analysis in § 3 and the nonlinear simulations in § 4. In § 5, we compare our model predictions with those of the TLM and with experimental data. Conclusions are drawn in § 6.
2 Mathematical formulation
2.1 Problem description
We model the entire tear film as a mucin solution in a Newtonian solvent, with an initial mucin concentration profile
 $C_{0}(y)$
. The lipids on the free surface are treated as insoluble surfactants that advect and diffuse on the interface, with a surface tension
 $\unicode[STIX]{x1D70E}$
that depends on the local surfactant concentration
 $\unicode[STIX]{x1D6E4}$
. We assume isothermal conditions and neglect evaporation from the free surface and loss of fluid or mucins due to osmosis from the ocular surface (Siddique & Braun Reference Siddique and Braun2015). The tear film rests on top of a rough impermeable substrate, the corneal epithelium, on which we impose the Navier slip condition with slip length
 $\unicode[STIX]{x1D6FD}$
. Starting from the initial profile
 $C_{0}(y)$
, the mucin concentration
 $C(x,y,t)$
evolves according to an advection–diffusion equation. The viscosity
 $\unicode[STIX]{x1D707}(x,y,t)$
is an algebraic function of
 $C(x,y,t)$
, and thus its profile evolves accordingly. The tear film has constant density
 $\unicode[STIX]{x1D70C}$
.
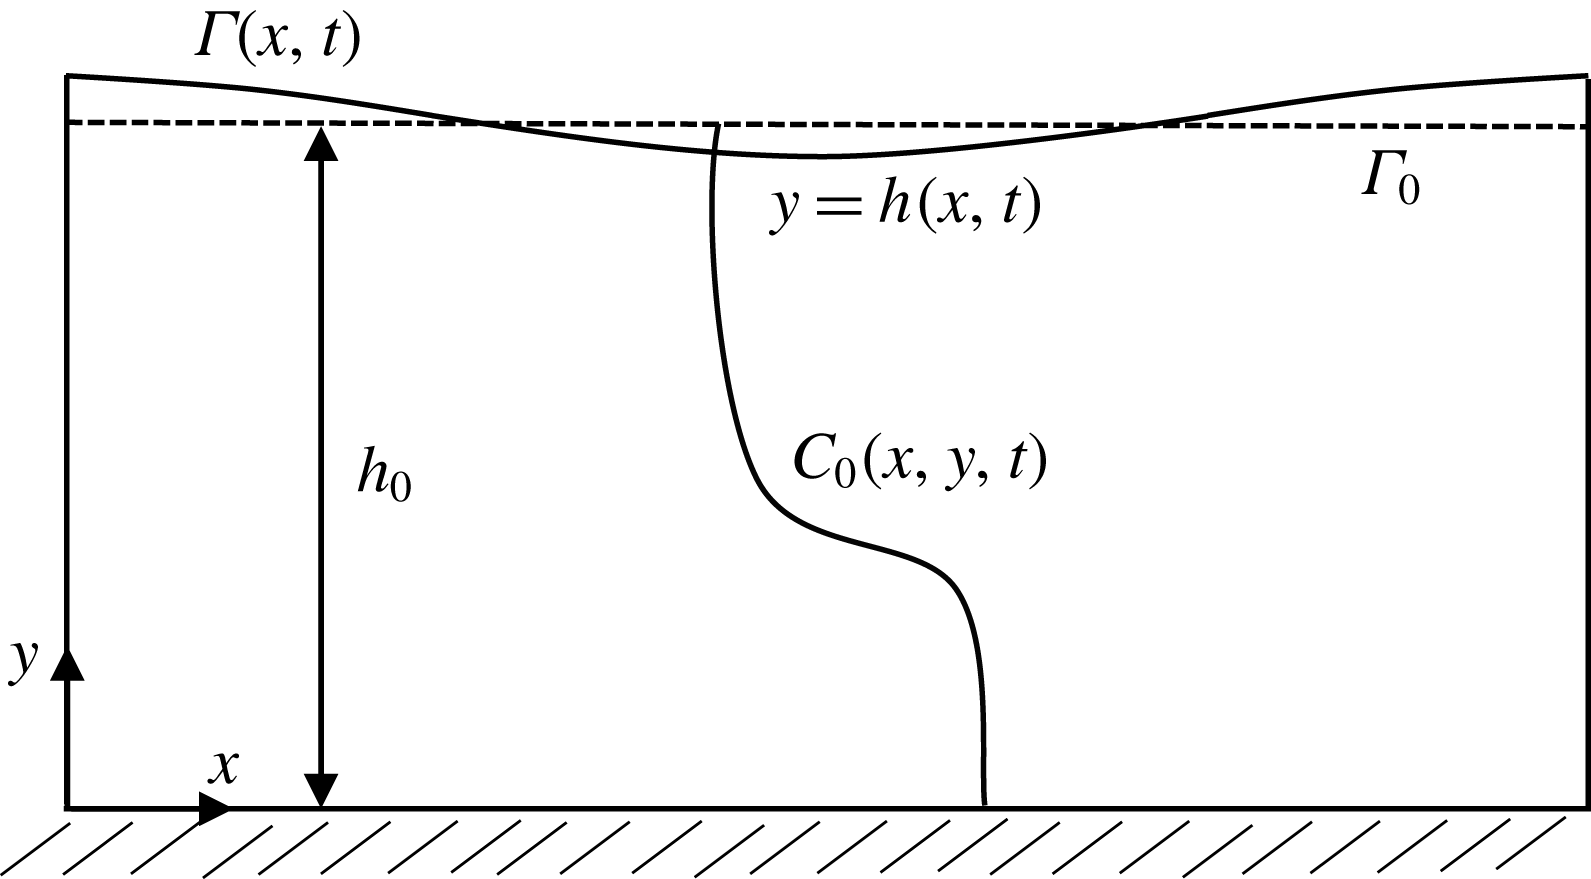
On the two-dimensional domain of figure 2 we pose the incompressible Navier–Stokes equations governing the flow dynamics together with an advection–diffusion equation describing the mucin redistribution:
 $$\begin{eqnarray}\displaystyle & \displaystyle \unicode[STIX]{x1D735}\boldsymbol{\cdot }\boldsymbol{u}=0, & \displaystyle\end{eqnarray}$$
 $$\begin{eqnarray}\displaystyle & \displaystyle \unicode[STIX]{x1D70C}\left(\frac{\unicode[STIX]{x2202}\boldsymbol{u}}{\unicode[STIX]{x2202}t}+\boldsymbol{u}\boldsymbol{\cdot }\unicode[STIX]{x1D735}\boldsymbol{u}\right)=-\unicode[STIX]{x1D735}(p+\unicode[STIX]{x1D719})+\unicode[STIX]{x1D735}\boldsymbol{\cdot }\unicode[STIX]{x1D749}, & \displaystyle\end{eqnarray}$$
 $$\begin{eqnarray}\displaystyle & \displaystyle \frac{\unicode[STIX]{x2202}C}{\unicode[STIX]{x2202}t}+\boldsymbol{u}\boldsymbol{\cdot }\unicode[STIX]{x1D735}C=D_{b}\unicode[STIX]{x1D6FB}^{2}C, & \displaystyle\end{eqnarray}$$
where
 $\boldsymbol{u}=(u,v)$
is the velocity vector and
 $D_{b}$
is the bulk diffusivity for the mucin transport. Here
 $p$
is pressure and
 $\unicode[STIX]{x1D719}=-{\mathcal{A}}/(6\unicode[STIX]{x03C0}h^{3})$
is the disjoining pressure due to van der Waals attraction, with
 ${\mathcal{A}}$
being the unretarded Hamaker constant (Ruckenstein & Jain Reference Ruckenstein and Jain1974; William & Davis Reference William and Davis1982). The deviatoric stress tensor is given by
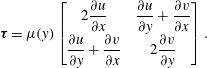 $$\begin{eqnarray}\unicode[STIX]{x1D749}=\unicode[STIX]{x1D707}(y)\left[\begin{array}{@{}cc@{}}2{\displaystyle \frac{\unicode[STIX]{x2202}u}{\unicode[STIX]{x2202}x}} & {\displaystyle \frac{\unicode[STIX]{x2202}u}{\unicode[STIX]{x2202}y}}+{\displaystyle \frac{\unicode[STIX]{x2202}v}{\unicode[STIX]{x2202}x}}\\ {\displaystyle \frac{\unicode[STIX]{x2202}u}{\unicode[STIX]{x2202}y}}+{\displaystyle \frac{\unicode[STIX]{x2202}v}{\unicode[STIX]{x2202}x}} & 2{\displaystyle \frac{\unicode[STIX]{x2202}v}{\unicode[STIX]{x2202}y}}\end{array}\right].\end{eqnarray}$$
Schematic representation of the computational domain of a tear film with the CVM.
The surface of the tear film
 $y=h(x,t)$
evolves according to the kinematic condition (Oron et al.
Reference Oron, Davis and Bankoff1997):
 $$\begin{eqnarray}\frac{\unicode[STIX]{x2202}h}{\unicode[STIX]{x2202}t}+\frac{\unicode[STIX]{x2202}}{\unicode[STIX]{x2202}x}\left(\int _{0}^{h(x,t)}u\,\text{d}y\right)=0.\end{eqnarray}$$
On the surface, the lipid concentration
 $\unicode[STIX]{x1D6E4}(x,t)$
is governed by the following surfactant transport equation (Zhang et al.
Reference Zhang, Craster and Matar2003a
):
 $$\begin{eqnarray}\frac{\unicode[STIX]{x2202}\unicode[STIX]{x1D6E4}}{\unicode[STIX]{x2202}t}+\unicode[STIX]{x1D735}_{s}\boldsymbol{\cdot }(\unicode[STIX]{x1D6E4}\boldsymbol{u}_{s})+\unicode[STIX]{x1D6E4}(\unicode[STIX]{x1D735}_{s}\boldsymbol{\cdot }\boldsymbol{n})(\boldsymbol{u}\boldsymbol{\cdot }\boldsymbol{n})=D_{s}\unicode[STIX]{x1D735}_{s}^{2}\unicode[STIX]{x1D6E4},\end{eqnarray}$$
where
 $\boldsymbol{n}$
is the normal vector on the surface,
 $\unicode[STIX]{x1D735}_{s}=(\boldsymbol{I}-\boldsymbol{n}\boldsymbol{n})\boldsymbol{\cdot }\unicode[STIX]{x1D735}$
is the surface divergence operator,
 $\boldsymbol{u}_{s}=\boldsymbol{u}-\boldsymbol{n}\boldsymbol{n}\boldsymbol{\cdot }\boldsymbol{u}$
is the tangential velocity vector and
 $D_{s}$
is the surface diffusivity for the insoluble surfactant. Following Zhang et al. (Reference Zhang, Craster and Matar2003a
), we assume that
 $\unicode[STIX]{x1D6E4}$
is dilute and the interfacial tension
 $\unicode[STIX]{x1D70E}$
decreases linearly with
 $\unicode[STIX]{x1D6E4}$
:
 $\unicode[STIX]{x1D70E}(\unicode[STIX]{x1D6E4})=\unicode[STIX]{x1D70E}_{m}-S\unicode[STIX]{x1D6E4}/\unicode[STIX]{x1D6E4}_{m}$
, where
 $\unicode[STIX]{x1D70E}_{m}$
is the maximal interfacial tension on a lipid-free interface,
 $S$
is the maximal spreading pressure and
 $\unicode[STIX]{x1D6E4}_{m}$
is the maximum lipid concentration. We have the normal and tangential stress balances at
 $y=h(x,t)$
:
 $$\begin{eqnarray}\displaystyle & \boldsymbol{n}\boldsymbol{\cdot }\unicode[STIX]{x1D749}\boldsymbol{\cdot }\boldsymbol{n}=p-\unicode[STIX]{x1D70E}(\unicode[STIX]{x1D735}\boldsymbol{\cdot }\boldsymbol{n}), & \displaystyle\end{eqnarray}$$
 $$\begin{eqnarray}\displaystyle & \boldsymbol{n}\boldsymbol{\cdot }\unicode[STIX]{x1D749}\boldsymbol{\cdot }\boldsymbol{t}=\unicode[STIX]{x1D735}\unicode[STIX]{x1D70E}\boldsymbol{\cdot }\boldsymbol{t}. & \displaystyle\end{eqnarray}$$
On the solid substrate
 $y=0$
, we impose the Navier slip boundary condition with a slip length
 $\unicode[STIX]{x1D6FD}$
:
 $$\begin{eqnarray}u=\unicode[STIX]{x1D6FD}\frac{\unicode[STIX]{x2202}u}{\unicode[STIX]{x2202}y},\quad v=0.\end{eqnarray}$$
For the mucin transport, a no-flux boundary condition is imposed on the top and bottom of the domain,
 $$\begin{eqnarray}\frac{\unicode[STIX]{x2202}C}{\unicode[STIX]{x2202}y}=0.\end{eqnarray}$$
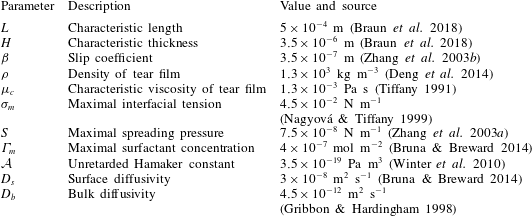
On the left and right ends of the domain, we impose zero-slope conditions as in previous studies (Zhang et al. Reference Zhang, Craster and Matar2003b ). The parameters of the model are summarized in table 1.
Parameters in the model, along with the references used for estimating their values.
Our treatment of the mucin (and hence viscosity) profile requires some explanation. In healthy tear films, the glycocalyx consists of MAMs that form a more or less immobile polymer-rich layer. Meanwhile, soluble mucins produced at the conjunctiva diffuse freely in the tear film. The onset of ocular diseases often compromises the glycocalyx, forcing the MAMs to shed their ectodomains into the aqueous medium (Albertsmeyer et al.
Reference Albertsmeyer, Kakkassery, Spurr-Michaud, Beeks and Gipson2010; Govindarajan & Gipson Reference Govindarajan and Gipson2010). The shed ectodomains then diffuse alongside the soluble mucins to elevate the bulk viscosity of the tear film. Our model does not represent the glycocalyx as a physical entity, and thus cannot capture its structural remodelling directly or distinguish between the membrane-bound and soluble species of mucins. Instead, we represent the healthy and diseased states of the mucin profile through the diffusivity
 $D_{b}$
. For the diseased state, where all mucins diffuse in the bulk of the tear film, we adopt the
 $D_{b}$
value for biopolymers having similar molecular weights to the mucins (Gribbon & Hardingham Reference Gribbon and Hardingham1998; Celli et al.
Reference Celli, Gregor, Turner, Afdhal, Bansil and Erramilli2005), direct measurement of mucin diffusivity being unavailable in the literature. This value, listed in table 1, marks the upper bound of
 $D_{b}$
as all mucins diffuse freely in this case, with a diffusion time scale of a second. Lower
 $D_{b}$
values will be used to maintain large gradients of mucin during the course of tear-film breakup. The healthy tear film will be represented by a much lower
 $D_{b}$
that produces a nearly permanent glycocalyx with little diffusion. Admittedly simplistic, this is an easy way to reflect the changing mucin profiles without modelling the kinetics of structural changes.
2.2 Non-dimensionalization
The above system of equations and boundary conditions are non-dimensionalized using the following scaling:
 $$\begin{eqnarray}\left.\begin{array}{@{}c@{}}\displaystyle x^{\ast }=\frac{x}{L},\quad y^{\ast }=\frac{y}{H},\quad h^{\ast }=\frac{h}{H},\quad \unicode[STIX]{x1D6FD}^{\ast }=\frac{\unicode[STIX]{x1D6FD}}{H},\\ \displaystyle u^{\ast }=\frac{u}{V},\quad v^{\ast }=\frac{Lv}{HV},\quad t^{\ast }=\frac{tV}{L},\quad p^{\ast }=\frac{p}{P},\\ \displaystyle \unicode[STIX]{x1D6E4}^{\ast }=\frac{\unicode[STIX]{x1D6E4}}{\unicode[STIX]{x1D6E4}_{m}},\quad \unicode[STIX]{x1D70E}^{\ast }=\frac{\unicode[STIX]{x1D70E}}{\unicode[STIX]{x1D70E}_{m}},\end{array}\right\}\end{eqnarray}$$
where
 $$\begin{eqnarray}V=\frac{{\mathcal{A}}}{6\unicode[STIX]{x03C0}\unicode[STIX]{x1D707}_{c}HL},\quad P=\frac{{\mathcal{A}}}{6\unicode[STIX]{x03C0}H^{3}}\end{eqnarray}$$
are the characteristic velocity and pressure, respectively. In the literature, the characteristic viscosity
 $\unicode[STIX]{x1D707}_{c}$
is often taken to be that of ‘the aqueous layer’ (Zhang et al.
Reference Zhang, Craster and Matar2003a
). In our CVM context, we define it as the viscosity at the top of the tear film. Here
 $H$
and
 $L$
are the characteristic thickness and horizontal length scale respectively of an undisturbed tear film. Following Braun et al. (Reference Braun, Driscoll, Begley, King-Smith and Siddique2018), we define
 $L$
from a balance between viscous and capillary forces; it is much smaller than the physical dimension of the ocular surface.
Dimensionless equations are obtained on applying the above scaling to (2.1)–(2.6). For simplicity, we use the same symbols after the scaling, and all expressions below are dimensionless unless otherwise stated:
 $$\begin{eqnarray}\displaystyle & \displaystyle u_{x}+v_{y}=0, & \displaystyle\end{eqnarray}$$
 $$\begin{eqnarray}\displaystyle & \unicode[STIX]{x1D716}^{2}Re(u_{t}+uu_{x}+vu_{y})=-(p+\unicode[STIX]{x1D719})_{x}+2\unicode[STIX]{x1D716}^{2}\unicode[STIX]{x1D707}u_{xx}+[\unicode[STIX]{x1D707}(u_{y}+\unicode[STIX]{x1D716}^{2}v_{x})]_{y}, & \displaystyle\end{eqnarray}$$
 $$\begin{eqnarray}\displaystyle & \unicode[STIX]{x1D716}^{4}Re(v_{t}+uv_{x}+vv_{y})=-p_{y}+\unicode[STIX]{x1D716}^{2}[\unicode[STIX]{x1D707}(u_{y}+\unicode[STIX]{x1D716}^{2}v_{x})]_{x}+2\unicode[STIX]{x1D716}^{2}(\unicode[STIX]{x1D707}v_{y})_{y}, & \displaystyle\end{eqnarray}$$
 $$\begin{eqnarray}\displaystyle & \displaystyle C_{t}+uC_{x}+vC_{y}=\frac{1}{Pe_{b}}\left(C_{xx}+\frac{1}{\unicode[STIX]{x1D716}^{2}}C_{yy}\right), & \displaystyle\end{eqnarray}$$
where subscripts
 $t$
,
 $x$
and
 $y$
indicate partial derivatives with respect to that variable,
 $\unicode[STIX]{x1D716}=H/L$
is the aspect ratio of the tear film,
 $Re=\unicode[STIX]{x1D70C}VL/\unicode[STIX]{x1D707}_{c}$
is the Reynolds number and
 $Pe_{b}=VL/D_{b}$
is the Péclet number for bulk mucin diffusion. The boundary conditions are
 $u=\unicode[STIX]{x1D6FD}u_{y}$
,
 $v=0$
and
 $C_{y}=0$
at
 $y=0$
(substrate), and the following at the free surface
 $y=h(x,t)$
:
 $$\begin{eqnarray}\displaystyle & \displaystyle h_{t}+\left(\int _{0}^{h(x,t)}u\,\text{d}y\right)_{x}=0, & \displaystyle\end{eqnarray}$$
 $$\begin{eqnarray}\displaystyle & \displaystyle \unicode[STIX]{x1D6E4}_{t}+\unicode[STIX]{x1D735}_{s}\boldsymbol{\cdot }(\unicode[STIX]{x1D6E4}\boldsymbol{u}_{s})+\unicode[STIX]{x1D6E4}(\unicode[STIX]{x1D735}_{s}\boldsymbol{\cdot }\boldsymbol{n})(\boldsymbol{u}\boldsymbol{\cdot }\boldsymbol{n})=\frac{1}{Pe_{s}}\unicode[STIX]{x1D735}_{s}^{2}\unicode[STIX]{x1D6E4}, & \displaystyle\end{eqnarray}$$
 $$\begin{eqnarray}\displaystyle & \displaystyle p(1+\unicode[STIX]{x1D716}^{2}h_{x}^{2})=\frac{2\unicode[STIX]{x1D716}^{2}\unicode[STIX]{x1D707}}{1+\unicode[STIX]{x1D716}^{2}h_{x}^{2}}[\unicode[STIX]{x1D716}^{2}u_{x}h_{x}^{2}+v_{y}-(u_{y}+\unicode[STIX]{x1D716}^{2}v_{x})h_{x}]-\frac{{\mathcal{C}}h_{xx}}{(1+\unicode[STIX]{x1D716}^{2}h_{x}^{2})^{1/2}}, & \displaystyle\end{eqnarray}$$
 $$\begin{eqnarray}\displaystyle & \displaystyle \unicode[STIX]{x1D707}[(1-\unicode[STIX]{x1D716}^{2}h_{x}^{2})(u_{y}+\unicode[STIX]{x1D716}^{2}v_{x})-4\unicode[STIX]{x1D716}^{2}h_{x}u_{x}]=-\frac{\unicode[STIX]{x1D716}\,Ma\,\unicode[STIX]{x1D6E4}_{x}}{Ca}(1+\unicode[STIX]{x1D716}^{2}h_{x}^{2})^{1/2}, & \displaystyle\end{eqnarray}$$
 $$\begin{eqnarray}\displaystyle & C_{y}=0, & \displaystyle\end{eqnarray}$$
where
 $Pe_{s}=VL/D_{s}$
is the surface Péclet number for the surfactant diffusion,
 $Ma=(\unicode[STIX]{x1D6E4}_{m}/\unicode[STIX]{x1D70E}_{m})(\unicode[STIX]{x2202}\unicode[STIX]{x1D70E}/\unicode[STIX]{x2202}\unicode[STIX]{x1D6E4})$
is the Marangoni number,
 $Ca=\unicode[STIX]{x1D707}_{c}V/\unicode[STIX]{x1D70E}_{m}$
is the capillary number and
 ${\mathcal{C}}=\unicode[STIX]{x1D716}^{3}/Ca$
(Sharma & Ruckenstein Reference Sharma and Ruckenstein1986a
,Reference Sharma and Ruckenstein
b
; Oron et al.
Reference Oron, Davis and Bankoff1997).
2.3 Thin-film approximation
Since the tear film is very thin relative to its transverse dimension, with an aspect ratio
 $\unicode[STIX]{x1D716}\ll 1$
, we can neglect the inertial and the higher-order
 $\unicode[STIX]{x1D716}$
terms. Thus, using the lubrication approximation (Oron et al.
Reference Oron, Davis and Bankoff1997), we obtain the following set of equations at the leading order in
 $\unicode[STIX]{x1D716}$
:
 $$\begin{eqnarray}\displaystyle & u_{x}+v_{y}=0, & \displaystyle\end{eqnarray}$$
 $$\begin{eqnarray}\displaystyle & -p_{x}-\unicode[STIX]{x1D719}_{x}+(\unicode[STIX]{x1D707}u_{y})_{y}=0, & \displaystyle\end{eqnarray}$$
 $$\begin{eqnarray}\displaystyle & p_{y}=0, & \displaystyle\end{eqnarray}$$
 $$\begin{eqnarray}\displaystyle & C_{t}+uC_{x}+vC_{y}=C_{yy}/\unicode[STIX]{x1D6E5}_{b}, & \displaystyle\end{eqnarray}$$
where
 $\unicode[STIX]{x1D6E5}_{b}=\unicode[STIX]{x1D716}^{2}Pe_{b}$
is the rescaled bulk Péclet number. As explained by Oron et al. (Reference Oron, Davis and Bankoff1997),
 $\unicode[STIX]{x1D6E5}_{b}$
can be
 $O(1)$
despite the appearance of
 $\unicode[STIX]{x1D716}^{2}$
, in the limit of very large
 $Pe_{b}$
or very small
 $D_{b}$
, which is relevant to the case at hand. Thus, the
 $\unicode[STIX]{x1D6E5}_{b}$
term is retained to account for the mucin diffusion in the
 $y$
direction. The above equations are subject to the following boundary conditions.
At
 $y=0$
,
 $$\begin{eqnarray}u=\unicode[STIX]{x1D6FD}u_{y},\quad v=0,\quad C_{y}=0.\end{eqnarray}$$
At
 $y=h(x,t)$
,
 $$\begin{eqnarray}\displaystyle & \displaystyle h_{t}+\left(\int _{0}^{h(x,t)}u\,\text{d}y\right)_{x}=0, & \displaystyle\end{eqnarray}$$
 $$\begin{eqnarray}\displaystyle & \displaystyle \unicode[STIX]{x1D6E4}_{t}+(u_{s}\unicode[STIX]{x1D6E4})_{x}=\frac{\unicode[STIX]{x1D6E4}_{xx}}{Pe_{s}}, & \displaystyle\end{eqnarray}$$
 $$\begin{eqnarray}\displaystyle & p=-{\mathcal{C}}h_{xx}, & \displaystyle\end{eqnarray}$$
 $$\begin{eqnarray}\displaystyle & \unicode[STIX]{x1D707}u_{y}=-{\mathcal{M}}\unicode[STIX]{x1D6E4}_{x}, & \displaystyle\end{eqnarray}$$
 $$\begin{eqnarray}\displaystyle & C_{y}=0, & \displaystyle\end{eqnarray}$$
where
 ${\mathcal{M}}=\unicode[STIX]{x1D716}\,Ma/Ca$
is the rescaled ratio of Marangoni to capillary number, and it reflects the surfactant effects on the evolution of the free surface. Both the linear stability analysis and nonlinear simulations discussed in the following are based on the above set of equations after the lubrication approximation has been applied.
3 Linear stability analysis
We first carry out a linear stability analysis of (2.22)–(2.31). Initially the tear film is flat and stationary, with a height
 $h_{0}=1$
and a uniform surfactant concentration
 $\unicode[STIX]{x1D6E4}_{0}$
. Small perturbations are added to the initial state in the following form:
 $$\begin{eqnarray}\displaystyle & u=\tilde{u} (y)\text{e}^{\text{i}kx+\unicode[STIX]{x1D714}t}, & \displaystyle\end{eqnarray}$$
 $$\begin{eqnarray}\displaystyle & v=\tilde{v}(y)\text{e}^{\text{i}kx+\unicode[STIX]{x1D714}t}, & \displaystyle\end{eqnarray}$$
 $$\begin{eqnarray}\displaystyle & h=h_{0}+\tilde{h}\text{e}^{\text{i}kx+\unicode[STIX]{x1D714}t}, & \displaystyle\end{eqnarray}$$
 $$\begin{eqnarray}\displaystyle & \unicode[STIX]{x1D6E4}=\unicode[STIX]{x1D6E4}_{0}+\tilde{\unicode[STIX]{x1D6E4}}\text{e}^{\text{i}kx+\unicode[STIX]{x1D714}t}, & \displaystyle\end{eqnarray}$$
 $$\begin{eqnarray}\displaystyle & C=C_{0}(y)+\tilde{C}(y)\text{e}^{\text{i}kx+\unicode[STIX]{x1D714}t}. & \displaystyle\end{eqnarray}$$
The tilde quantities are assumed to be much smaller than the base-state variables, e.g.
 $|\tilde{h}|\ll h_{0}$
. The initial concentration profile
 $C_{0}(y)$
is arbitrary. This allows us to analyse the effect of an arbitrary initial viscosity profile
 $\unicode[STIX]{x1D707}_{0}(y)$
on the stability of the thin film. Since we restrict ourselves to a two-dimensional analysis, it is convenient to define a stream function
 $$\begin{eqnarray}\unicode[STIX]{x1D713}=\tilde{\unicode[STIX]{x1D713}}(y)\text{e}^{\text{i}kx+\unicode[STIX]{x1D714}t},\end{eqnarray}$$
such that
 $u=\unicode[STIX]{x2202}\unicode[STIX]{x1D713}/\unicode[STIX]{x2202}y$
and
 $v=-\unicode[STIX]{x2202}\unicode[STIX]{x1D713}/\unicode[STIX]{x2202}x$
. Substituting the above into the governing equations and retaining terms that are linear in the perturbations, we reduce the system to ordinary differential equations (ODEs) for
 $\tilde{\unicode[STIX]{x1D713}}$
and
 $\tilde{C}$
,
 $$\begin{eqnarray}\displaystyle & (\unicode[STIX]{x1D707}_{0}\tilde{\unicode[STIX]{x1D713}}_{yy})_{yy}=0, & \displaystyle\end{eqnarray}$$
 $$\begin{eqnarray}\displaystyle & \displaystyle \unicode[STIX]{x1D714}\tilde{C}+\frac{k^{2}\tilde{C}}{Pe_{b}}-\frac{\tilde{C}_{yy}}{\unicode[STIX]{x1D716}^{2}Pe_{b}}=\text{i}k\tilde{\unicode[STIX]{x1D713}}, & \displaystyle\end{eqnarray}$$
with the following boundary conditions:
 $$\begin{eqnarray}\unicode[STIX]{x1D707}_{0_{y}}\tilde{\unicode[STIX]{x1D713}}_{yy}+\unicode[STIX]{x1D707}_{0}\tilde{\unicode[STIX]{x1D713}}_{yyy}=-\frac{k^{2}}{\unicode[STIX]{x1D714}}\left(\frac{3}{h_{0}^{4}}-{\mathcal{C}}k^{2}\right)\tilde{\unicode[STIX]{x1D713}},\quad \unicode[STIX]{x1D707}\tilde{\unicode[STIX]{x1D713}}_{yy}=-\frac{k^{2}{\mathcal{M}}\unicode[STIX]{x1D6E4}_{0}}{\left(\unicode[STIX]{x1D714}+{\displaystyle \frac{k^{2}}{Pe_{s}}}\right)}\tilde{\unicode[STIX]{x1D713}_{y}},\quad \tilde{C}_{y}=0\quad \text{at}~y=h_{0},\end{eqnarray}$$
 $$\begin{eqnarray}\tilde{\unicode[STIX]{x1D713}}=0,\quad \tilde{\unicode[STIX]{x1D713}_{y}}=\unicode[STIX]{x1D6FD}\tilde{\unicode[STIX]{x1D713}_{yy}},\quad \tilde{C}_{y}=0\quad \text{at}~y=0.\end{eqnarray}$$
Equations (3.7)–(3.10) form an eigenvalue problem for
 $\unicode[STIX]{x1D714}$
, and its real part determines the linear stability of the thin film. Note that as a consequence of zero mean flow in the film, the stream function
 $\tilde{\unicode[STIX]{x1D713}}$
is decoupled from the concentration
 $\tilde{C}$
. Thus, the linear stability of the film can be solved from (3.7) along with the boundary conditions; it will depend only on the initial viscosity profile. Then (3.8) and its boundary conditions can be solved for the evolution of the concentration and viscosity profiles.
Comparisons between numerically computed dispersion relations and analytical solutions. (a) For a uniform viscosity profile
 $\unicode[STIX]{x1D707}_{0}=1$
with surface Péclet number
 $Pe_{s}=0.1$
. The analytical solution is from Zhang et al. (Reference Zhang, Craster and Matar2003b
). (b) For a tanh viscosity profile with a sharp transition layer, with parameters
 $\unicode[STIX]{x1D6FF}_{m}=0.01$
,
 $h_{m}=0.2$
,
 $\unicode[STIX]{x1D707}_{r}=2$
and
 $Pe_{s}=100$
. The analytic solution is from the TLM of Zhang et al. (Reference Zhang, Craster and Matar2003a
). The other parameters are
 $h_{0}=1$
,
 $\unicode[STIX]{x1D6E4}_{0}=0.5$
,
 ${\mathcal{C}}=1$
,
 ${\mathcal{M}}=1$
and
 $\unicode[STIX]{x1D6FD}=0.1$
.

Equations (3.7)–(3.10) admit analytical solutions for uniform, linear and Heaviside viscosity profiles. For an arbitrary viscosity profile, we employ a Chebyshev collocation technique to solve the eigenvalue problem numerically. If the viscosity profile contains a thin layer of steep gradient, as occurs across the diffuse outer boundary of the mucin layer, we use a coordinate transformation to ‘stretch out’ the layer for adequate resolution at moderate numerical cost. The accuracy of the numerical procedure is established by comparing the numerical solutions to analytical ones for two simple viscosity profiles. For a uniform viscosity profile, our numerical solution agrees closely with the analytical solution of Zhang et al. (Reference Zhang, Craster and Matar2003b
) (figure 3
a). To approximate a two-layer setup with a sharp jump in viscosity, we use a tanh profile with a thin transition layer of thickness
 $\unicode[STIX]{x1D6FF}_{m}$
at a height of
 $y=h_{m}$
:
 $$\begin{eqnarray}\unicode[STIX]{x1D707}_{0}(y)=1+\frac{\unicode[STIX]{x1D707}_{r}-1}{2}\left(1-\tanh {\displaystyle \frac{y-h_{m}}{\unicode[STIX]{x1D6FF}_{m}}}\right),\end{eqnarray}$$
where
 $\unicode[STIX]{x1D707}_{0}$
is scaled by the viscosity at the top of the aqueous layer and
 $\unicode[STIX]{x1D707}_{r}$
is the viscosity ratio between the bottom and the top of the tear film. Similar viscosity profiles were used in recent studies on stability of viscosity-stratified free-surface flows down an incline (Usha et al.
Reference Usha, Tammisola and Govindarajan2013). On the other hand, we take the analytical solution of a TLM (Zhang et al.
Reference Zhang, Craster and Matar2003a
) and put to zero the interfacial tension between the two layers as well as the van der Waals attractions between the liquid interface and both the top and the bottom boundaries (
 ${\mathcal{C}}_{m}=0$
,
 ${\mathcal{A}}_{1,2,4}=0$
as defined in appendix A). Thus, the TLM and the continuous tanh model approach a common limit, and the dispersion relations are again in excellent agreement in this limit (figure 3
b). These tests validate the numerical procedure for solving the eigenvalue problem.
3.1 Effect of the viscosity profile
We examine the linear instability of four different viscosity profiles with the same average viscosity: a uniform profile, two linear profiles with opposite slopes and a tanh profile (figure 4
a). To compare the growth rate
 $\unicode[STIX]{x1D714}$
among the four profiles, we need to adjust its scaling somewhat. Our general scheme of non-dimensionalization (2.12) uses the viscosity
 $\unicode[STIX]{x1D707}_{c}$
at the top of the tear film to define a time scale. Here the four viscosity profiles share the same average viscosity but not the same
 $\unicode[STIX]{x1D707}_{c}$
. To scale
 $\unicode[STIX]{x1D714}$
uniformly, we have made an exception to the general scheme by adopting, for all four cases, the time scale based on the top viscosity of the tanh profile. In such a scheme, the common average viscosity
 $\unicode[STIX]{x1D707}_{a}=1.5$
for all four profiles (figure 4
a).
(a) Four different initial viscosity profiles, each with a mean dimensionless viscosity of 1.5. For the tanh viscosity profile,
 $\unicode[STIX]{x1D707}_{r}=2$
,
 $h_{m}=0.5$
and
 $\unicode[STIX]{x1D6FF}_{m}=0.01$
. (b) Dispersion relations for the four viscosity profiles. The parameter values are
 $h_{0}=1$
,
 $\unicode[STIX]{x1D6E4}_{0}=0.5$
,
 ${\mathcal{C}}=1$
,
 ${\mathcal{M}}=1$
,
 $\unicode[STIX]{x1D6FD}=0.1$
and
 $Pe_{s}=100$
.

Figure 4(b) shows that the viscosity distribution has a marked effect on the growth rate of the instability. If the more viscous fluid is situated at the bottom of the film, the growth rate is lower and the film is relatively more stable. Between the two profiles with negative gradients (i.e.
 $\unicode[STIX]{x2202}\unicode[STIX]{x1D707}_{0}/\unicode[STIX]{x2202}y<0$
), the tanh profile has lower growth rate as it has more high-viscosity fluid in the bottom half of the film. To understand this stabilization by more viscous fluids near the substrate, we investigate the linear viscosity profile further, as it allows an analytical solution.
3.2 Analytical solution for linear viscosity profiles
We parametrize the linear viscosity in terms of
 $\unicode[STIX]{x1D707}_{r}$
, the viscosity ratio between the bottom (
 $y=0$
) and the top (
 $y=1$
) of the film:
 $$\begin{eqnarray}\unicode[STIX]{x1D707}_{0}(y)=\unicode[STIX]{x1D707}_{r}-(\unicode[STIX]{x1D707}_{r}-1)y.\end{eqnarray}$$
Inserting the above into (3.7), we integrate with respect to
 $y$
four times to obtain
 $$\begin{eqnarray}\tilde{\unicode[STIX]{x1D713}}=\frac{c_{1}y^{2}}{2(\unicode[STIX]{x1D707}_{r}-1)}-\frac{\unicode[STIX]{x1D707}_{r}c_{1}+(\unicode[STIX]{x1D707}_{r}-1)c_{2}}{(\unicode[STIX]{x1D707}_{r}-1)^{3}}(\unicode[STIX]{x1D707}_{0}\ln \unicode[STIX]{x1D707}_{0}-\unicode[STIX]{x1D707}_{0})+c_{3}y+c_{4},\end{eqnarray}$$
where
 $c_{1},\ldots ,c_{4}$
are constants of integration to be determined from the four boundary conditions in (3.9)–(3.10). The algebra of determining the eigenvalue
 $\unicode[STIX]{x1D714}$
is simplified if we neglect Marangoni flow (
 ${\mathcal{M}}=0$
) and slip on the bottom wall (
 $\unicode[STIX]{x1D6FD}=0$
). Under these conditions, the growth rate
 $\unicode[STIX]{x1D714}$
can be expressed as
 $$\begin{eqnarray}\unicode[STIX]{x1D714}=k^{2}(3-{\mathcal{C}}k^{2})\left[\frac{1}{2(\unicode[STIX]{x1D707}_{r}-1)}-\frac{1}{(\unicode[STIX]{x1D707}_{r}-1)^{2}}+\frac{\ln \unicode[STIX]{x1D707}_{r}}{(\unicode[STIX]{x1D707}_{r}-1)^{3}}\right],\end{eqnarray}$$
where
 $k$
is the wavelength.
In order to compare the growth rate for linear viscosity profiles having the same average viscosity but different slopes, it is convenient to parametrize the dimensional viscosity profile using the average viscosity
 $\unicode[STIX]{x1D707}_{a}$
and the slope
 $\unicode[STIX]{x1D707}_{s}$
:
 $\unicode[STIX]{x1D707}_{0}(y)=\unicode[STIX]{x1D707}_{a}+\unicode[STIX]{x1D707}_{s}(y-h_{0}/2)$
. Then the growth rate can be scaled uniformly using the time scale based on
 $\unicode[STIX]{x1D707}_{a}$
. In the limit of gentle slope, with
 $|\unicode[STIX]{x1D707}_{s}h_{0}/\unicode[STIX]{x1D707}_{a}|\ll 1$
, equation (3.14) can be recast into the following form for the rescaled growth rate:
 $$\begin{eqnarray}\tilde{\unicode[STIX]{x1D714}}=k^{2}(3-{\mathcal{C}}k^{2})\left[\frac{1}{3}+\frac{1}{12}\frac{\unicode[STIX]{x1D707}_{s}h_{0}}{\unicode[STIX]{x1D707}_{a}}+O\left(\frac{\unicode[STIX]{x1D707}_{s}^{2}h_{0}^{2}}{\unicode[STIX]{x1D707}_{a}^{2}}\right)\right].\end{eqnarray}$$
If the region of higher viscosity is located near
 $y=0$
,
 $\unicode[STIX]{x1D707}_{s}<0$
and the growth rate is reduced relative to a uniform viscosity profile of the same mean viscosity. This explains the trend observed in figure 4(b).
4 Nonlinear numerical simulation
In the linear analysis, the equations governing the flow field and mucin transport (3.7) and (3.8) are decoupled and, as a result, the consequences of mucin diffusion cannot be studied within the linear framework. We therefore resort to a numerical solution of the nonlinear lubrication equations (2.22)–(2.31). Because the mucin diffusion equation is solved in two dimensions, our problem cannot be reduced to a set of one-dimensional partial differential equations as in earlier nonlinear studies of thin-film flows (Zhang et al. Reference Zhang, Craster and Matar2003a ,Reference Zhang, Craster and Matar b ; Pototsky et al. Reference Pototsky, Bestehorn, Merkt and Thiele2004).
4.1 Problem setup and numerics
The mucin concentration field evolves in the two-dimensional domain whose upper boundary, the surface of the film, changes in time. To avoid solving a moving boundary system in the domain
 $x\in [0,L]$
,
 $y\in [0,h(x,t)]$
, we introduce a mapping
 $$\begin{eqnarray}\unicode[STIX]{x1D702}=\frac{y}{h(x,t)}\end{eqnarray}$$
that transforms the tear film into a rectangular domain
 $x\in [0,L]$
;
 $\unicode[STIX]{x1D702}\in [0,1]$
. Accordingly, the governing equations are transformed into the
 $(x,\unicode[STIX]{x1D702})$
coordinates:
 $$\begin{eqnarray}\displaystyle & \displaystyle u_{x}-u_{\unicode[STIX]{x1D702}}\frac{\unicode[STIX]{x1D702}}{h}h_{x}+\frac{v_{\unicode[STIX]{x1D702}}}{h}=0, & \displaystyle\end{eqnarray}$$
 $$\begin{eqnarray}\displaystyle & \displaystyle -(p+\unicode[STIX]{x1D719})_{x}+\frac{1}{h^{2}}(\unicode[STIX]{x1D707}u_{\unicode[STIX]{x1D702}})_{\unicode[STIX]{x1D702}}=0, & \displaystyle\end{eqnarray}$$
 $$\begin{eqnarray}\displaystyle & \displaystyle C_{t}-C_{\unicode[STIX]{x1D702}}\frac{\unicode[STIX]{x1D702}}{h}h_{t}+u\left(C_{x}-C_{\unicode[STIX]{x1D702}}\frac{\unicode[STIX]{x1D702}}{h}h_{x}\right)+v\frac{C_{\unicode[STIX]{x1D702}}}{h}=\frac{1}{\unicode[STIX]{x1D6E5}_{b}}\frac{C_{\unicode[STIX]{x1D702}\unicode[STIX]{x1D702}}}{h^{2}}, & \displaystyle\end{eqnarray}$$
subject to the following boundary conditions. At
 $\unicode[STIX]{x1D702}=1$
,
 $$\begin{eqnarray}\displaystyle & h_{t}+uh_{x}=v, & \displaystyle\end{eqnarray}$$
 $$\begin{eqnarray}\displaystyle & \displaystyle \unicode[STIX]{x1D6E4}_{t}+(u\unicode[STIX]{x1D6E4})_{x}=\frac{\unicode[STIX]{x1D6E4}_{xx}}{Pe_{s}}, & \displaystyle\end{eqnarray}$$
 $$\begin{eqnarray}\displaystyle & \displaystyle \unicode[STIX]{x1D707}\frac{u_{\unicode[STIX]{x1D702}}}{h}=-{\mathcal{M}}\unicode[STIX]{x1D6E4}_{x}, & \displaystyle\end{eqnarray}$$
 $$\begin{eqnarray}\displaystyle & p=-{\mathcal{C}}h_{xx}, & \displaystyle\end{eqnarray}$$
 $$\begin{eqnarray}\displaystyle & C_{\unicode[STIX]{x1D702}}=0, & \displaystyle\end{eqnarray}$$
and at
 $\unicode[STIX]{x1D702}=0$
,
 $$\begin{eqnarray}u=\unicode[STIX]{x1D6FD}\frac{u_{\unicode[STIX]{x1D702}}}{h},\quad v=0,\quad C_{\unicode[STIX]{x1D702}}=0.\end{eqnarray}$$
After solving the problem in the
 $(x,\unicode[STIX]{x1D702})$
plane, the solution is transformed back to the
 $(x,y)$
plane for visualization and analysis.
We impose the following sinusoidal initial perturbation:
 $$\begin{eqnarray}\displaystyle & h(x,0)=h_{0}+\tilde{h}\text{e}^{\text{i}k_{m}x}, & \displaystyle\end{eqnarray}$$
 $$\begin{eqnarray}\displaystyle & \unicode[STIX]{x1D6E4}(x,0)=\unicode[STIX]{x1D6E4}_{0}+\tilde{\unicode[STIX]{x1D6E4}}\text{e}^{\text{i}k_{m}x}, & \displaystyle\end{eqnarray}$$
 $$\begin{eqnarray}\displaystyle & C(x,y,0)=C_{0}(y)+\tilde{C}\text{e}^{\text{i}k_{m}x}, & \displaystyle\end{eqnarray}$$
where
 $k_{m}$
is the wavenumber of the fastest growing mode of linear instability, and the small initial amplitudes (
 $\tilde{h},\tilde{\unicode[STIX]{x1D6E4}},\tilde{C}$
) are calculated by solving the set of equations (3.7)–(3.10) with
 $\tilde{h}=0.01$
. The dimensionless initial conditions have
 $h_{0}=1$
and
 $\unicode[STIX]{x1D6E4}_{0}=0.5$
. The initial mucin concentration profile is
 $$\begin{eqnarray}C_{0}(y)=1+\frac{\unicode[STIX]{x1D707}_{r}-1}{2}\left(1-\tanh {\displaystyle \frac{y-h_{m}}{\unicode[STIX]{x1D6FF}_{m}}}\right),\end{eqnarray}$$
and we adopt a dimensionless viscosity
 $$\begin{eqnarray}\unicode[STIX]{x1D707}(C)=C,\end{eqnarray}$$
ignoring the solvent contribution relative to the mucin contribution. In addition, a linear and uniform profile will also be tested in § 4.4 for comparison, as has been done in the linear stability analysis of § 3.
Validation of our numerical schemes: the instantaneous interfacial profile of a liquid film at the moment of rupture, computed using two different methods and compared with the result of Burelbach, Bankoff & Davis (Reference Burelbach, Bankoff and Davis1988). The abscissa is labelled in terms of the fastest-growing wavelength
 $\unicode[STIX]{x1D706}_{m}$
.
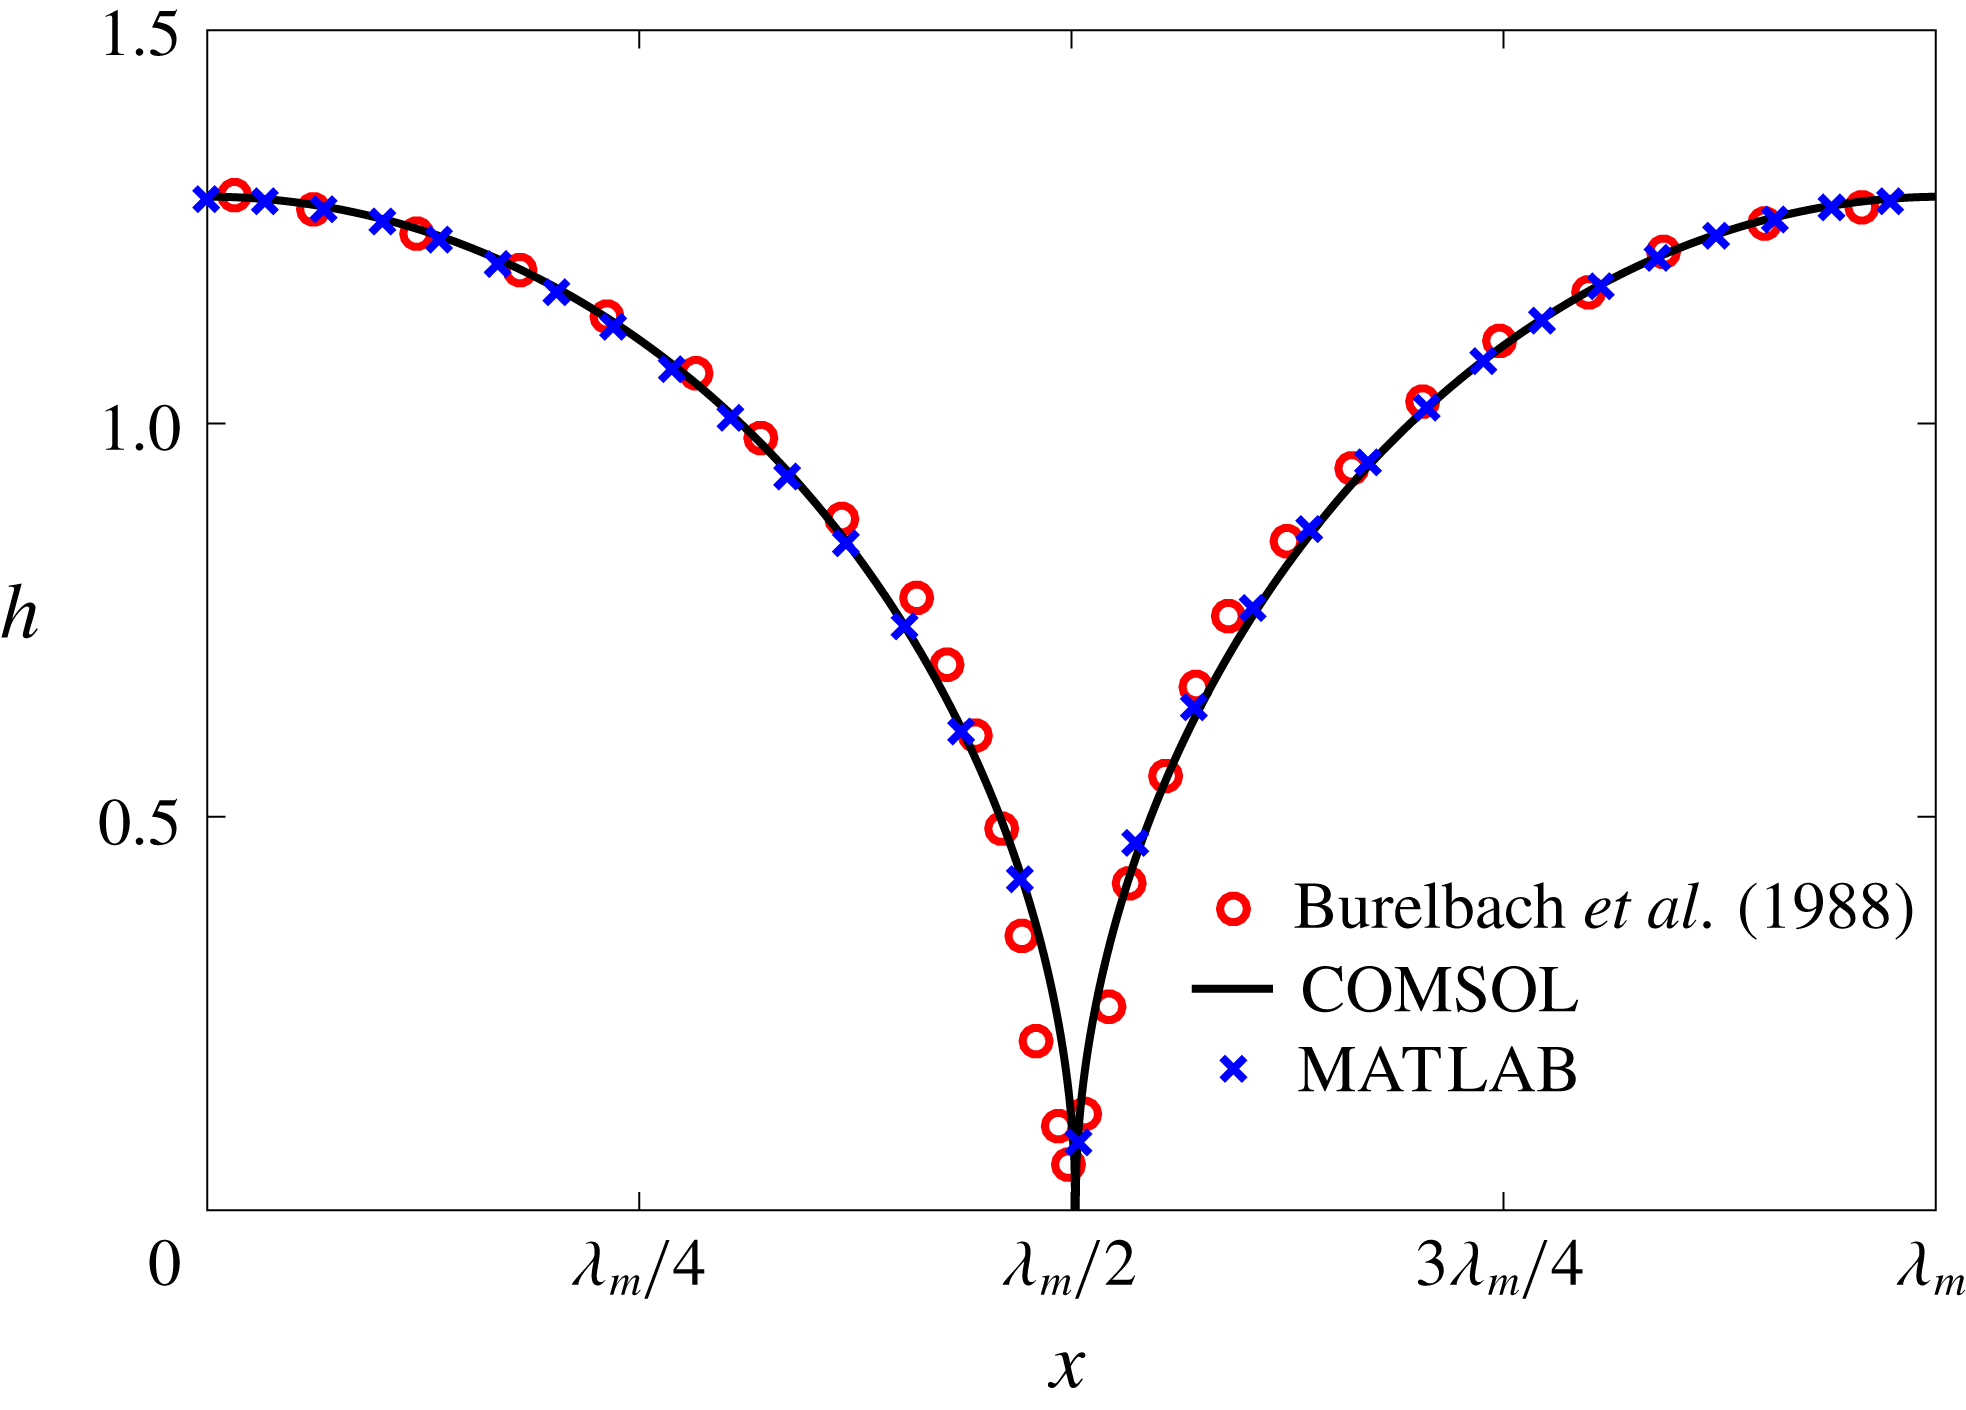
To solve the nonlinear film breakup problem outlined above, we have used two independent numerical methods. One is the finite-element solver COMSOL 5.2, and the other is an in-house MATLAB solver that uses a central difference scheme in the
 $x$
direction and a Chebyshev pseudo-spectral discretization in the
 $\unicode[STIX]{x1D702}$
direction, along with an Adam–Moulton time-stepping scheme. As validation, we have computed the one-dimensional problem of an isothermal film breakup, with constant viscosity and no surfactant, for which a solution is available in the literature (Burelbach et al.
Reference Burelbach, Bankoff and Davis1988). To be consistent with Burelbach et al. (Reference Burelbach, Bankoff and Davis1988), we impose periodic boundary conditions between the left and right edges of the domain. For the parameter set of figure 4 of Burelbach et al. (Reference Burelbach, Bankoff and Davis1988), figure 5 shows that our two numerical procedures produce essentially identical results, agreeing closely with the earlier result of Burelbach et al. (Reference Burelbach, Bankoff and Davis1988). In particular, we have predicted rupture times
 $t_{rup}=4.085$
using COMSOL and
 $t_{rup}=4.072$
using the MATLAB solver, close to
 $t_{rup}=4.164$
predicted by Burelbach et al. (Reference Burelbach, Bankoff and Davis1988). In the following, we will only present results computed using COMSOL, as all cases computed using our MATLAB solver yielded essentially the same results.
4.2 General characteristics of film rupture
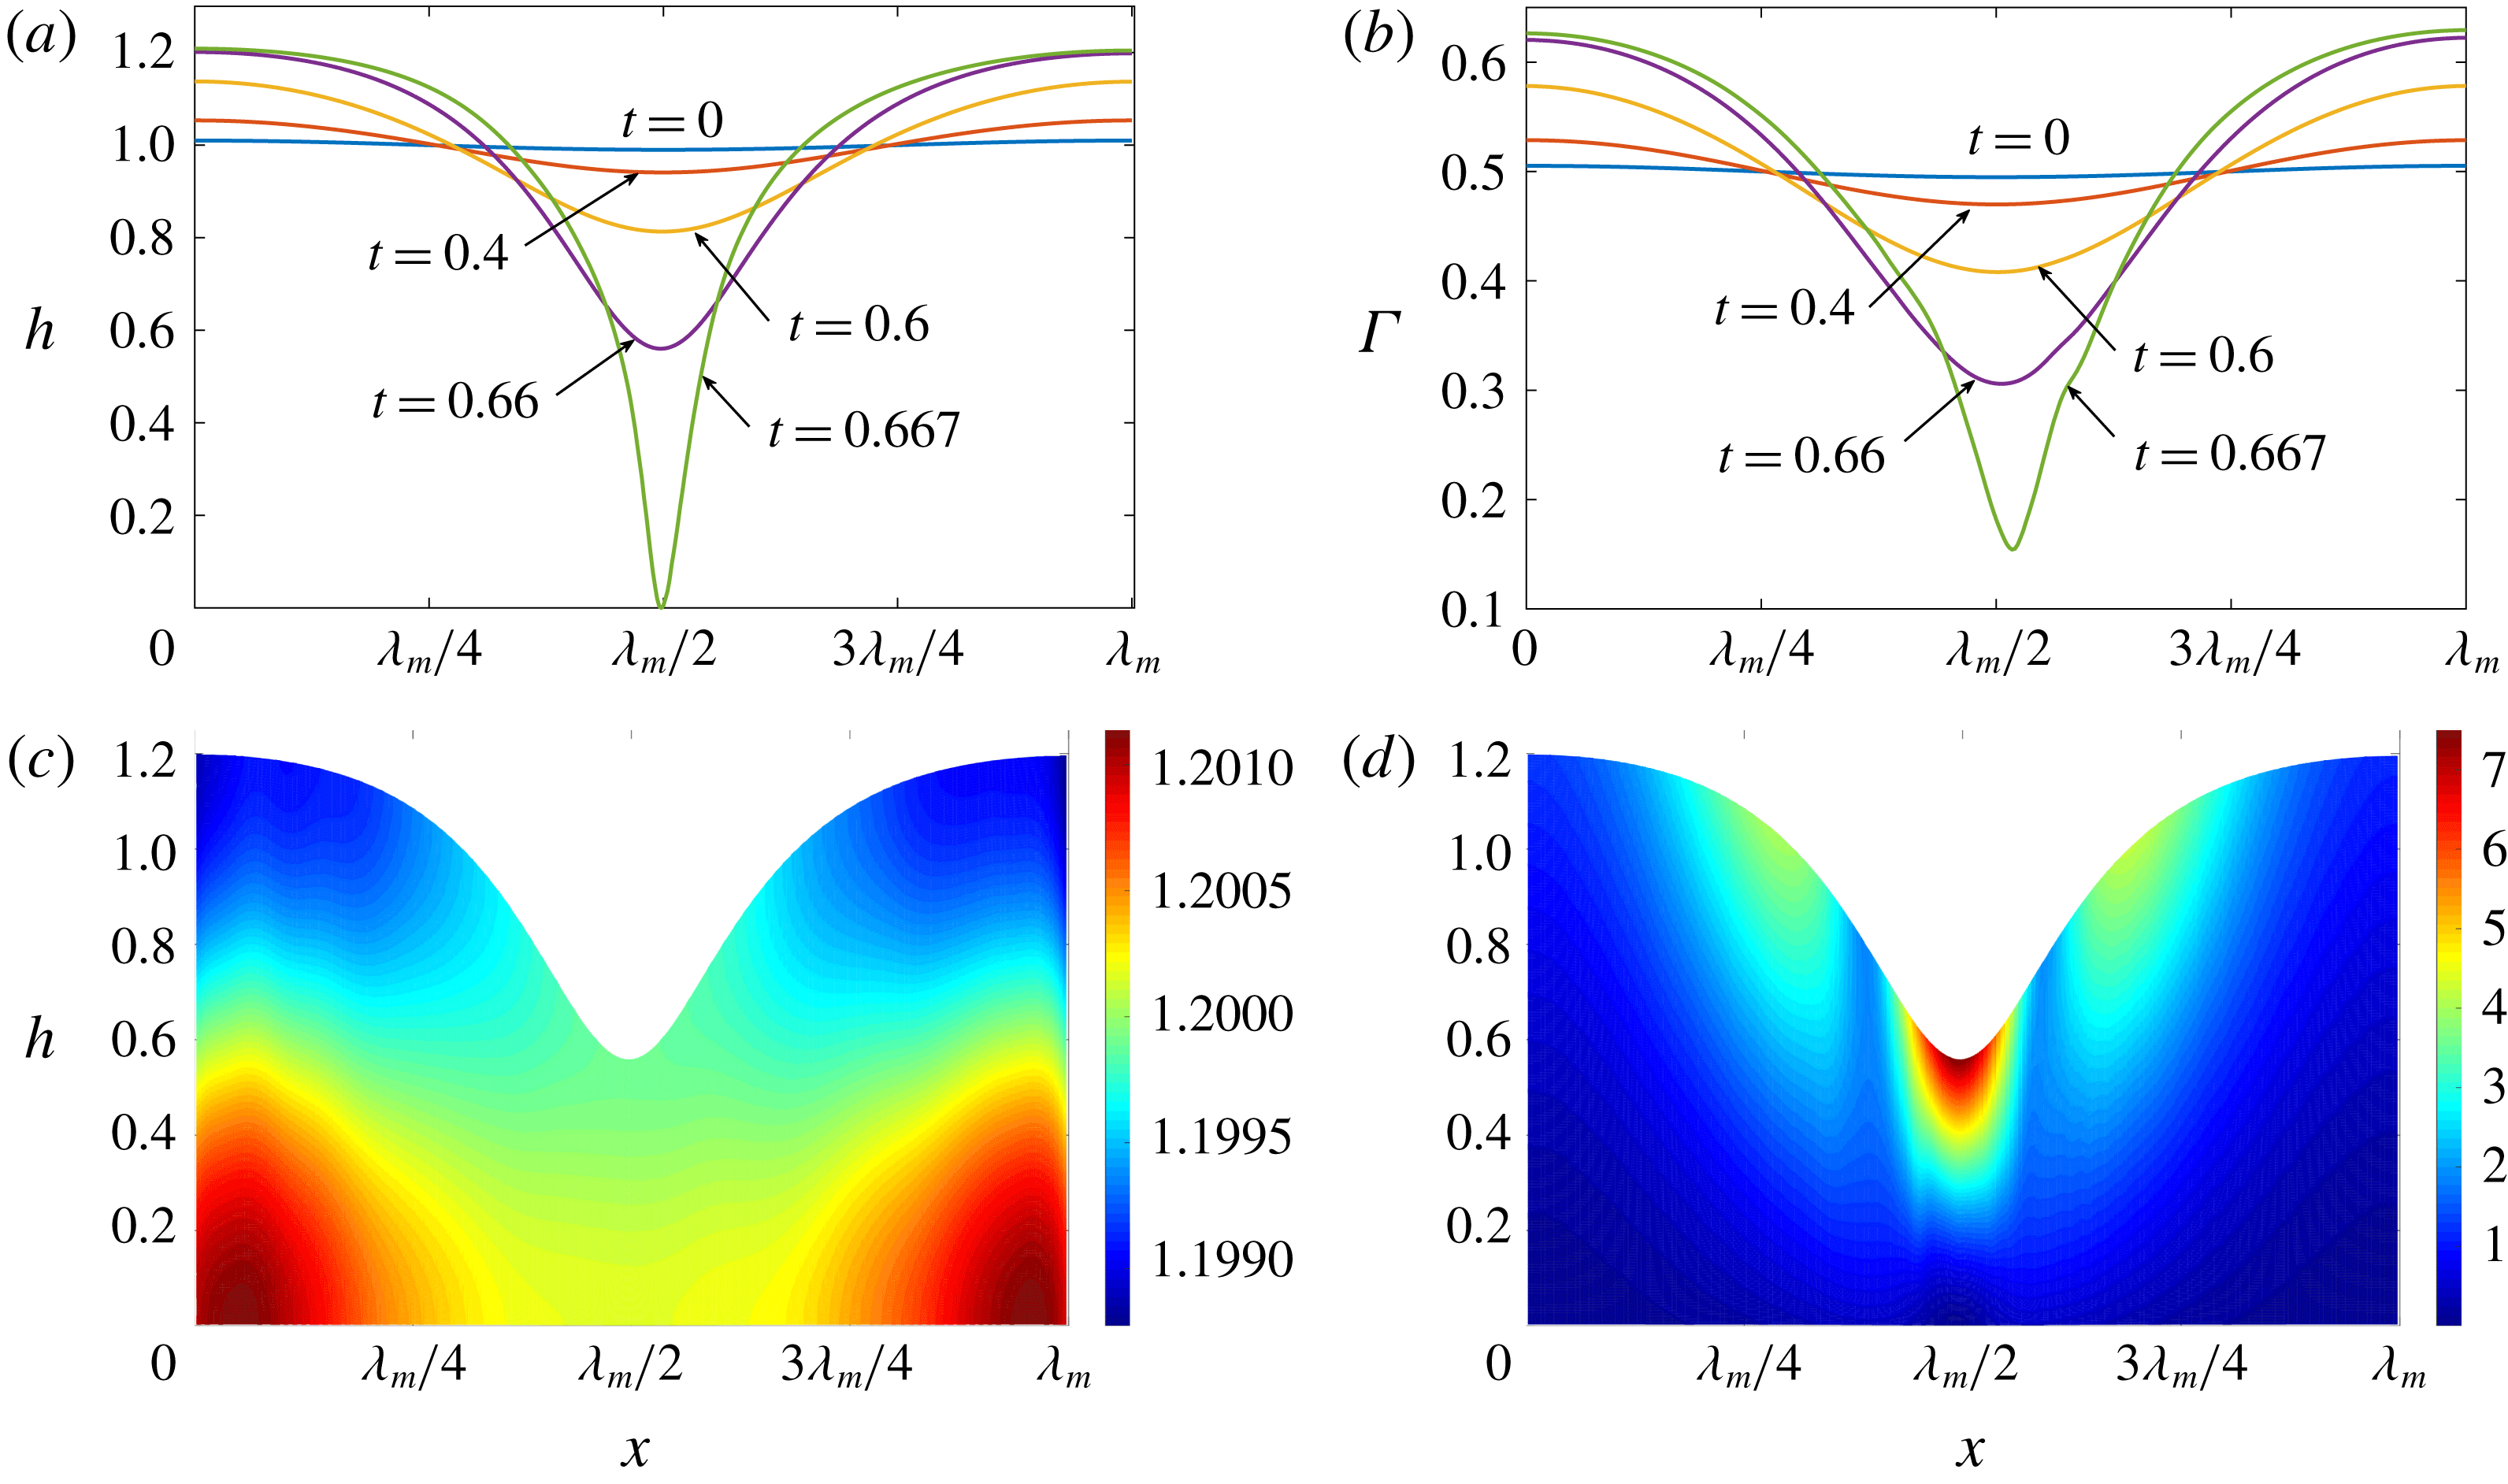
Figure 6 presents a representative solution for the evolution of the interface to rupture, using the following baseline set of parameters:
 $h_{m}=0.2$
,
 $\unicode[STIX]{x1D707}_{r}=2$
,
 $\unicode[STIX]{x1D6FF}_{m}=10^{-2}$
,
 ${\mathcal{C}}=0.1$
,
 ${\mathcal{M}}=1$
,
 $Pe_{s}=100$
,
 $\unicode[STIX]{x1D6E5}_{b}=1$
and
 $\unicode[STIX]{x1D6FD}=0.1$
. Starting from the small disturbance imposed on the surface of a uniform stationary film (4.11)–(4.13), a pressure gradient due to the short-range van der Waals forces causes the disturbance to grow (figure 6
a) by moving liquid from the valley to the crest region. This flow also transports the insoluble surfactant on the surface (figure 6
b), generating a Marangoni flow that tends to oppose the film thinning due to van der Waals force. Meanwhile, the mucin distribution deviates from its initial profile (4.14) by convection and diffusion (figure 6
c). Although the Marangoni flow slows down film thinning to some extent, it is unable to overcome the destabilizing effect of the van der Waals attraction, and the thinning flow continues (figure 6
d) until the film ruptures at
 $t_{rup}=0.667$
.
A representative solution of nonlinear film breakup. (a) Temporal evolution of the interface and (b) evolution of the surfactant concentration until rupture at
 $t=0.667$
. (c) Contours of the mucin concentration and (d) contours of the magnitude of the velocity in the tear film at
 $t=0.66$
, just before rupture.
In the following, the film breakup is quantified in terms of the evolution of the free interface and the rupture time
 $t_{rup}$
. We will compare the nonlinear instability with the predictions of linear growth, and analyse how film rupture is affected by the mucin diffusivity and the initial mucin concentration profile. Unless otherwise stated, we will vary the parameters relative to the baseline values given above. We have also explored the effects of slip on the ocular surface and the magnitude of the van der Waals forces. These turn out to be qualitatively the same as reported earlier for a single-layer model (Zhang et al.
Reference Zhang, Craster and Matar2003b
) and TLMs (Sharma & Ruckenstein Reference Sharma and Ruckenstein1986a
,Reference Sharma and Ruckenstein
b
; Zhang et al.
Reference Zhang, Craster and Matar2003a
). As expected, larger slip and stronger van der Waals attraction both lead to faster growth and breakup. We omit these results for brevity.
4.3 Effect of mucin diffusivity
In the nonlinear phase of the instability, the higher order terms are no longer negligible and mucin diffusion plays a key role. Following Matar (Reference Matar2002), we define a nonlinear growth metric
 $$\begin{eqnarray}G=\ln \left[\frac{h_{max}(t)-h_{min}(t)}{h_{max}(0)-h_{min}(0)}\right],\end{eqnarray}$$
where
 $h_{max}(t)$
and
 $h_{min}(t)$
are the maximum and minimum film thickness at time
 $t$
, and compare it to the linear growth
 $\unicode[STIX]{x1D714}_{m}t$
,
 $\unicode[STIX]{x1D714}_{m}$
being the fastest growth rate among the linear modes of instability.
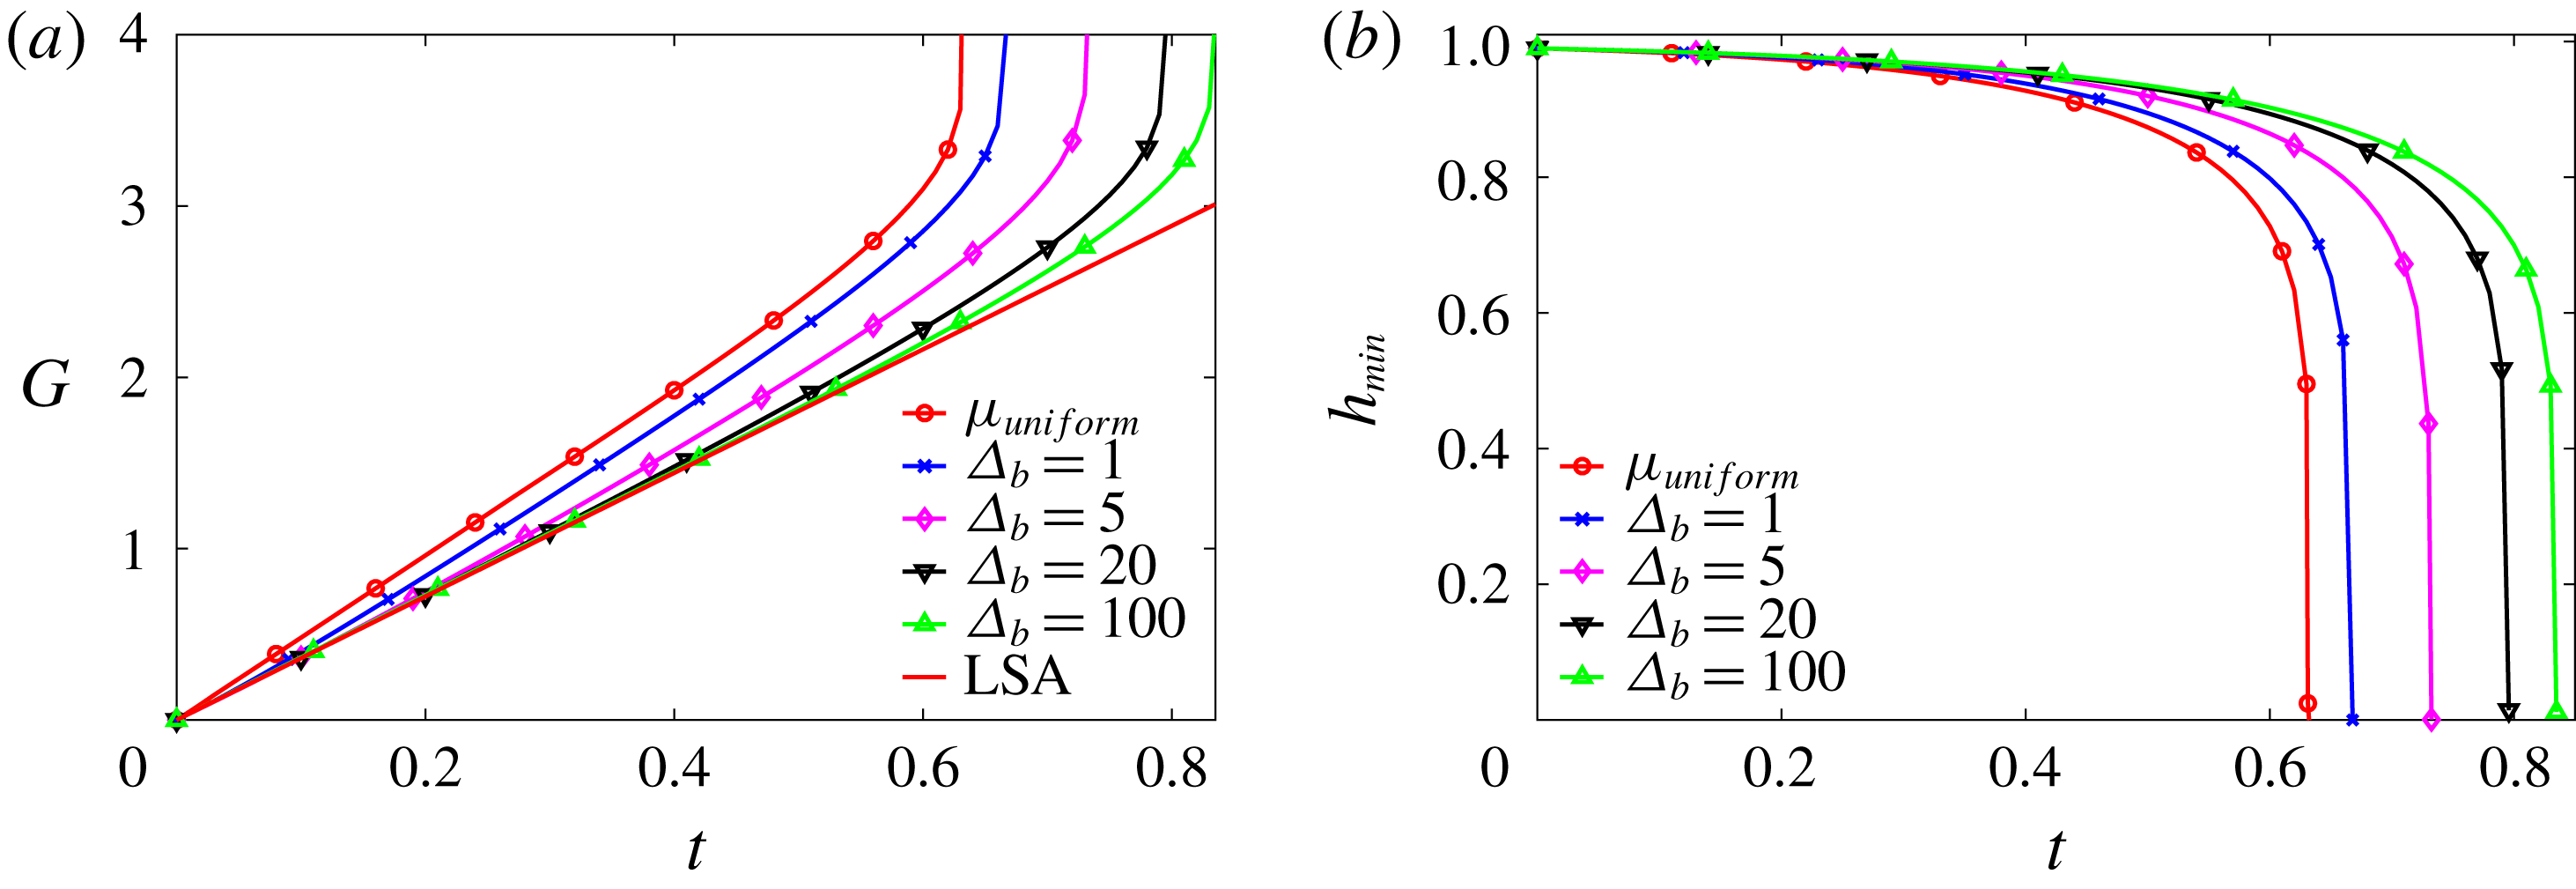
Nonlinear growth of the instability as affected by mucin diffusivity,
 $\unicode[STIX]{x1D6E5}_{b}$
being the rescaled Péclet number. (a) Comparison of the nonlinear growth metric
 $G$
with the linear growth (LSA). (b) Temporal evolution of the minimum height
 $h_{min}$
for the nonlinear cases. For comparison, we have included in both plots the solution for a uniform-viscosity film whose viscosity equals the average viscosity of the tanh profile.
Using the
 $\tanh$
initial mucin profile with the baseline parameters, we have tested several values of the rescaled Péclet number
 $\unicode[STIX]{x1D6E5}_{b}$
for mucin diffusion (2.25), and compared the nonlinear growth against the linear prediction in figure 7(a). Note first that the nonlinear curves coincide with the linear result at short times, as is expected. Later the growth rate increasingly deviates from the prediction of linear instability, resulting in a catastrophic rupture at the end (figure 7
b), as opposed to the exponential rupture predicted by linear instability. Among the four nonlinear growth curves, the rupture occurs faster for the smaller values of
 $\unicode[STIX]{x1D6E5}_{b}$
, i.e. larger mucin diffusivity. This can be rationalized from our linear analysis of the effect of the viscosity profile. Figure 4 shows that having high-viscosity fluid near the solid boundary tends to suppress the linear growth rate and stabilize the film. In the nonlinear regime, the mucin diffuses from the near-wall region, where
 $C$
is the highest, towards the free surface of the film, where
 $C$
is the lowest. This dynamically lowers the viscosity near the substrate and raises it near the free surface, thereby accelerating the instability according to the linear analysis. Thus, higher mucin diffusivity leads to faster growth and earlier rupture.
It is interesting to examine the limits of rapid and slow diffusion. As discussed in § 2, the rapid diffusion at the
 $D_{b}$
value of table 1 (
 $\unicode[STIX]{x1D6E5}_{b}=4.4\times 10^{-4}$
) corresponds to complete loss of the MAMs and free diffusion of mobile mucins. Diffusion being so rapid, the tear film behaves essentially as if with a uniform initial viscosity profile, shown by the curve labelled by
 $\unicode[STIX]{x1D707}_{uniform}$
in figure 7. At the slow diffusion limit, represented by the curve for
 $\unicode[STIX]{x1D6E5}_{b}=100$
, the mucin profile diffuses little during the breakup process, approximating the intact glycocalyx in a healthy tear film. In both limits, the tear film dynamics is insensitive to
 $\unicode[STIX]{x1D6E5}_{b}$
, and we have chosen an intermediate
 $\unicode[STIX]{x1D6E5}_{b}=1$
as our baseline for the purpose of demonstrating the effect of mucin diffusion. We compare the model predictions of breakup time with experimental measurements on healthy tear films in § 5.3.
The transition from the slow to the fast diffusion limit may be identified with the gradual loss of MAMs due to diseases such as dry eye syndrome and eye infection (Sharma & Ruckenstein Reference Sharma and Ruckenstein1985). It has long been observed that the tear-film breakup time is shortened under such pathological conditions (Norn Reference Norn1969; Dohlman et al. Reference Dohlman, Friend, Kalevar, Yagoda and Balazs1976). Our CVM prediction is consistent with these observations. Moreover, the model provides a plausible explanation for the shortened breakup time through the outward mucin diffusion from the glycocalyx.
4.4 Effect of the initial viscosity profile
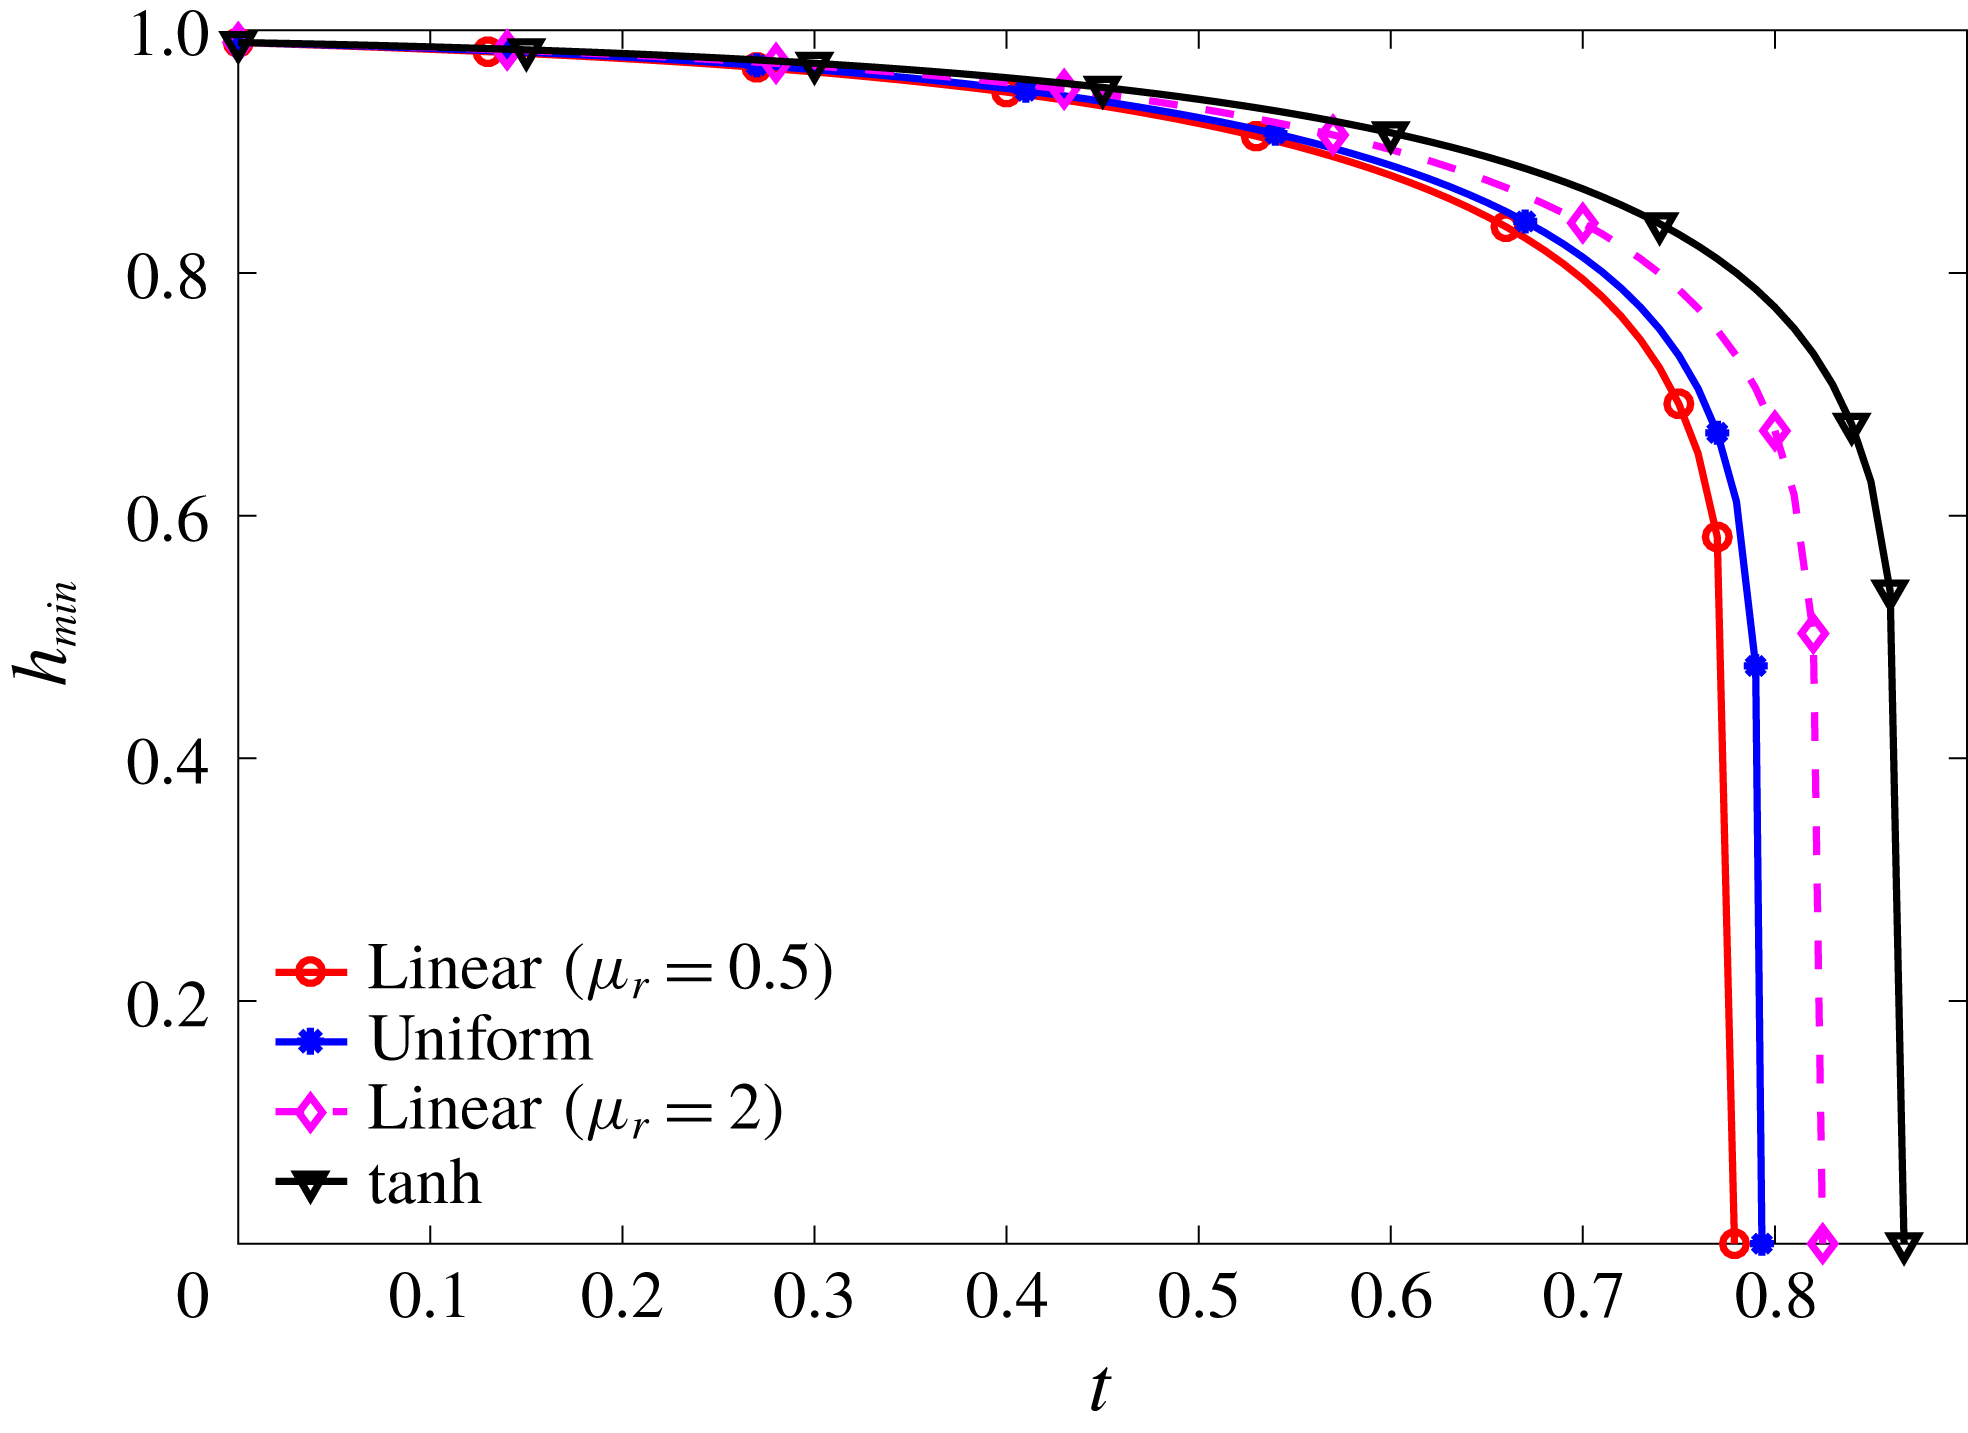
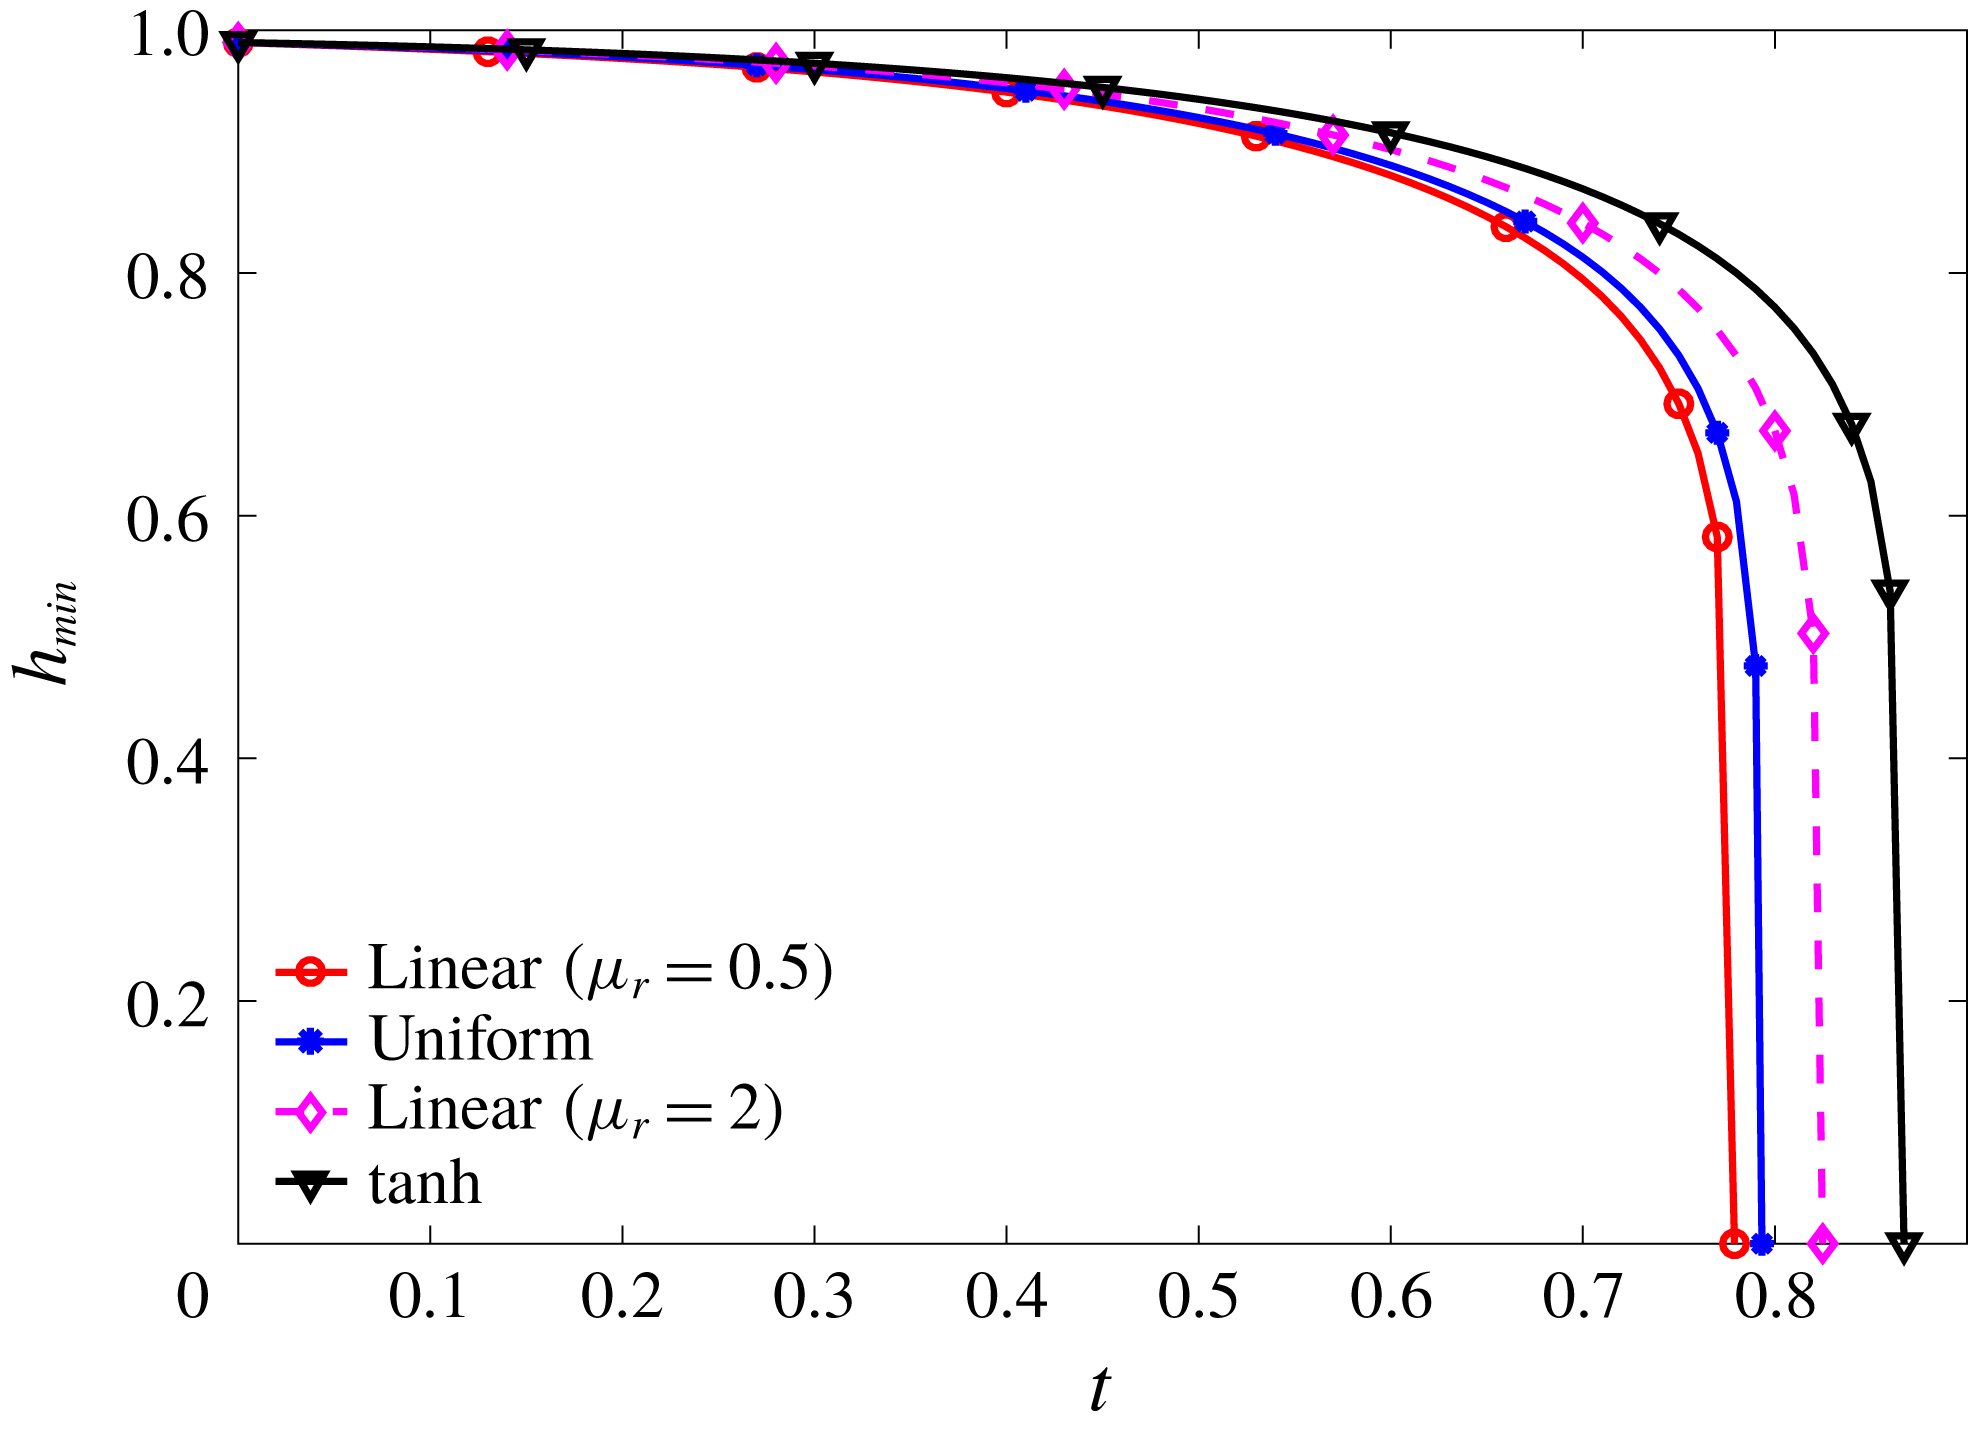
To explore how the initial mucin and viscosity profiles affect the nonlinear instability, we compare in figure 8 nonlinear breakup starting from the four initial profiles tested for linear stability in figure 4(a). The temporal evolution of the minimum film thickness
 $h_{min}(t)$
shows that the nonlinear instability, up to film rupture, obeys the same trend discovered from linear stability analysis. That is, the profile that puts more viscous fluid near the solid wall tends to stabilize the film more and delay the film breakup (figure 4
b). Along with the effect of mucin diffusion discussed above, this furnishes another example of how the simple rule established by linear analysis (§ 3.2) continues to hold into the nonlinear stages of film breakup.

(a) For a fixed mean viscosity of 1.5, the initially imposed viscosity profiles for three different values of
 $h_{m}$
. (b) Effect of
 $h_{m}$
on the tear film rupture time
 $t_{rup}$
for a healthy tear film with
 $\unicode[STIX]{x1D6E5}_{b}=100$
.
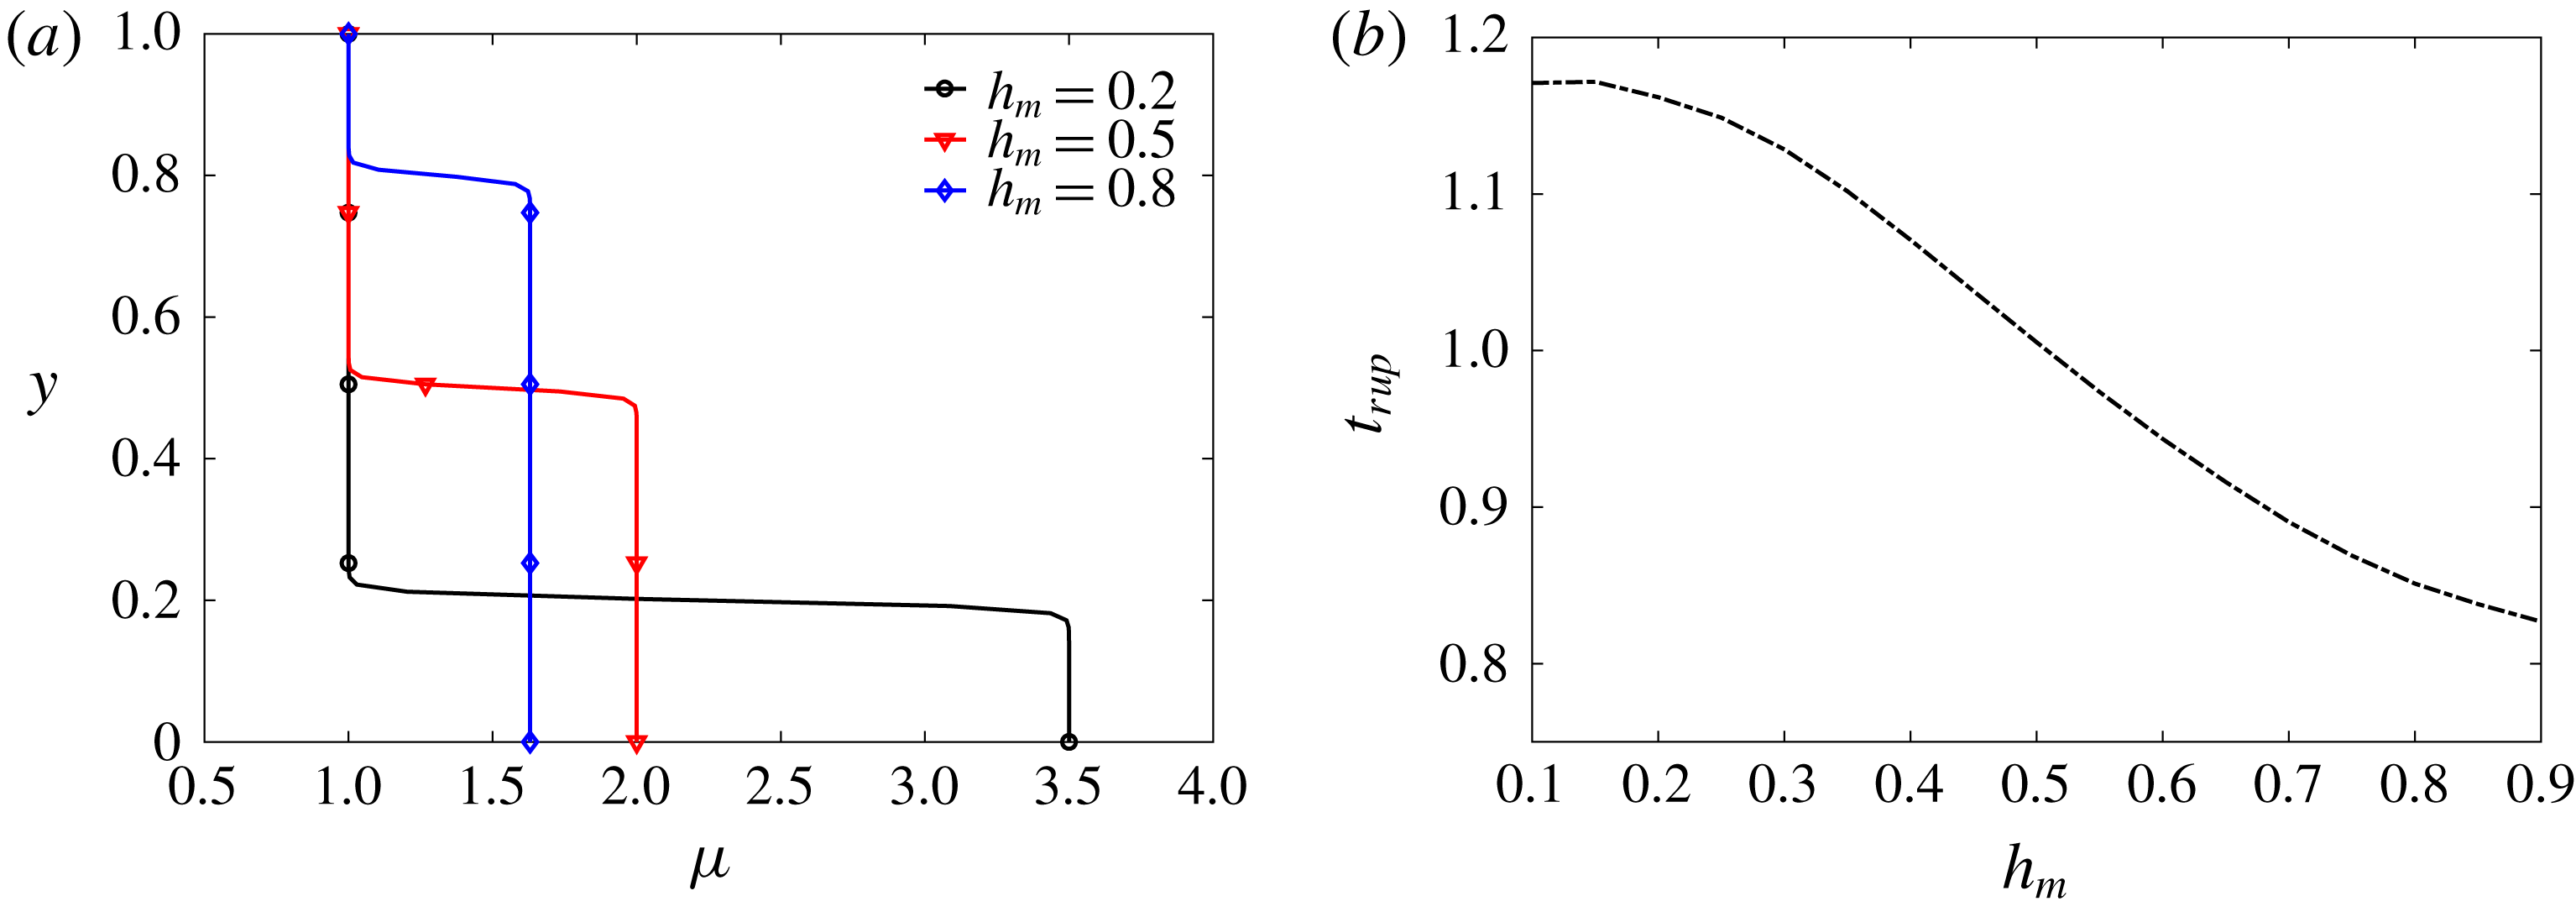
Now we focus on the tanh profile only. Keeping the viscosity at the top fixed, the viscosity ratio
 $\unicode[STIX]{x1D707}_{r}$
and the height of the mucin-rich layer
 $h_{m}$
can be varied in concert to keep the mean viscosity of the profile constant. According to this protocol, figure 9(a) shows three initial viscosity profiles with different
 $h_{m}$
, a smaller
 $h_{m}$
corresponding to a thinner but more viscous mucin layer next to the wall. Figure 9(b) shows the rupture time as a function of the initial mucin layer thickness
 $h_{m}$
. The general trend is that the breakup time
 $t_{rup}$
increases with decreasing
 $h_{m}$
. Putting more viscous material next to the ocular surface tends to stabilize the tear film against breakup, an effect that has been confirmed repeatedly in the above. As
 $h_{m}$
becomes very thin, however, the trend levels off. This can be rationalized by the mucin diffusion from the near-wall region toward the free surface. A smaller
 $h_{m}$
implies a sharper mucin concentration gradient at the start, which is more quickly smeared out by diffusion after the onset of instability. Roughly speaking, the
 $C$
or
 $\unicode[STIX]{x1D707}$
profile will quickly relax towards that of a thicker
 $h_{m}$
in figure 9(a). This explains how
 $t_{rup}$
becomes insensitive to
 $h_{m}$
as it gets too thin.
5 Comparison with TLMs
As stated in § 1, the main impetus of this study is to propose a model for tear-film breakup with a continuous mucin profile, as an alternative to the earlier models that assumed an aqueous layer atop an immiscible mucus layer. It is therefore important to compare the predictions of the new model with those of earlier models and with available experimental data. The TLM and CVM share a common limit, as noted in § 3, and figure 3(b) demonstrates that the two models yield the same linear-stability solution in that common limit. In the following, we first confirm that the two models predict the same nonlinear instability in the common limit, and then compare their predictions under conditions relevant to realistic tear films.
5.1 Nonlinear film rupture in the common limit
The common limit for the TLM and the CVM. (a) Growth of the initial perturbations with time in the TLM and CVM, in comparison with the linear growth rate (LSA). (b) The air–water and water–mucin interfaces of the TLM are superimposed on the mucin concentration field in the CVM at time
 $t=1.031$
, just before rupture.
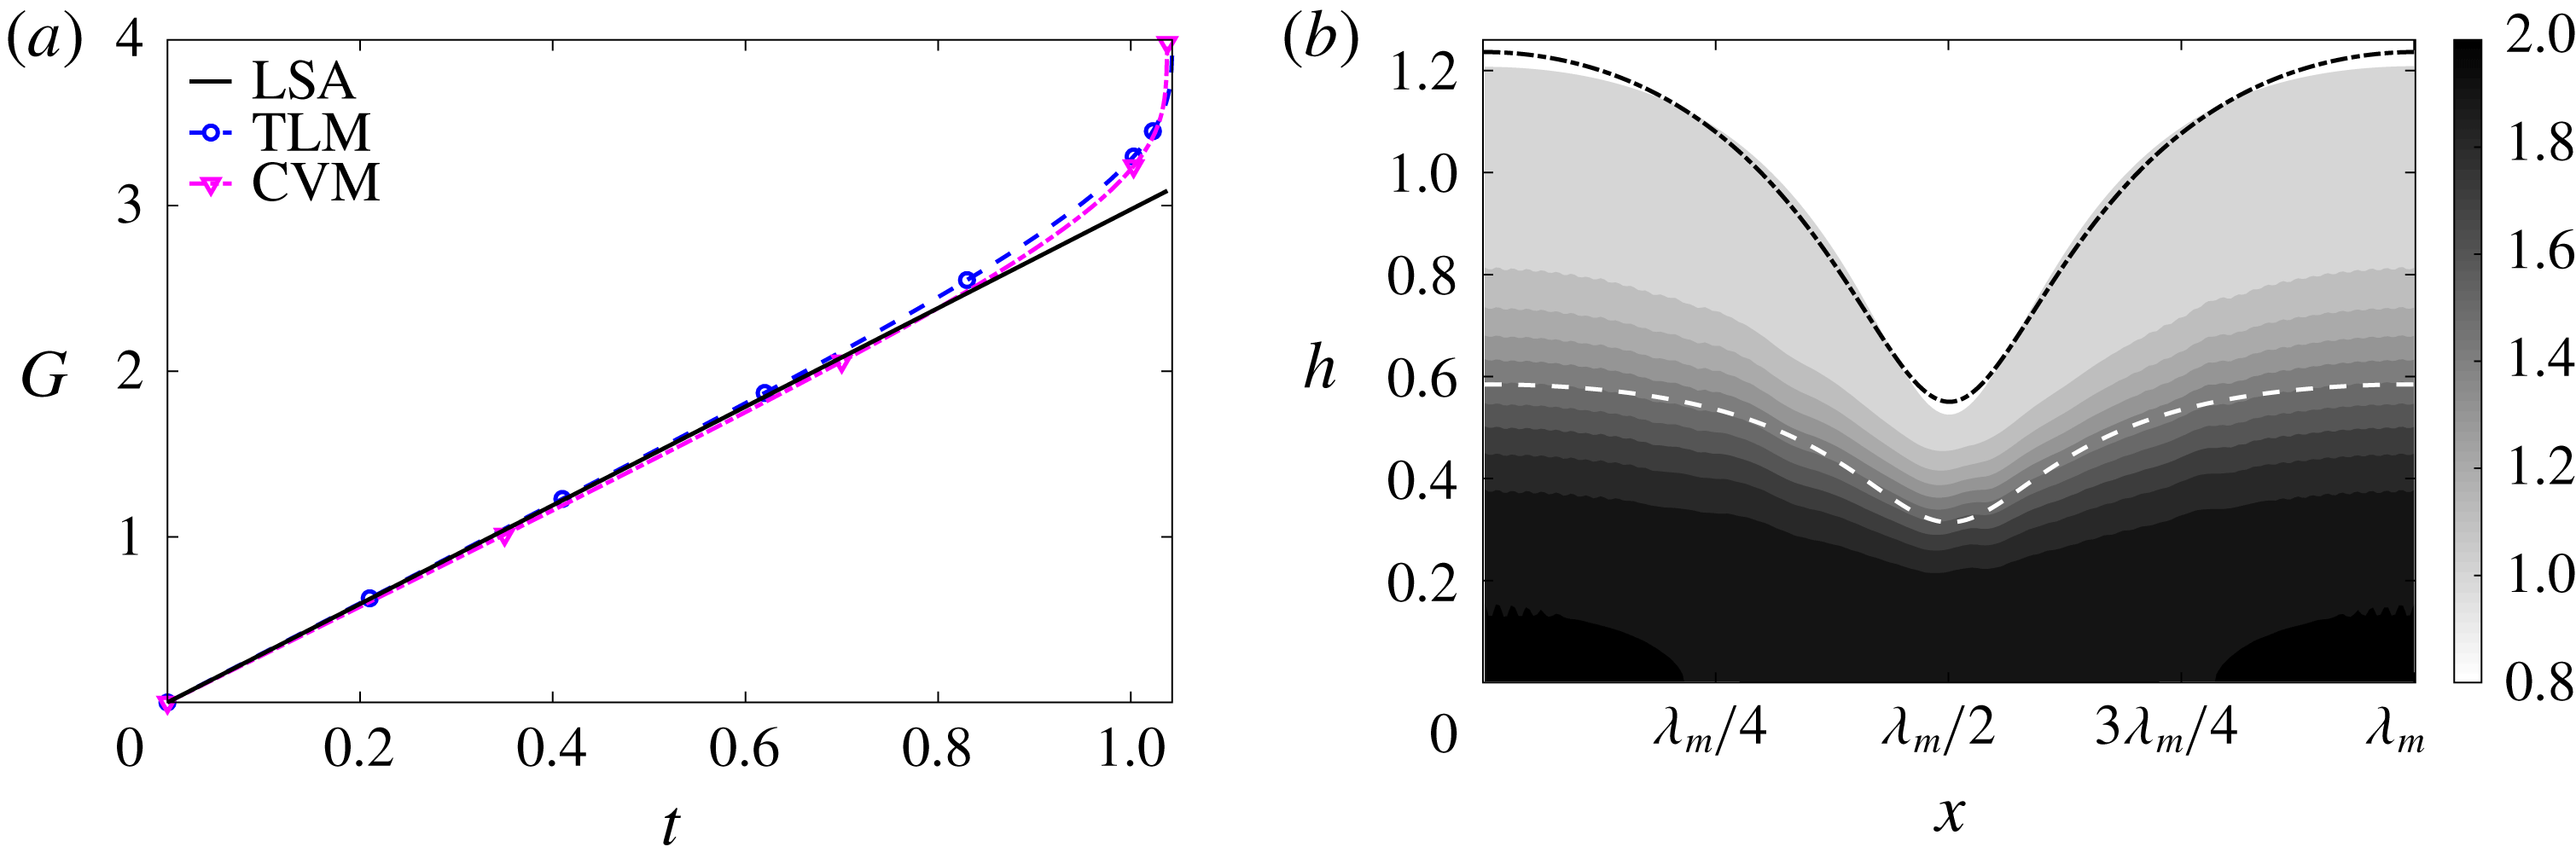
The common limit is approximated in the
 $\tanh$
viscosity profile by employing a sharp transition layer (with a small
 $\unicode[STIX]{x1D6FF}_{m}=10^{-4}$
) along with slow diffusion (with a large
 $\unicode[STIX]{x1D6E5}_{b}=100$
). The parameters for the TLM are given in appendix A. Among these we put to zero the interfacial tension for the mucin–aqueous interface (
 ${\mathcal{C}}_{m}=0$
), as well as the van der Waals forces between this interface and the solid substrate and the free surface (
 ${\mathcal{A}}_{1,2,4}=0$
). Figure 10 compares the CVM and TLM in the common limit for a film with
 $h_{m}=0.5$
, with equal initial thickness for the two layers. The two models show very close agreement in the nonlinear regime of film rupture. The nonlinear growth factor follows the linear prediction up to
 $t\approx 0.5$
, after which the nonlinear rate becomes increasingly greater, ending with a sharp upturn toward rupture (figure 10
a). Snapshots of the interfacial profile also agree between the two models. The TLM has an air–water interface at
 $h_{a}(x,t)$
and a mucus–aqueous layer interface at
 $h_{m}(x,t)$
. These are overlaid on the contours of mucin concentration in the CVM (figure 10
b) at
 $t=1.031$
, shortly before rupture takes place. The air–liquid interface agrees closely between the two models, and the water–mucin interface in the TLM overlaps the CVM contour
 $C=1.5$
, at the centre of the tanh profile. Thus, we have confirmed that in the limiting scenario the two models agree in both the linear and the nonlinear regimes.
5.2 TLM for tear film
The TLM differs from our CVM in posing an immiscible interface between the mucus and aqueous layers that possesses an interfacial tension and also interacts via van der Waals forces with the top and bottom surfaces. Bearing this in mind, we first investigate how the mucus–aqueous interfacial tension and the van der Waals attraction between the mucus–aqueous interface and the two boundaries affect the process of film breakup.
Similar studies have been performed before (Zhang et al.
Reference Zhang, Craster and Matar2003a
), but our case differs in allowing slip on the solid substrate in a two-layer setup. After adding the Navier slip boundary condition to the TLM of Zhang et al. (Reference Zhang, Craster and Matar2003a
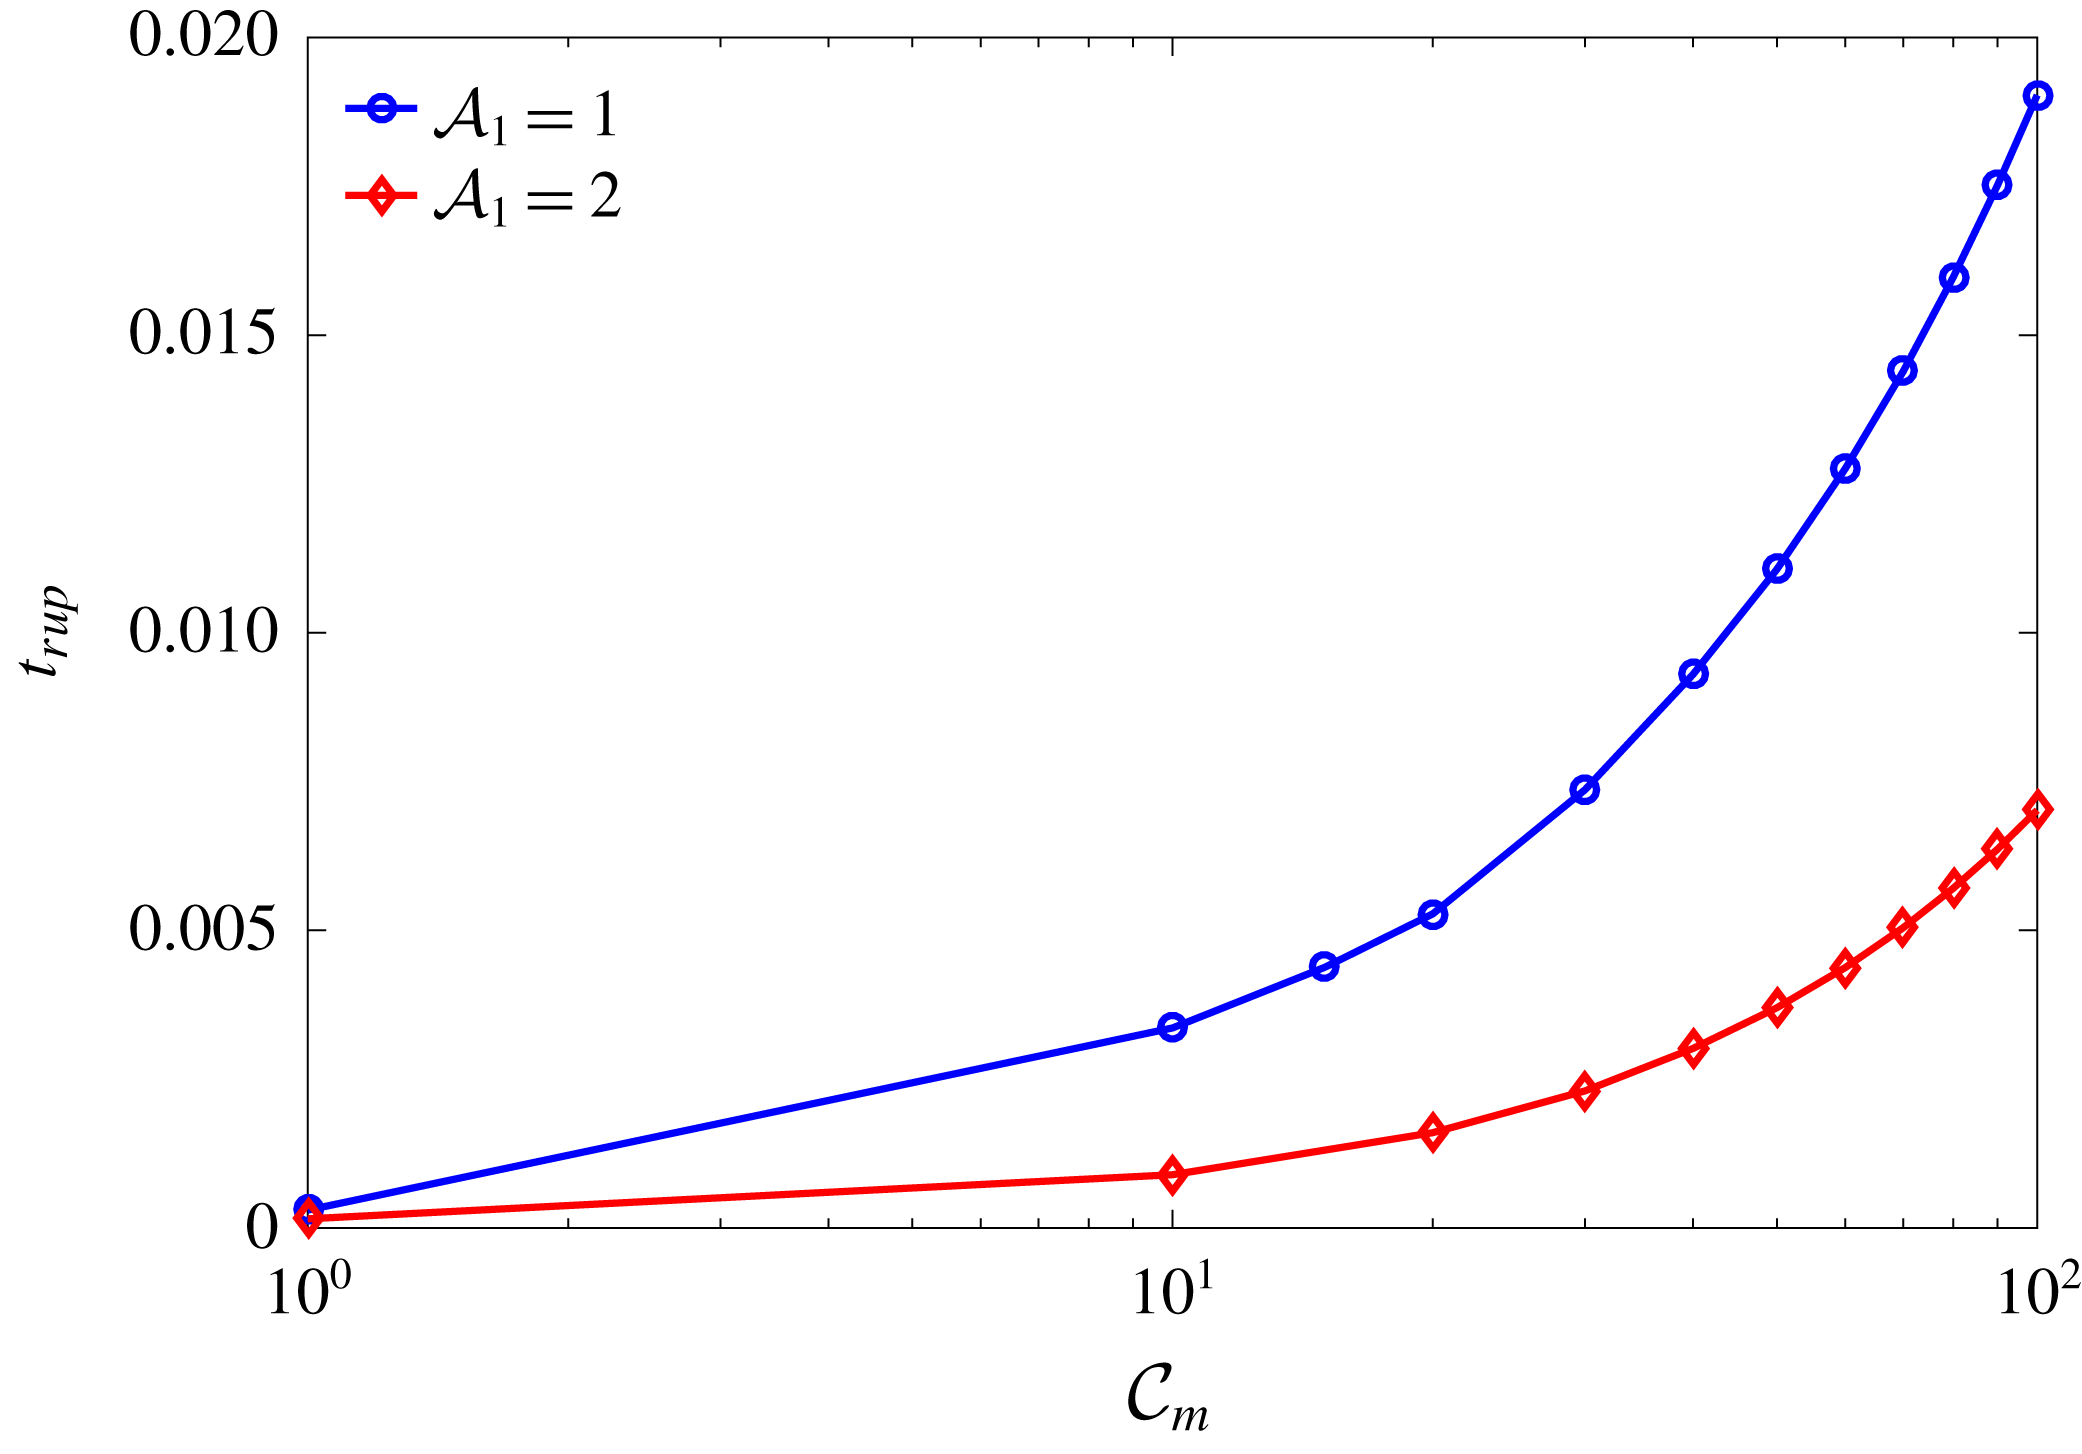
) for Newtonian fluids, we solve these equations numerically. The predicted breakup time is depicted in figure 11 as a function of the dimensionless mucus–aqueous interfacial tension
 ${\mathcal{C}}_{m}$
for two values of the Hamaker constant
 ${\mathcal{A}}_{1}$
(definitions given in appendix A). Increasing interfacial tension at the mucus–aqueous interface hinders the growth of instability. Thus, the breakup time
 $t_{rup}$
increases monotonically with
 ${\mathcal{C}}_{m}$
. On the other hand, since the van der Waals attraction is the driving force for the breakup,
 $t_{rup}$
decreases with increasing
 ${\mathcal{A}}_{1}$
. Both trends are consistent with previous predictions using TLM in the absence of slip (Sharma & Ruckenstein Reference Sharma and Ruckenstein1986a
,Reference Sharma and Ruckenstein
b
; Zhang et al.
Reference Zhang, Craster and Matar2003a
).
Effects of the interfacial tension and van der Waals attraction on the tear-film breakup time
 $t_{rup}$
in the TLM. The parameter
 ${\mathcal{C}}_{m}$
is the dimensionless mucus–aqueous interfacial tension, and
 ${\mathcal{A}}_{1}$
represents the aqueous–substrate interaction in the presence of the mucus layer (Zhang et al.
Reference Zhang, Craster and Matar2003a
). The other TLM parameters are
 $h_{m}=0.2$
,
 $\unicode[STIX]{x1D707}_{r}=2$
,
 ${\mathcal{A}}_{2}={\mathcal{A}}_{3}={\mathcal{A}}_{4}=1$
,
 ${\mathcal{C}}=0.1$
,
 ${\mathcal{M}}=1$
,
 $Pe_{s}=100$
and
 $\unicode[STIX]{x1D6FD}=0.1$
.
5.3 Comparison between CVM and TLM
A prerequisite for a meaningful comparison is to match the parameters of the two models. The complete set of parameters of the CVM are
 ${\mathcal{C}}$
,
 $\unicode[STIX]{x1D707}_{r}$
,
 $h_{m}$
,
 $\unicode[STIX]{x1D6FF}_{m}$
,
 $\unicode[STIX]{x1D6E5}_{b}$
,
 $Pe_{s}$
,
 $\unicode[STIX]{x1D6FD}$
and
 ${\mathcal{M}}$
, as described in detail in § 2. On the other hand, the TLM assumes a two-layered description within the tear film and thus has a different set of governing parameters:
 ${\mathcal{C}}$
,
 ${\mathcal{C}}_{m}$
,
 $\unicode[STIX]{x1D707}_{r}$
,
 $h_{m}$
,
 ${\mathcal{A}}_{1}$
,
 ${\mathcal{A}}_{2}$
,
 ${\mathcal{A}}_{3}$
,
 ${\mathcal{A}}_{4}$
,
 $Pe_{s}$
,
 $\unicode[STIX]{x1D6FD}$
and
 ${\mathcal{M}}$
, as described in detail in appendix A. Of the parameters common to both models,
 ${\mathcal{C}}$
,
 $\unicode[STIX]{x1D707}_{r}$
and
 $h_{m}$
are based on the intrinsic properties of the tear film itself and can be readily evaluated for typical tear films of the healthy eye, and matched between the two models. The other parameters are chosen on the basis of previous TLM simulations (Sharma & Ruckenstein Reference Sharma and Ruckenstein1986a
; Zhang et al.
Reference Zhang, Craster and Matar2003a
). As a reference, Zhang et al. (Reference Zhang, Craster and Matar2003a
) adopted a power-law non-Newtonian viscosity for the mucus layer and a no-slip boundary condition on the substrate. Under these conditions, their TLM predicted a tear-film breakup time in the range of 15–50 s for healthy eyes.
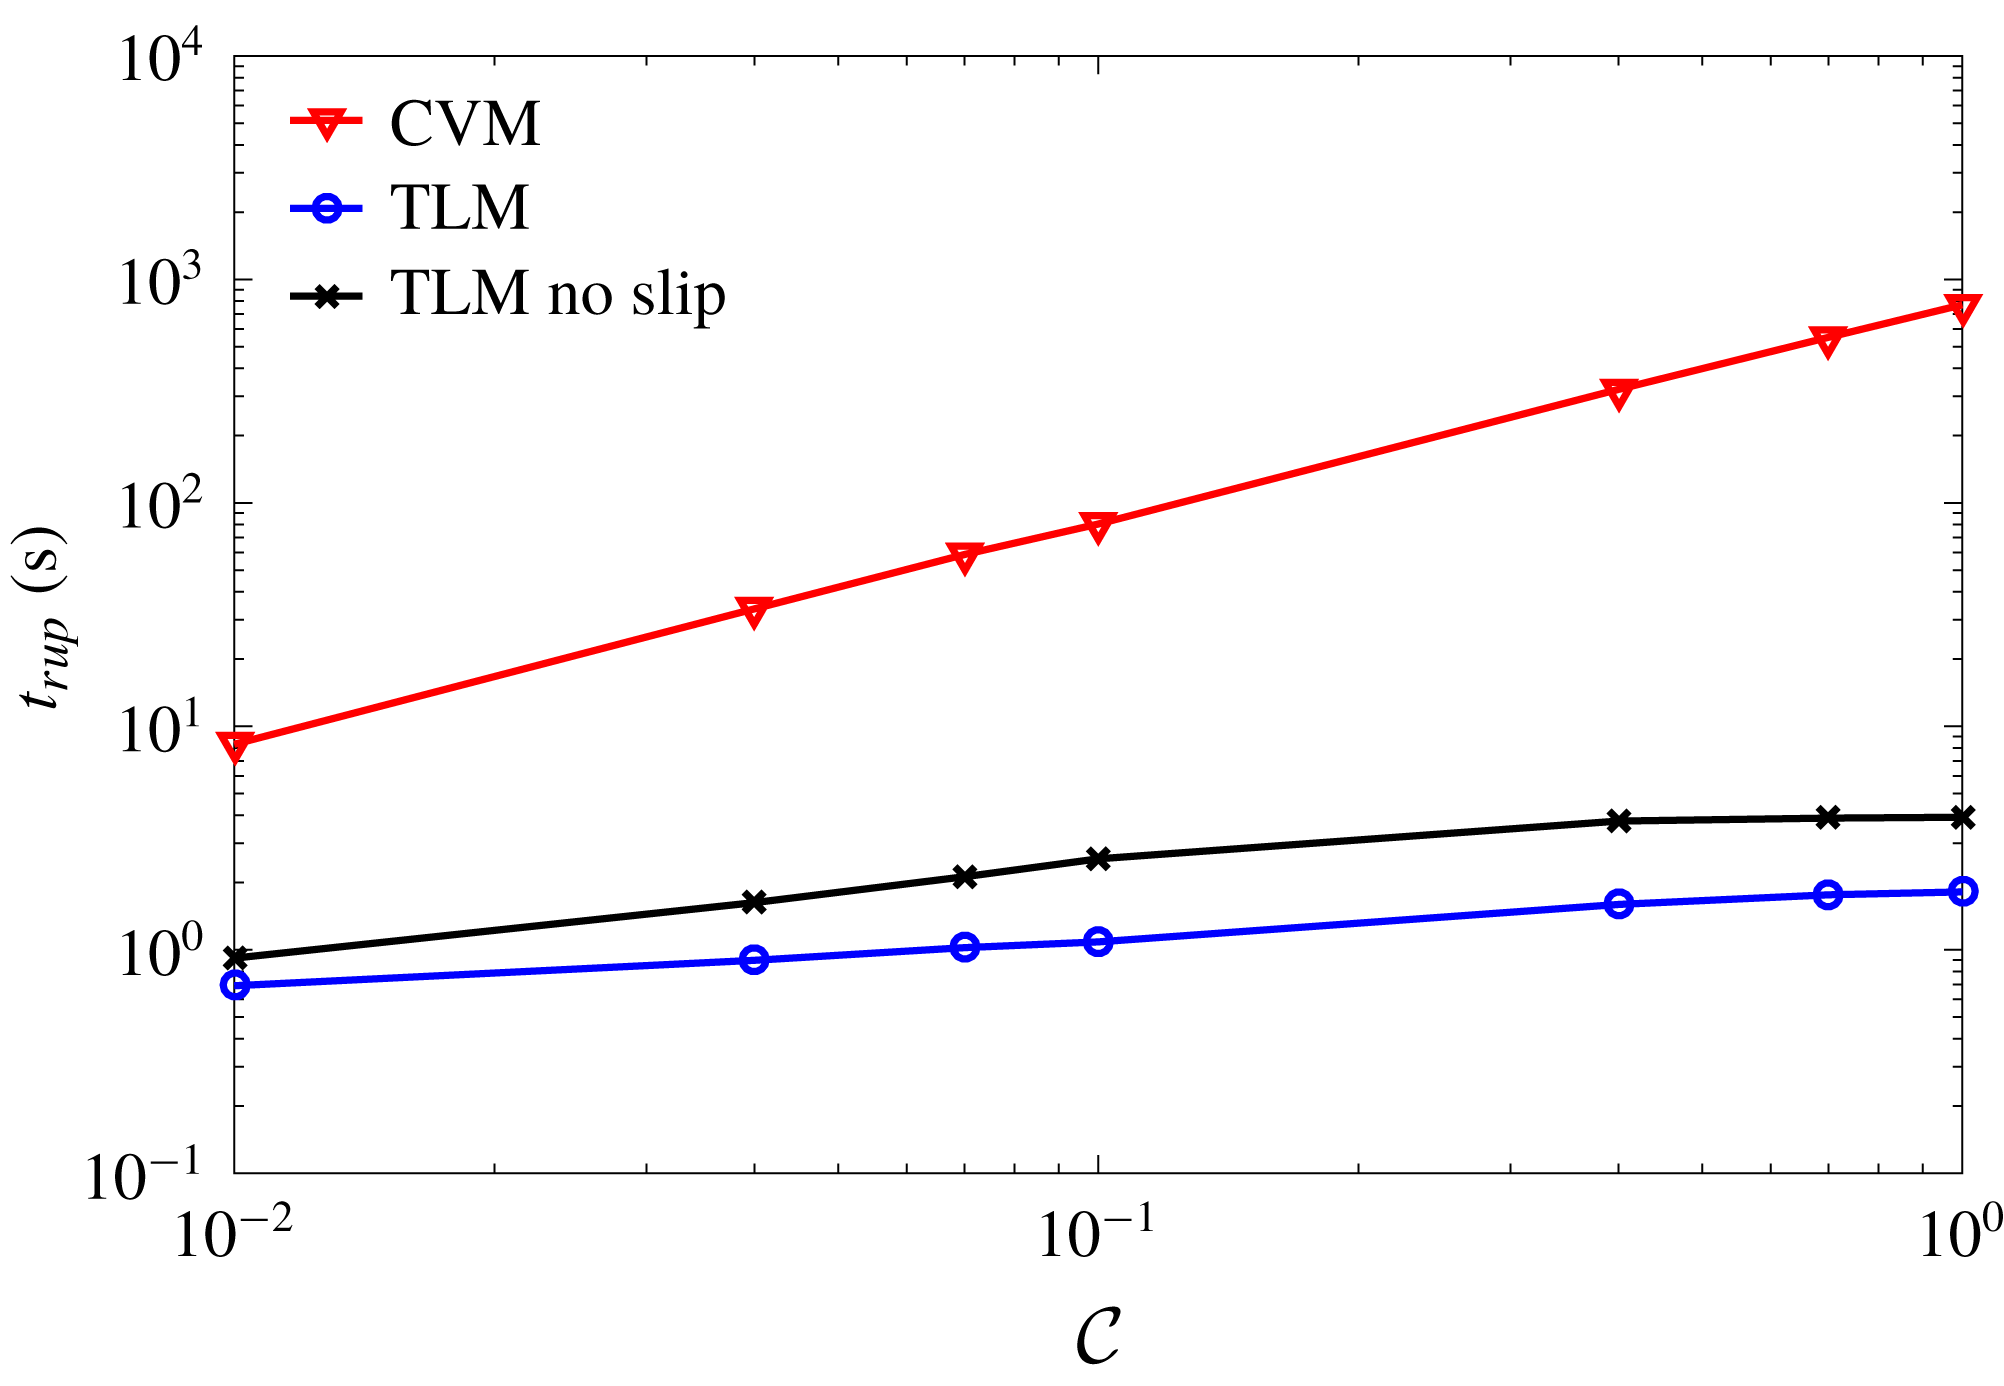
Comparison of the dimensional breakup time
 $t_{rup}$
predicted by the TLM and CVM for a healthy tear film over a range of the air–aqueous interfacial tension
 ${\mathcal{C}}$
. The following parameters are common to both models:
 $\unicode[STIX]{x1D707}_{r}=2$
,
 $h_{m}=0.2$
,
 $Pe_{s}=100$
,
 $\unicode[STIX]{x1D6FD}=0.1$
and
 ${\mathcal{M}}=1$
. In addition, we have used
 $\unicode[STIX]{x1D6FF}_{m}=0.01$
and
 $\unicode[STIX]{x1D6E5}_{b}=100$
for the CVM, and
 ${\mathcal{C}}_{m}=10$
,
 ${\mathcal{A}}_{1}={\mathcal{A}}_{2}={\mathcal{A}}_{3}={\mathcal{A}}_{4}=1$
for the TLM. A prediction of a no-slip TLM with
 $\unicode[STIX]{x1D6FD}=0$
is also plotted for comparison.
We compare the two models under conditions that correspond roughly to the tear films of healthy eyes, with slip on the ocular surface (Zhang et al.
Reference Zhang, Craster and Matar2003a
; Braun & King-Smith Reference Braun and King-Smith2007; Heryudono et al.
Reference Heryudono, Braun, Driscoll, Maki, Cook and King-Smith2007). Figure 12 plots the predicted
 $t_{rup}$
for a range of
 ${\mathcal{C}}$
, the scaled dimensionless air–tear interfacial tension. For both models,
 $t_{rup}$
increases with
 ${\mathcal{C}}$
, as one may expect. However, the predictions using the two models differ by orders of magnitude under the given set of parameters. In dimensional terms, the TLM predicts a range of
 $t_{rup}$
from 0.7 s to less than 2 s for
 $10^{-2}\leqslant {\mathcal{C}}\leqslant 1$
. Meanwhile, the CVM predicts
 $t_{rup}$
ranging from 8 s to approximately 760 s over the same range of
 ${\mathcal{C}}$
, with
 $t_{rup}=80.4$
s for the baseline value of
 ${\mathcal{C}}=0.1$
. It is interesting to note that our TLM predicts a much shorter
 $t_{rup}$
than that of Zhang et al. (Reference Zhang, Craster and Matar2003a
) cited above. This is partly due to their assumption of no slip on the substrate and a power-law viscosity in the mucus layer. By imposing no-slip boundary condition in our TLM, we obtain
 $t_{rup}$
between 1 and 4 s (figure 12), which is comparable to
 $t_{rup}=7.7$
s that Zhang et al. (Reference Zhang, Craster and Matar2003a
) predicted for a Newtonian mucus layer with no slip.
Naturally one would seek experimental data to serve as a benchmark against which to compare the predictions of the CVM and TLM. Tear-film breakup time can be measured using invasive (e.g. fluorescence imaging) as well as non-invasive (e.g. retroillumination, keratometry, corneal topography measurements) techniques (Sweeney, Millar & Raju Reference Sweeney, Millar and Raju2013). Unfortunately, both types of measurements are affected by a variety of biological and environment factors that are difficult to control, including ambient air humidity and temperature, variations in the chemical makeup of healthy tear films, partial blinking, illumination intensity, and the concentration, pH and the type of fluorescein used. Consequently, measured
 $t_{rup}$
for healthy eyes falls in a wide range, with poor reproducibility (Sweeney et al.
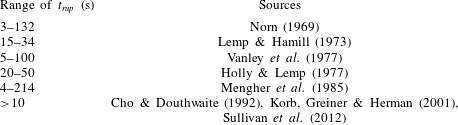
Reference Sweeney, Millar and Raju2013). Table 2 summarizes all such data as we can find in the literature.
Experimental data for the breakup time
 $t_{rup}$
of healthy tear films.
Compared with the experimental data, the TLM prediction of
 $t_{rup}=0.7$
–2 s is too short, and amounts to almost instant breakup. This can be attributed to the additional van der Waals force on the thin mucus layer that is assumed in the TLM, which hastens the rupture of the mucus–aqueous interface, and in turn making way for the breakup of the aqueous layer. Such a breakup sequence has been illustrated by Zhang et al. (Reference Zhang, Craster and Matar2003a
). As the dynamics of the mucus layer dominates the breakup of the whole tear film, the air–liquid interfacial tension has a relatively minor role in the TLM. Hence,
 $t_{rup}$
does not vary as much with
 ${\mathcal{C}}$
as in the CVM. In comparison, the CVM predicts
 $t_{rup}$
that ranges up to hundreds of seconds, in better agreement with the measured data in table 2. This supports our initial argument that the CVM, with a suitable viscosity profile, more closely represents the true structure of the tear film than the TLM.
6 Conclusion
As an alternative to the prevailing TLM for the tear film, we have proposed a CVM for studying the breakup of a tear film driven by van der Waals attraction. This is motivated by experimental evidence that shows a continuous profile of mucin concentration through the thickness of the tear film, without a distinct boundary separating a mucus layer and an aqueous layer. Using linear stability analysis and nonlinear numerical simulations, we have explored how mucin and viscosity variations across the depth of the tear film affect the speed of tear-film rupture. Within the range of parameters studied, whose evaluation is based on available experimental measurements and prior modelling, the CVM predicts the following main results.
(i) With the mean viscosity held constant, a profile that features more viscous fluids next to the solid substrate retards the growth of the interfacial instability and delays the tear-film breakup. This trend holds in the linear and nonlinear stages alike.
(ii) Mucin diffusion affects breakup by modifying the mucin and viscosity profiles. Starting with an initial profile with higher mucin concentration near the substrate than in the upper part of the tear film, the diffusion destabilizes the film and hastens its breakup.
(iii) The CVM predicts breakup times in better agreement than the TLM with experimental measurements for healthy tear films. This supports our intuition that the CVM better represents the structure of the tear film, and consequently its fluid dynamics.
(iv) The lipid layer atop the tear film, treated as insoluble surfactants, has a stabilizing effect against rupture through the Marangoni stress. In contrast, the slip on the corneal epithelium destabilizes the tear film and shortens the rupture time. These effects are consistent with previous TLM predictions.
An interesting inference from the CVM prediction is that eye diseases are likely to hasten tear-film breakup, in agreement with clinical observations (Norn Reference Norn1969; Dohlman et al. Reference Dohlman, Friend, Kalevar, Yagoda and Balazs1976; Sharma & Ruckenstein Reference Sharma and Ruckenstein1985). One possible mechanism is suggested by our examination of the effect of mucin diffusivity. MAMs are largely immobile, and we represent this by a low mucin diffusivity. As pathological conditions compromise the MAMs in the glycocalyx, more of the mucin can diffuse into the aqueous medium and reduce the viscosity gradient in the tear film. Our model predicts that this leads to shorter breakup times, up to a factor of about 2 (cf. figure 7). Another potential cause of faster rupture is the slip on the corneal surface, which may be aggravated by the loss of MAMs. Conceivably, both mechanisms can be tested in careful experiments that monitor the structural degradation of the corneal glycocalyx caused by eye diseases (Bron et al. Reference Bron, Argüeso, Irkec and Bright2015). The model predictions suggest the interesting possibility of using the tear-film breakup as a diagnostic of the health of the glycocalyx and of impending eye infections (Yokoi et al. Reference Yokoi, Georgiev, Kato, Komuro, Sonomura, Sotozono, Tsubota and Kinoshita2017). We should caution, however, that eye infection is a complex disease involving myriad factors. For example, inflammation and immune responses may change the composition and structure of the tear film as well, and such factors may complicate the linkage between tear-film breakup and eye diseases.
Finally, we should point out the shortcomings of the CVM as presented here. In building a new model that deviates from the paradigm of the layered tear-film structure, we have neglected many complicating factors that exist in the real tear film. These include, among others, evaporation, flow due to the blinking cycle, gravity-induced drainage, non-Newtonian rheology and transport of mucin due to osmosis. Many of these factors have been studied in single-layer models or TLMs (Zhang et al. Reference Zhang, Craster and Matar2003a ; Jones et al. Reference Jones, Please, McElwain, Fulford, Roberts and Collins2005; Siddique & Braun Reference Siddique and Braun2015). Moreover, there is considerable uncertainty in some of the parameter values, e.g. the mucin diffusivity and the corneal slip. For lack of experimental data, we are forced to make rough estimations. Of course, the TLM suffers from the same problem, perhaps more acutely for the greater number of parameters therein. For these reasons, we should see the present version of the CVM as a working model that attempts to better represent the structure of the tear film. By incorporating the neglected factors into the model and by evaluating the model parameters more accurately for healthy and diseased tear films, one can improve the CVM significantly in its predictive power.
Acknowledgements
The research was supported by grants from the IC-IMPACTS Centres of Excellence (Canada) and the Department of Biotechnology (India). J.J.F. also acknowledges support by the NSERC through Discovery grant no. 05862. A.S.V. was supported by a fellowship from MHRD, Government of India, and H.N.D. acknowledges partial support from Early Career Research Award no. ECR/2015/000086.
Appendix A. Parameters in the TLM
Consider the TLM with a mucus layer of thickness
 $h_{m}$
below an aqueous layer, the total tear film thickness being
 $h_{a}$
. Owing to van der Waals forces, we modify the capillary pressure inside the mucus and aqueous layers by disjoining pressures:
 $$\begin{eqnarray}\displaystyle & P_{m}=p_{m}+\unicode[STIX]{x1D719}_{m}, & \displaystyle\end{eqnarray}$$
 $$\begin{eqnarray}\displaystyle & P_{a}=p_{a}+\unicode[STIX]{x1D719}_{a}, & \displaystyle\end{eqnarray}$$
where
 $p_{a}$
,
 $p_{m}$
and
 $\unicode[STIX]{x1D719}_{a}$
,
 $\unicode[STIX]{x1D719}_{m}$
are the capillary and disjoining pressure terms at the two interfaces, respectively, and are expressed as
 $$\begin{eqnarray}p_{m}=-{\mathcal{C}}h_{a,xx}-{\mathcal{C}}_{m}h_{m,xx},\quad p_{a}=-{\mathcal{C}}h_{a,xx},\end{eqnarray}$$
 $$\begin{eqnarray}\unicode[STIX]{x1D719}_{m}=\frac{{\mathcal{A}}_{1}}{h_{m}^{3}}+\frac{{\mathcal{A}}_{2}}{h_{a}^{3}},\quad \unicode[STIX]{x1D719}_{a}=\frac{{\mathcal{A}}_{3}}{h_{a}^{3}}+\frac{{\mathcal{A}}_{4}}{(h_{a}-h_{m})^{3}},\end{eqnarray}$$
where the Hamaker constants
 ${\mathcal{A}}_{1,2,3,4}$
are as defined in the literature (Sharma Reference Sharma1998; Sharma, Khanna & Reiter Reference Sharma, Khanna and Reiter1999; Zhang et al.
Reference Zhang, Craster and Matar2003a
; Bandyopadhyay & Sharma Reference Bandyopadhyay and Sharma2006). In our implementation, these are made dimensionless by the Hamaker constant
 ${\mathcal{A}}$
of table 1. Of the two scaled interfacial tensions,
 $$\begin{eqnarray}{\mathcal{C}}=\frac{\unicode[STIX]{x1D716}^{3}\unicode[STIX]{x1D70E}_{a}}{\unicode[STIX]{x1D707}_{a}V},\quad {\mathcal{C}}_{m}=\frac{\unicode[STIX]{x1D716}^{3}\unicode[STIX]{x1D70E}_{m}}{\unicode[STIX]{x1D707}_{a}V},\end{eqnarray}$$
 ${\mathcal{C}}$
is for the air–aqueous interface (
 $\unicode[STIX]{x1D70E}_{a}$
and
 $\unicode[STIX]{x1D707}_{a}$
being the air–aqueous surface tension and the aqueous viscosity), and is identical to its CVM counterpart. Here
 ${\mathcal{C}}_{m}$
is for the mucus–aqueous interface (
 $\unicode[STIX]{x1D70E}_{m}$
being the mucus–aqueous interfacial tension), and is unique to the TLM. The surface Péclet number for the lipids and the Maragoni number are the same as in CVM:
 $$\begin{eqnarray}Pe_{s}=\frac{VL}{D_{s}},\quad {\mathcal{M}}=\frac{\unicode[STIX]{x1D716}\unicode[STIX]{x1D6E4}_{m}}{\unicode[STIX]{x1D707}_{a}V}\frac{\unicode[STIX]{x2202}\unicode[STIX]{x1D6E4}}{\unicode[STIX]{x2202}\unicode[STIX]{x1D70E}},\end{eqnarray}$$
as is the Navier slip length
 $\unicode[STIX]{x1D6FD}$
. Finally, the mucus–aqueous viscosity ratio
 $\unicode[STIX]{x1D707}_{r}$
and the initial position of the mucus–aqueous interface
 $h_{m}$
have counterparts in the CVM. In the above, the characteristic velocity is defined using the Hamaker constant
 ${\mathcal{A}}$
:
 $$\begin{eqnarray}V=\frac{{\mathcal{A}}}{6\unicode[STIX]{x03C0}\unicode[STIX]{x1D707}_{a}HL},\end{eqnarray}$$
where
 $H$
and
 $L$
are the characteristic thickness and horizontal length scale.