1. Introduction
Granulites have been discovered during a wide range of geological time, ranging from the Neoarchean all the way up to the Miocene, which is quite recent in geological terms and in a wide range of tectonic settings (Pownall et al. Reference Pownall, Hall, Armstrong and Forster2014). In the continental correlation of the supercontinent models, these rocks are considered as of great importance. In this context, the granulites that are located inside the South Delhi Terrane of the ADMB in the northwest region of India are quite significant.
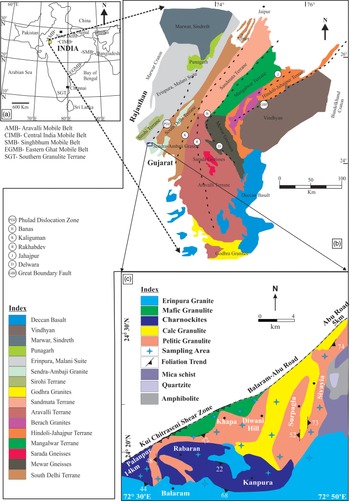
There are three stratigraphic units of rocks that constitute the Aravalli mountains in northwest India: the Bhilwara terrane (Archaean), Aravalli supergroup (Palaeoproterozoic) and Delhi supergroup (Meso-Neoproterozoic). The Banded Gneissic Complex (BGC) is located in the Aravalli-Delhi Mobile Belt (ADMB), which is included in the Archean Bhilwara terrane (Fig. 1a, b). Both of these names refer to the basement of the ADMB (Heron, 1953; Ahmad and Mondal, Reference Ahmad and Mondal2016). Sandmata complex and Mangalwar complex can be located in Bhilwara terrane (Fig. 1b). The ancient granulites and charnockites that date back to 1725–1622 Ma were emplace within the Sandmata Complex during the Aravalli orogeny (Sarkar et al. Reference Sarkar, Burman and Corfu1989; Fareeduddin & Kroner, Reference Fareeduddin and Paliwal1998; Roy et al. Reference Roy, Kröner, Rathore, Laul and Purohit2012). Kishangarh nepheline syenite intruded at 1490 ± 150 Ma, while South Delhi Terrane (SDT) granites were also intruded at 1012 ± 78 Ma (Crawford, Reference Crawford1970). Additionally, due to deformations that occurred millions of years ago in the Aravalli-Delhi mountain ranges, the Sandmata rocks that are found along the terrane boundary have been bent (Naha & Halyburton, Reference Naha and Halyburton1974; Sen, Reference Sen1980; Srivastava, Reference Srivastava2001; Bhowmik et al. Reference Bhowmik, Bernhardt and Dasgupta2010; Singh et al. Reference Singh, De Waele, Karmakar, Sarkar and Biswal2010, Reference Singh, Shukla, Umasankar, Biswal and Biswal2020; Roy et al. Reference Roy, Kröner, Rathore, Laul and Purohit2012, Reference Roy, Dutt and Rathore2016; Tiwari & Biswal, Reference Tiwari and Biswal2019; Biswal et al. Reference Biswal, Pradhan, Sharma, Tiwari, Beniest, Behera, Singh, Saraswati, Bharadwaj, Umasankar, Singh, Sarkar, Mahadani and Saha2022; Tiwari et al. Reference Tiwari, Beniest, Rai, Chatterjee, Daphale, Biswal, Yadav and Kundu2022). Therefore, the older ages of the Mangalwar and Sandmata complexes are reset to younger ages, particularly in the northern part of the Banas shear zone (Bhowmik & Dasgupta, Reference Bhowmik and Dasgupta2012; Ahmad & Mondal, Reference Ahmad and Mondal2016; Kumar et al. Reference Kumar, Prakash, Saha, Corfu and Bhattacharya2019; D’Souza et al. Reference D’Souza, Prabhakar, Sheth and Xu2021). It is generally agreed that the collision between the Bundelkhand craton and the Marwar craton was the primary driving force behind the orogeny that resulted in the development of the ADMB (Bhowmik et al. Reference Bhowmik, Bernhardt and Dasgupta2010; Singh et al. Reference Singh, De Waele, Karmakar, Sarkar and Biswal2010, Reference Singh, Shukla, Umasankar, Biswal and Biswal2020; Tiwari & Biswal, Reference Tiwari and Biswal2019; Biswal et al. Reference Biswal, Pradhan, Sharma, Tiwari, Beniest, Behera, Singh, Saraswati, Bharadwaj, Umasankar, Singh, Sarkar, Mahadani and Saha2022; Tiwari et al. Reference Tiwari, Beniest, Rai, Chatterjee, Daphale, Biswal, Yadav and Kundu2022).
(a) Map of India showing different tectonic elements, modifed after Prakash et al. (Reference Prakash, Kumar, Rai, Singh, Singh, Yadav, Jaiswal, Srivastava, Yadav, Bhattacharjee and Singh2021). (b) Geological map of the Aravalli Mobile Belt (modified after Prakash et al. Reference Prakash, Kumar, Rai, Singh, Singh, Yadav, Jaiswal, Srivastava, Yadav, Bhattacharjee and Singh2021). (c) Geological map of the study area showing sample location (map modified after Srikarni et. al, Reference Srikarni, Limaye and Janardhan2004; Singh et al. Reference Singh, De Waele, Karmakar, Sarkar and Biswal2010; Prakash et al. Reference Prakash, Kumar, Rai, Singh, Singh, Yadav, Jaiswal, Srivastava, Yadav, Bhattacharjee and Singh2021; Biswal et al. Reference Biswal, Pradhan, Sharma, Tiwari, Beniest, Behera, Singh, Saraswati, Bharadwaj, Umasankar, Singh, Sarkar, Mahadani and Saha2022).

The Diwani hills of SDT are situated in the Banaskantha district of Gujarat, which is a part of northwestern region of India. The granulites are exposed along the southern flank of Balaram-Abu road. These hills are composed of Precambrian crystalline rocks of both igneous and metamorphic in nature. In 1978, Desai and co-workers conducted the first investigation to demonstrate that granulite-facies rocks can be found in the region surrounding the Balaram-Abu Road. Near the Balaram-Abu Road, the rocks that occur frequently are charnockites, norites-metanorites, pelitic granulite, calc-granulite, mafic-granulite and granite (Desai et al. Reference Desai, Patel and Merh1978). Pelitic granulite found in the region have a structure similar to gneiss and are composed of minerals that are organized into coarse bands of varying shades of light and dark colours having characteristic minerals such as spinel, cordierite, garnet, sillimanite, hypersthene, feldspar, quartz, biotite and plagioclase. The lighter bands are composed of quartzo-feldspathic material, while the darker bands are predominantly composed of cordierite and contain reddish brown garnets scattered/dispersed throughout (Bhowmik et al. Reference Bhowmik, Bernhardt and Dasgupta2010; Singh et al. Reference Singh, De Waele, Karmakar, Sarkar and Biswal2010, Reference Singh, Shukla, Umasankar, Biswal and Biswal2020; Tiwari & Biswal Reference Tiwari and Biswal2019; Prakash et al. Reference Prakash, Kumar, Rai, Singh, Singh, Yadav, Jaiswal, Srivastava, Yadav, Bhattacharjee and Singh2021; Biswal et al. Reference Biswal, Pradhan, Sharma, Tiwari, Beniest, Behera, Singh, Saraswati, Bharadwaj, Umasankar, Singh, Sarkar, Mahadani and Saha2022; Tiwari et al. Reference Tiwari, Beniest, Rai, Chatterjee, Daphale, Biswal, Yadav and Kundu2022).
The goal of this research is to investigate the geochemistry of major and trace elements in conjunction with the monazite geochronology of pelitic granulite from the SDT of ADMB, north Gujarat (Fig. 1c) to offer insight into the nature of protolith, tectonic context of the basin and provenance. In addition, we have provided a probable explanation for the evolution of pelitic granulite of the SDT.
2. Geological setting
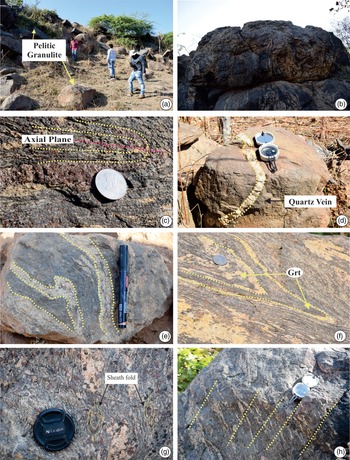
The ADMB is a significant crustal morphotectonic unit, outstandingly exposed in the northwestern region of India. The study area is located in the southern portion of the Delhi supergroup, which is part of ADMB. This region consists of pelitic granulite, calc-granulite, mafic granulite and a variety of intrusives (Fig. 1). Pelitic granulite can be seen in the good exposures across the study area, such as close to the Dhabeli village (Fig. 2a, b). The area under investigation reveals numerous signatures of tectonic deformations, which may be correlated on the regional scale. Near the village of Chikanavos, a tight isoclinal fold has developed as a response to the intense compressional regime (Fig. 2c). In some areas, the pelitic granulite grade into granite gneiss by passing through a zone of migmatites and display varying degrees of migmatization supposed to occur as a result of the gradual depletion of aluminosilicates and increase in quartzofeldspathic components. At certain locations, quartz veins display a discordant relationship with the country rocks (Fig. 2d). Strong evidences of the effects of regional metamorphism and partial melting are common in the study area in the form of migmatized pelitic granulite showing flow folding with leucocratic and melanocratic bandings near Khapa village (Fig. 2e). The presence of the high concentration of garnet crystallization in the core of the isoclinal folds has been observed, e.g., in the vicinity of Khapa village (Fig. 2f). Sheath folds, as evidence of intense deformation, have also been observed in the pelitic granulite (Fig. 2g). Parallel joints are also frequently common in the pelitic granulite throughout the study area (Fig. 2h). It has been observed that the gneissosity of pelitic granulite continues unabatedly into the granite gneiss via migmatites, becoming a part of the granite gneiss. In a manner that is consistent with the gneissosity of the granite gneiss, pelitic granulite-restites can be found embedded within the granite. This granite gneiss was equated with other granites of the SDT belt and identified as the Ambaji granite by the Geological Survey of India (1980). The Ambaji granite shows Rb-Sr isochron age of 850 Ma (Choudhary et al. Reference Choudhary, Gopalan and Sastry1984). Volcanic rocks interlayered with metasediments are known as meta-rhyolite and meta-basalt, which most likely originated from syn-sedimentary volcanism. The metasediments and granite gneiss have been disrupted by the intrusion of a gabbro-norite-basic granulite suite, which the Geological Survey of India in 1980 referred to as the Phulad Ophiolite suite. The emplacement of gabbro-norite-basic granulite intrusives is geographically and temporally connected to the granulite facies metamorphism that occurred in the region. Thus, the amphibolite and granulite facies rocks, as well as certain obducted ophiolites, basement gneisses and blueschists, make up the SDT (Volpe & Macdougall, Reference Volpe and Macdougall1990; Tobisch et al. Reference Tobisch, Collerson, Bhattacharya and Mukhopadhyay1994; Biswal et al; Srikarni et al. Reference Srikarni, Limaye and Janardhan2004; Mukhopadhyay et al. Reference Mukhopadhyay, Chattopadhyay and Bhattacharyya2010; Bhowmik et al. Reference Bhowmik, Dasgupta, Baruah and Kalita2018). The age of the South Delhi orogeny can be restricted between 1.7 and 0.8 Ga ago experiencing multiple folding events and high-grade metamorphism (Choudhary et al. Reference Choudhary, Gopalan and Sastry1984; Volpe & Macdougall, Reference Volpe and Macdougall1990; Tobisch et al. Reference Tobisch, Collerson, Bhattacharya and Mukhopadhyay1994; Deb & Thorpe, Reference Deb, Thorpe, Deb and Goodfellow2001; Deb et al. Reference Deb, Thorpe, Krstic, Corfu and Davis2001; Pandit et al. Reference Pandit, Carter, Ashwal, Tucker, Torsvik, Jamtveit and Bhushan2003). It is believed that basin was likely closed due to subduction along the Kaliguman shear zone, which serves as a contact/suture between the Delhi Terrane and the Aravalli Terrane (Sugden et al. Reference Sugden, Deb, Windley and Naqvi1990; Biswal et al. Reference Biswal, Gyani, Parthasarathy and Pant1998a).
Field photographs of the principal rock types in the study area: (a) Study area shows well exposures of pelitic granulites near the village of Dhabeli. (b) Typical pelitic granulites with banding of colours. (c) Tight isoclinal fold is developed in response to severe compressional regeim near Chikanavos village. (d) Field photograph illustrating the evolution of a quartz vein near kanpura. (e) Pelitic granulites having alternating bands of luecocritic and melanocritic in near khapa village. (f) High concentration of garnet crystallization in the core of folding in the vicinity of Khapa village. (g) Core of sheath fold surrounded by folded migmatitic bands in pelitic granulites near Dhanpura village. (h) Joints with no obserable movement of blocks are also developed in pelitic granulites near Diwani hills.

In terms of brittle, ductile and brittle-ductile deformations, the study area is characterized by the presence of a great number of deformed zones that have given rise to shears and faults at regional scale, including the Kui-Chitraseni shear zone, the Surpagla shear zone and the Deldar shear zone. The Kui-Chitraseni shear zone is the extension of the Phulad Dislocation Zone (PDZ), and it stands out as an enormous fault striking NNE-SSW. It runs roughly parallel to the Banas river, and it is considered to preserve evidence of reactivation of the fault (Biswal et al. Reference Biswal, Sarkar, Pal and Chakaraborty2004; Sarkar & Biswal, Reference Sarkar and Biswal2005; Anbazhagan et al. Reference Anbazhagan, Biswal, Roy, Kusuma, Banerjee and Bhattacharya2006; Bhowmik et al. Reference Bhowmik, Bernhardt and Dasgupta2010; Singh et al. Reference Singh, De Waele, Karmakar, Sarkar and Biswal2010, Reference Singh, Shukla, Umasankar, Biswal and Biswal2020; Tiwari & Biswal, Reference Tiwari and Biswal2019; Tiwari et al. Reference Tiwari, Beniest, Rai, Chatterjee, Daphale, Biswal, Yadav and Kundu2022; Biswal et al. Reference Biswal, Pradhan, Sharma, Tiwari, Beniest, Behera, Singh, Saraswati, Bharadwaj, Umasankar, Singh, Sarkar, Mahadani and Saha2022). Exhumation of the granulites terrene was caused by thrusting and obduction that occurred between the terrane borders of the Surpagla and Kui-Chitraseni faults.
3. Textural relationships
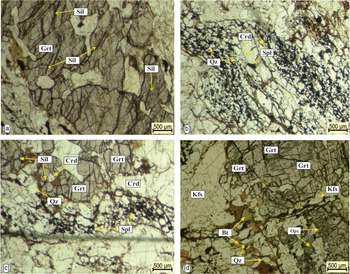
The detailed petrographic study revealed the presence of diverse mineral assemblages. Garnet, spinel, K-feldspar, biotite, quartz, plagioclase, orthopyroxene and cordierite are the main components of the pelitic granulite. In addition to the minerals mentioned above, trace amounts of magnetite, ilmenite, rutile, zircon, graphite and apatite are also present. Prograde stage of metamorphism is marked by the presence of sillimanite as inclusion within the garnet (Fig. 3a). Cordierite most ften occurs as larger grain and is frequently found in close association with spinel (Fig. 3b). Cordierite grains are found to be very close to spinel and quartz. The probable reaction for such texture is combination of spinel and quartz give rise to cordierite. The subsequent stage is characterized by the resorption of garnet through the development of spectacular symplectites (a linear clump of spinel with quartz and cordierite, Fig. 3c) along with cordierite forming reaction, diagnostic of decompressional regime. During the late stage, biotite-quartz symplectite replaced with the garnet blast (Fig. 3d).
Photomicrographs of pelitic granulites. (a) Sillimanite occurs as inclusions within garnet. (b and c) Symplectitic intergrowth of spinel and cordierite. (d) Biotite quartz symplectites replaces garnet.

4. Mineral chemistry
The Electron Probe Micro Analyzer (EPMA) CAMECA SXFive instrument equipped with SXFive software at the DST-SERB National Facility, Department of Geology (Center of Advanced Study), Institute of Science, Banaras Hindu University has been used to detect the mineral compositions of representative rock types from the Diwani hills for the purpose of mineral chemistry. In order to accomplish this goal, in the beginning, the polished thin sections were given a layer of carbon that was 20 nanometers thick so that electron probe microanalyses could be performed on them with the assistance of the LEICA-EM ACE200 apparatus.
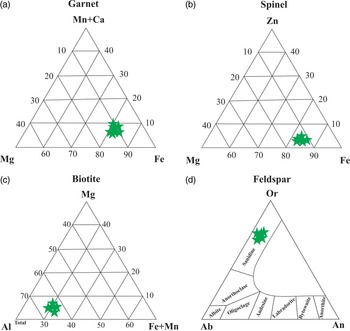
The microprobe data and structural formulations for Garnet based on 12 oxygen a.p.f.u. from pelitic granulite are shown in Table 1a. The XMg content of the garnet ranges from 0.081 to 0.134. The analysed garnets were plotted in a ternary diagram consisting of Fe, Mg and (Ca + Mn), which reveals the concentration in the almandine and pyrope zones (Fig. 4a). The microprobe data for Orthopyroxenes are presented in Table 1a, together with the structural formulations based on 6 oxygen a.p.f.u. The Al2O3 ranges between 3.84 and 4.99, whereas MgO reaches upto 17.37 weight percent. XMg ranges from 0.498 to 0.531. The examined spinel is a solid solution of hercynite mostly, which is iron rich. The hercynite (Fe2Al2O4) that makes up the majority of the spinel in the pelitic granulite has XMg values that range between 0.066 and 0.144. Al2O3 is found in spinel in high concentrations (up to 56.56 weight %), as is FeO (41.67 weight %) (Table 1b). Hercynite (Fe2Al2O4) makes up the majority of spinel in the rocks that were examined, and there is only a trace amount of zinc oxide (less than 0.96 weight %). When plotted in a ternary diagram consisting of ZnAl2O3 (gahnite), MgAl2O4 (spinel) and FeAl2O4 (hercynite), the composition of spinel is found to be rich in hercynite (Fig. 4b). The structural formulations (based on 22 oxygen a.p.f.u.) and microprobe analyses of Biotite show a wide range of XMg values (Table 1b), ranging from 0.204 to 0.536. The compositions of biotite are plotted in Mg – Al – (Fe + Mn) triangular diagram (Fig. 4c). Appreciable amounts of TiO2 are present with TiO2 concentrations ranging between 2.46 and 3.61 wt %. The analyses of Cordierite show low anhydrous sums of oxides, between 98 and 99 % (Table 1b). This indicates the presence of around 1–2 weight % of a hydrous component (H2O and/or CO2) that is present inside structural channels. The amount of XMg that is included in the cordierite ranges between 0.194 and 0.626. The orthoclase-content XOr [K/(K + Na + Ca)] in K-feldspar ranges between 0.822 and 0.883 (Fig. 4d). The analyzed composition of sillimanite closely resembles its ideal composition. Al2O3 and SiO2 are present as major oxides in the sillimanite structure. The Si-content ranges between 1.437 and 1.626 pfu, whereas Al-content varies from 3.161 to 3.409 pfu. Microprobe analyses of ilmenite, on the whole, reveal low anhydrous sums of oxides, which translates to a percentage range of 98.20–99.12% (Table 1c). MnO, MgO and CaO are present at trace levels while TiO2 ranges between 51.45 wt % and 53.95 wt % in the analysed ilmenite.
Representative microprobe analyses and structural formulae of garnet and orthopyroxene

(a) Triangular plot of garnet showing Fe-rich composition. (b) Triangular plot of spinel showing Fe-rich composition. (c) Triangular plot of biotite showing relatively high Fe + Mn and Al content as compared to Mg content. (d) Triangular plot of feldspar showing higher concentration of sanidine and oligoclase composition.

Representative microprobe analyses and structural formulae of spinel, biotite and cordierite

Representative microprobe analyses and structural formulae of K-feldspar, sillimanite and ilmenite

5. Geochemistry of whole-rock samples
5.a. Analytical method
Whole-rock geochemical data were carried out at Bureau Veritas Commodities Ltd, Canada. (see for details: https://commodities.bureauveritas.com/metals minerals/exploration-and-mining/geoanalytical-services). Cautiously fresh and unfractured samples have been selected for this analysis to avoid any contamination. Lithium metaborate and lithium tetraborate fusion analysis, also known as LiBO2/Li2B4O7 fusion analysis, was used to determine the major element concentrations of granulites. This was then followed by ICP-ES procedures. The 4 Acid digestions Ultratrace ICP-MS method was used to test trace elements, which are typically less than 0.1% by weight. Mixtures of entire rock powders (0.5 g) and Li2B4O7 + LiBO2 (4.5 g) were taken into glass discs for the purpose of conducting major element analysis. The discs were then subjected to X-ray fluorescence spectroscopy. The chemical assay method was utilized to determine the FeO, while the wet chemical method was utilized to determine the loss on ignition (LOI).
5.b. Major element characteristics
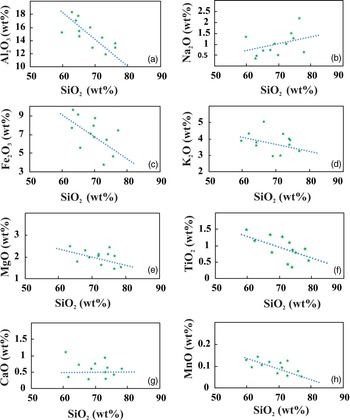
Twelve samples were selected in order to represent the pelitic granulite in the study area. Geochemical data of major and trace element are presented in Table 2a. Pelitic granulite show variable composition of silica (ranging from 59.46 to 82.47wt %) and low content of CaO (0.17 to 1.35 wt %), MgO (1.34 to 2.63 wt %), TiO2 (0.25 to 1.30 wt %) and MnO (0.02 to 0.15 wt %). The total alkali concentration varies from 2.30 to 6.15 wt %, whereas the Al2O3 content fluctuates from 6.89 to 18.19 wt %. The range of K2O is greater (1.83 and 5.53 wt %) as compared to Na2O (0.18 and 2.81 wt %). The pelitic granulite have a K2O/Na2O ratio that ranges from 0.33 to 3.00, indicating that they contain a significant amount of K-feldspar. The geochemistry of the pelitic granulite in the area that was investigated provides some support for the hypothesis that the protolith has an arkosic to shaley character. Al2O3, Fe2O3, K2O, TiO2, MgO and MnO all show a systematic reduction with increasing SiO2 in the Harker variation graphs (Fig. 5), but Na2O shows a systematic increase with rising SiO2. However, as shown in Fig. 5, there is no correlation between SiO2 and CaO.
Chemical composition of pelitic granulite. Major oxides (%) and rare earth elements (PPM)

Harker variation graphs, showing the relation of Al2O3, Fe2O3, K2O, TiO2, MgO, MnO, Na2O and CaO with increase of SiO2.

5.c. Trace element characteristics
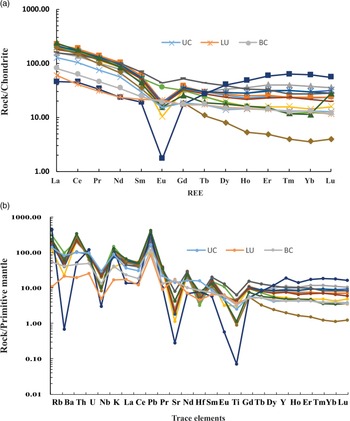
Geochemical data of trace elements and rare earth elements (REE) are presented in Table 2b. Tables 2 and 3 present all important geochemical information about pelitic granulite. The rare earth element pattern reveals a negative Eu anomaly together with a moderate LREE enrichment over the HREE (Fig. 6a), which indicates that the source of sediments has a likely composition similar to that of the upper crust. Compositions of the upper crust (UC), lower crust (LC) and bulk (BC) are plotted alongside sample data on spidergrams. All of the samples have a character that is comparable to the upper crust (the composition of the crust was taken from Taylor and McLennan, Reference Taylor and McLennan1985). This also suggests that the source of sediments is upper crust composition. Pelitic granulite samples show similar trace element patterns in the primitive mantle-normalized trace element and spidergrams (Fig. 6b). These patterns are depleted in high field-strength elements (Nb, Ta and Ti) and enriched in large-ion lithophile elements (Rb, Th, U, K and Pb), suggesting that they are typical of continental crust composition. This observation is further supported with those of Biswal et al. Reference Biswal, Gyani, Parthasarathy and Pant1998. However, the Sr, Nd and Pb compositions of the samples show large variations, which indicate two sources (felsic and mafic) of the sediments. The distribution of high field strength elements in the pelitic granulite, such as Zr, Hf, Nb and Ta, shows a wide range of possible values. Zr in the pelitic granulites that were analysed ranged from 40.60 ppm to 92.90 ppm, although the ratio of Zr to Hf stays rather stable between the values of 22.43 and 40.44. Ta fluctuates between 0.50 and 1.40 ppm. The fact is that the samples are deficient in Ta and Nb as well as Zr and Hf that give support to the hypothesis that Ta and Nb are bound up in zircon.
Chemical composition of pelitic granulite. Major elements (%) and trace elements (PPM)

Comparison of geochemical values of the pelitic granulite of study area

(a) Chondrite-normalized rare earth elements (REE) patterns in the pelitic granulites samples and (b) primitive mantle normalize trace elements spider diagram.

The pelitic granulites of ADMB are distinguished by their high concentrations of U and Th (Table 2b), in contrast to the moderate abundances of high field strength elements such as Zr and Y. The amount of uranium ranges from 1.60 to 3.10 ppm, while that of thorium ranges from 5.30 to 37.50 ppm. As a result, the samples that are currently analysed are distinguished by having different U and Th enrichment similar to that of Sen et al. (Reference Sen, Ranganath, Rathaiah, Sen and Kak2009). An in-depth analysis of the Th/U ratio, which ranges from 1.70 to 19.70, reveals that there is a significantly greater abundance of Th than U in the pelitic granulites, which points to the presence of considerable thorium mineralization in the study area.
5.d. Implications on source rock characters
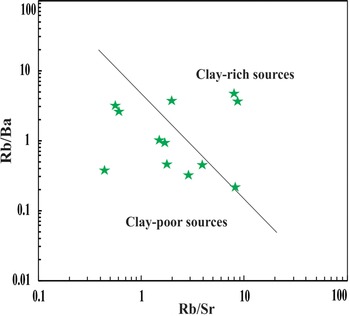
The ratio of Rb/Ba vs. Rb/Sr (Fig. 7) illustrates that the source of sediments is ancient rocks that are deficient in clay. It is worthwhile to mention here that according to Taylor and McLennan (Reference Taylor and McLennan1985), the Archaean sedimentary rocks contain geochemical features that are noticeably distinct from those of the Proterozoic sedimentary rocks (Table 4), despite the fact that some overlaps are detected in certain locations (Naqvi et al. Reference Naqvi, Condie and Allen1983: Gibbs et al. Reference Gibbs, Montgomery, O’Day and Erslev1986; Smith et al. Reference Smith, Dymek and Chadwick1992; Raj & Naqvi, Reference Raj and Naqvi1995). We recorded a compositional similarity with this area to Proterozoic sedimentary rocks, as shown in Table 4, a consistent strong negative Eu anomaly, a high K2O value, low K/Rb and La/Th ratios, high La/Sc and Th/Sc ratios, very low Ni and Cr contents and uniform Zr/Hf ratio are suggestive of a Proterozoic age for the protolith (Wildeman & Haskin, Reference Wildeman and Haskin1973; Dypvik & Brunfelt, Reference Dypvik and Brunfelt1976: McLennan et al. Reference McLennan, Nance and Taylor1980). According to Gyani (Reference Gyani, Desai and Ganapati1995), similar to Archaean supracrustals, the granulites of the Banded Gneissic Complex have low levels of SiO2 (58%), Th/U (3.5), high levels of MgO/A12O3 (0.31) and low levels of Na2O/A12O3 (0.2) (Gyani, Reference Gyani, Desai and Ganapati1995), whereas present observation noticed higher values of the above ratios for the pelitic granulite (Tables 2a and 2c). In addition to the geochemical criteria, the deformational history of the pelitic granulite of the present study area contrasts with that of the Aravalli supergroup and the Banded Gneissic Complex, both of which demonstrate the earliest folding along an east-west axis (Naha et al. Reference Naha, Mukhopadhyay, Mohanty, Mitra and Biswal1984; Roy, Reference Roy and Roy1988), while the pelitic granulite, along with other components of the SDT, do not exhibit any evidence of folding (Biswal, Reference Biswal1988). Our geochemical observations and interpretation in conjunction with the geochronological data infer that granulites metamorphism in the research area is significantly younger than the granulites of the Archaean supracrustals and Banded Gneissic Complex.
The composition of the protolith in the study area is depicted Rb/Ba vs Rb/Sr diagram, showing the source of sediments are deficient in clay.

Comparison of geochemical values of the pelitic granulite of the study area with rocks of different ages (McLennan et al. Reference McLennan, Nance and Taylor1980, Taylorand McLennan, Reference Taylor and McLennan1985)

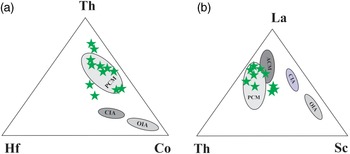
Since the chemistry of sediments in each tectonic setting is distinct, it is determined by the mobility of various elements as well as the recycling of sediments. The ratio of trace elements seen in the Th-Hf-Co (Fig. 8a) and La-Th-Sc (Fig. 8b) plots also provides support to the assumption that the probable tectonic environment might have been passive continental margins. The La/Sc, Ni/Co, Sc/Cr, La/Yb and K2O/Na2O geochemical values of the pelitic granulite of the study area also support our inference (Table 5).
Differentiating the plate tectonic setting based on (a) Th, Hf and Co plotting and (b) La-Th-Sc to demonstrate the passive continental margin.

Comparison of geochemical values of the pelitic granulite of the study area with rocks of different tectonic settings (Bhatia, Reference Bhatia1983; Bhatia, Reference Bhatia1985; Bhatia & Crook, Reference Bhatia and Crook1986)

6. Geochronology
6.a. Identification of monazite
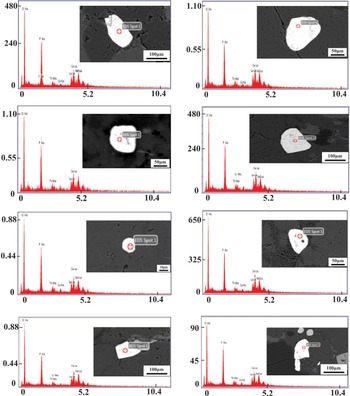
Monazite is found in the rocks of the study area as an accessory phase. Since it is difficult to differentiate between monazite grains from zircon grains based only on their appearance, monazite grains were located by analysing BSE image in the present study (Fig. 9).
Represents the backscattered images (BSE-SEM) of different monazite grains.

6.b. Monazite geochronology
The age of metamorphism and deformational history can be determined by means of electron microprobe analysed chemical dating, making it a useful tool in geological investigations (Williams Reference Williams1999). In the DST-SERB National Facility at the Department of Geology (Center of Advanced Study) at the Institute of Science, Banaras Hindu University, Electron Probe Micro Analyzer (EPMA) CAMECA SXFive equipment was used to conduct the chemical dating. The BSE image marks the boundary of a homogeneous compositional region, as seen in the monazite grains (Fig. 9).
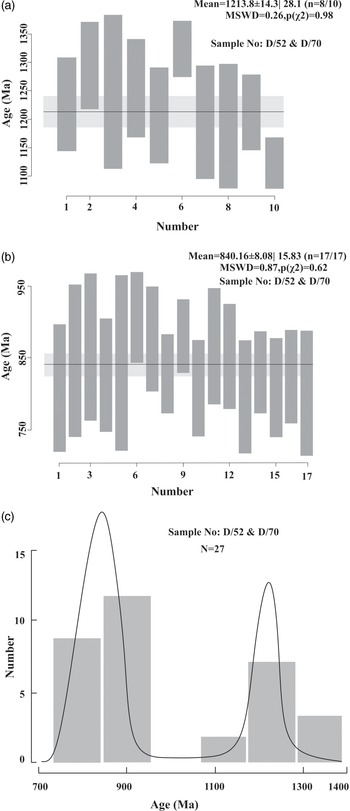
In this work, EPMA monazite geochronology was used to quantify the age of the pelitic granulite of SDT (ADMB) and to track the evolutionary history of the pelitic granulite. The mineral monazite is often found as an inclusion in garnet and other crystalline materials. We evaluate monazite growth events recorded at in the Diwani hill of ADMB and compare the ages and uncertainty of individual grains of monazite. Total 27 EPMA points have been analysed using two samples (D/52 and D/57) in several monazite grains (Table 6). The determined ages of monazites span the intervals of 1188 ± 56 to 1324 ± 25 Ma and 796 ± 40 to 906 ± 32 Ma, and Fig. 10 displays the weighted average age distribution and probability density plot. Figure 10a suggests a population age of 1213.8 ± 14.3 Ma, with a mean standard deviation of 0.26 Ma for detritus formed from a magmatic/sedimentary source for pelitic granulite, while Fig. 10b shows an age of 840.16 ± 8.08 Ma, with a mean standard deviation of 0.87 Ma for metamorphic thermal overprint. A density diagram of probabilities reveals two peaks (Fig. 10c).
Analytical results from monazites of granulite using the EPMA U–Th–total Pb method

Displays the results of the ISOPLOT programme (Ludwig, Reference Ludwig2011). (a) Weighted average older age distribution, (b) weighted average younger age distribution and (c) probability density plot.

7. Geodynamic evolution
The complete sequence of granulites development in this area, including the evolutionary tectonic history of ADMB, may be better revealed when these findings are paired with geochronological data. For this purpose, we have compared our present findings with some recent geochronological histories provided by previous workers (Bhowmik et al.. Reference Bhowmik, Bernhardt and Dasgupta2010; Singh et al. Reference Singh, De Waele, Karmakar, Sarkar and Biswal2010, Reference Singh, Shukla, Umasankar, Biswal and Biswal2020; Tiwari & Biswal, Reference Tiwari and Biswal2019; Prakash et al. Reference Prakash, Kumar, Rai, Singh, Singh, Yadav, Jaiswal, Srivastava, Yadav, Bhattacharjee and Singh2021; Biswal et al. Reference Biswal, Pradhan, Sharma, Tiwari, Beniest, Behera, Singh, Saraswati, Bharadwaj, Umasankar, Singh, Sarkar, Mahadani and Saha2022; Kumar et al. Reference Kumar, Prakash, Singh, Yadav, Tewari, Singh and Mahanta2022; Tiwari et al. Reference Tiwari, Beniest, Rai, Chatterjee, Daphale, Biswal, Yadav and Kundu2022). We have inferred, on the basis of our findings and geochronological interpretations that the collisional orogeny took place in the ADMB during the Grenvillian epoch (≈ca. 1090–980 Ma). In addition to this, discussion is held over the scale of the propagation of the Grenvillian orogenic front inside the Aravalli-Delhi orogen as well as its significance for the reconstruction of Rodinia supercontinent. According to Singh et al. (Reference Singh, De Waele, Karmakar, Sarkar and Biswal2010) explanation, the granulites are thought to have exposed through the action of thrusting along a number of ductile shear zones during the transition from syn- to post-F2 folding (Bhowmik et al. Reference Bhowmik, Bernhardt and Dasgupta2010; Singh et al. Reference Singh, De Waele, Karmakar, Sarkar and Biswal2010, Reference Singh, Shukla, Umasankar, Biswal and Biswal2020; Tiwari & Biswal, Reference Tiwari and Biswal2019; Biswal et al. Reference Biswal, Pradhan, Sharma, Tiwari, Beniest, Behera, Singh, Saraswati, Bharadwaj, Umasankar, Singh, Sarkar, Mahadani and Saha2022; Tiwari et al. Reference Tiwari, Beniest, Rai, Chatterjee, Daphale, Biswal, Yadav and Kundu2022). The SHRIMP U-Pb chronology of zircons from pelitic granulite, according to Prakash et al. (Reference Prakash, Kumar, Rai, Singh, Singh, Yadav, Jaiswal, Srivastava, Yadav, Bhattacharjee and Singh2021), yields the ages between 780 Ma and 680 Ma as a period of metamorphic overprint, and the ages between 1591 Ma and 1216 Ma match well with detritus formed from a magmatic/sedimentary source for pelitic granulite.
Based on previous work, it may be deduced that the depositional basin corresponds to passive continental margin (Biswal et al. Reference Biswal, Gyani, Parthasarathy and Pant1998). This suggests that the Archaean BGC craton might have been rifted during the Proterozoic time, resulting in the formation of the basin at the trailing edge of a fragmented continental block. As per existing literature, palaeo-plate tectonic processes were responsible for the evolution of the Paleoproterozoic Aravalli and Mesoproterozoic Delhi fold belts of the Northwest Indian Shield (Singh et al. Reference Singh, De Waele, Karmakar, Sarkar and Biswal2010, Reference Singh, Shukla, Umasankar, Biswal and Biswal2020; Tiwari & Biswal, Reference Tiwari and Biswal2019; Biswal et al. Reference Biswal, Pradhan, Sharma, Tiwari, Beniest, Behera, Singh, Saraswati, Bharadwaj, Umasankar, Singh, Sarkar, Mahadani and Saha2022; Tiwari et al. Reference Tiwari, Beniest, Rai, Chatterjee, Daphale, Biswal, Yadav and Kundu2022). These belts were formed as a result of an accretionary process of island arcs, which occurred during subduction and/or collision. In the case of ADMB and SDT, the collision fabric that has been preserved are the island arc signal, the crustal scale imbricated thrust fault and the dipping reflectors all point to the formation of a thick and stable crust during the Proterozoic epoch (Rao et al. Reference Rao, Prasad, Reddy and Tewari2000). The Proterozoic crustal thickness of the area corresponds well with the crustal thickness that has been measured across the entire planet (Rao et al. Reference Rao, Prasad, Reddy and Tewari2000). According to the findings of the present study, we inferred that the crust has not been appreciably changed since the Proterozoic collision, with the exception of re-equilibration occurring along the suture zones of the Aravalli and Delhi mountains. It leads us to infer that the Proterozoic crust was probably more stable having greater thickness than the Phanerozoic crust.
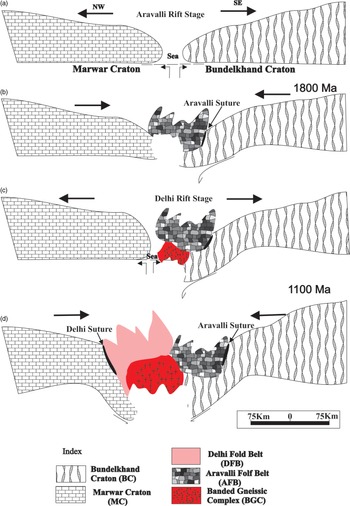
In the background of above discussion regarding mineral chemistry, petrography, geochemistry and geochronology, an attempt has been made to depict the numerous stages of evolution of the Aravalli-Delhi mobile Belts in the northwestern part of the Indian Shield (as suggested by Rao et al. Reference Rao, Prasad, Reddy and Tewari2000 and references therein) to ensure the compatibility of our findings. The geochemical analyses results suggest the existence of a proto-ocean in the region between Bundelkhand craton in the east and Marwar craton in the west (Bhowmik et al. Reference Bhowmik, Bernhardt and Dasgupta2010; Singh et al. Reference Singh, De Waele, Karmakar, Sarkar and Biswal2010, Reference Singh, Shukla, Umasankar, Biswal and Biswal2020; Tiwari & Biswal, Reference Tiwari and Biswal2019; Biswal et al. Reference Biswal, Pradhan, Sharma, Tiwari, Beniest, Behera, Singh, Saraswati, Bharadwaj, Umasankar, Singh, Sarkar, Mahadani and Saha2022; Tiwari et al. Reference Tiwari, Beniest, Rai, Chatterjee, Daphale, Biswal, Yadav and Kundu2022). Due to development of a compressional regime, the eastern craton migrated towards the west. Thus, the proto-oceanic crust together with sediments deposited on it subducted under Marwar craton. Further convergence resulted in partial melting of ancient crustal rocks. As the collision continued, a crustal scale suture developed known as Aravalli Suture (Fig. 11a, b). Such kind of suturing at the subduction zone is a common phenomenon in many ancient collision boundaries of stable Precambrian regions. A condensed crust in such kind of subduction/collision zone usually provides almost ideal pressure, temperature regime for the generation of granulites (Rao et al. Reference Rao, Prasad, Reddy and Tewari2000). According to Sinha-Roy et al. Reference Sinha-Roy, Malhotra and Guha1995, Sandmata granulites, which were thrusted up as tectonic wedges within the basement gneisses, generated under such an environment during Arawalli orogeny. In accordance with Rao et al. Reference Rao, Prasad, Reddy and Tewari2000 (and references theirin) following the evolution of the Paleoproterozoic Aravalli orogeny, during the Mesoproterozoic period, this region has undergone one more episode of rifting in the SDT. This might have resulted in the opening of an ocean between Bundelkhand-Aravalli-BGC craton and Marwar craton (Bhattacharya & Mukherjee, Reference Bhattacharya and Mukherjee1984) (Fig. 14c). The sediment deposited in this basin is regarded as Delhi sediments. This phase was followed by another compressional regime. As a result, western Marwar craton along with oceanic crust subducted eastward beneath the Bundelkhand-Aravalli-BGC craton (Fig. 11d). Due to the development of high pressure and low-temperature regime at the subduction zone, the blueschist facies metamorphism (Phulad ophiolites and related rocks) at the boundary of these colliding cratons took place. Furthermore, based on geochemical, geochronological and isotope studies, Volpe and Macdougall (Reference Volpe and Macdougall1990) have reported that Phulad ophiolites and related rocks belong to fragments of the Proterozoic island arc complex. Our interpretation of geochemical and geochronological data suggests that during the probable diapiric rise, the magmatic material might have been contaminated due to the assimilation with the country crustal rocks. Consequently, the lithology became anhydrous, and successive metamorphic processes lead to the formation of granulites which later exhumed to the surface as a tectonic response.
Cartoon depicting different stages of evolution of the Aravalli-Delhi Fold Belts (ADMB) of the northwestern Indian Shield (after Rao et al. Reference Rao, Prasad, Reddy and Tewari2000).

8. Conclusion
According to mineral and elemental geochemistry analysis, and geochronological data, the pelitic granulite of the examined area suggest arkosic to shaly nature of the protolith. The REE pattern indicates that the source of sediments has a likely composition similar to that of the upper crust. However, the Sr, Nd and Pb indicate that two source (felsic and mafic) of sediments in varying proportions. Th-Hf-Co and La-Th-Sc provide support to the assumption that the probable tectonic environment might have been passive continental margins. Monazite geochronology dictates that the metamorphic overprint took place between 797 Ma and 906 Ma, and the ages that correspond to the debris was produced from magmatic/sedimentary sources for pelitic granulites which lie between 1188 Ma and 1324 Ma. A deeper understanding of the Proterozoic era evolutionary history of the pelitic granulite that make up the SDT in the ADMB region is made possible by the current study.
Acknowledgements
This research is supported by funding from the DST-SERB, which we greatly appreciate. MK thanks UGC-CSIR for his doctoral fellowship [NTA Ref. No. 191620015480], whose doctoral thesis is in preparation under the guidance of DP. We also thank the Head of the Department of Geology, BHU for providing the necessary infrastructure facilities during the conduct of this work. We also thank Bureau Veritas Commodities Ltd, Canada and the Association of Applied Geochemists (AAG) for bulk rock analysis under the student programme. The authors thank anonymous reviewers for constructive comments that led to substantial improvement in the manuscript and deeply appreciate the editorial efficiency of Dr. Tim Johnson.