I. INTRODUCTION
Hydrogen assisted cracking attack has been one of the intriguing problems of high-strength ferritic steel equipments used in the oil and gas industry. Reference Park, Koh, Jung and Kim1–Reference Plennevaux, Kittel, Frégonèse, Normand, Ropital, Grosjean and Cassagne3 This attack is primarily associated with hydrogen uptake and transport in the steels, and a substantial body of literature has been devoted to clarify the relationship between the hydrogen diffusion behavior and cracking failure of the steels. Reference Park, Koh, Jung and Kim1,Reference Kim, Yun, Jung and Kim4,Reference Han, Jing and Xu5 It is generally known that the hydrogen uptake in the steels is initiated by the hydrogen evolution and progressed by the ad/ab-sorption reactions. In sour environment, particularly, the atomic hydrogens reduced cathodically from H+ cation dissociated from H2S gas are readily adsorbed and introduced in the steels because of the poisoning effect. Reference Park, Koh, Jung and Kim1,Reference Han, Jing and Xu5–Reference Kawashima, Hashimoto and Shimodaira9 The hydrogen introduction mechanism proposed by Kawashima et al. Reference Kawashima, Hashimoto and Shimodaira9 is as follows:
 $${\rm{Step}}\;{\rm{1}}\!\!:\;{{\rm{H}}_2}{{\rm{S}}_{{\rm{ads}}}} + {{\rm{e}}^ - } \to {{\rm{H}}_2}\mathop {{{\rm{S}}_{{\rm{ads}}}}}\nolimits^ -$$
 $${\rm{Step\ 2}}\!\!:\;{{\rm{H}}^ + } \to {\rm{\ }}\mathop {{{\rm{H}}_{{\rm{ads}}}}}\nolimits^{\rm{ + }}$$
 $${\rm{Step\ 3}}\!\!:{{\rm{H}}_2}\mathop {{{\rm{S}}_{{\rm{ads}}}}}\nolimits^ - + \mathop {{{\rm{H}}_{{\rm{ads}}}}}\nolimits^ + \to {{\rm{H}}_2}{\rm{S}}\,\sim\,{{\rm{H}}_{{\rm{ads}}}}\;({\rm{unstable}})$$
 $${\rm{Step\ 4}}\!\!:\;{{\rm{H}}_2}{\rm{S}}\,\sim\,{{\rm{H}}_{{\rm{ads}}}} \to {{\rm{H}}_2}{{\rm{S}}_{{\rm{ads}}}} + {{\rm{H}}_{{\rm{ads}}}}$$
The transport of hydrogen atom in the steel can be classified into 3 kinds of category; interstitial lattice diffusion, reversible trapping, and irreversible trapping. 10–Reference Huang, Nakajima, Nishikata and Tsuru12 As a result of complex interaction among hydrogen atom, trapping site and microstructure of matrix, the steel can be susceptible to HAC failure. For this reason, the steel industry has tried to propose and develop numerous advanced technologies for steel, plate, and pipe making such as thermal-mechanically controlled process (TMCP), Reference Park, Koh, Jung and Kim1,Reference Wang, Luu, Ho and Wu13,Reference Koh, Kim, Yang and Kim14 effective alloy design concepts, Reference Koh, Lee, Yang and Kim15–Reference Carneiro, Ratnapuli and Lins17 efficient heat treatment conditions, Reference Park, Koh, Jung and Kim1,Reference Kim, Jung and Kim18,Reference Diana, Kubla and Rohden19 and so on. They have contributed a lot to the development of sour-resistant pipe steels used as linepipe, process pipe, and pressure vessel steel. In particular, sour-resistant linepipe steels equivalent to API X60/65 grade steels, have been successfully developed. Moreover, API X70 grade steel has now been applied in the oil and gas industry. However, in recent years, more advanced steels with higher strength and heavier wall thickness have been required for the sake of more efficient transportation of oil and gas. In this regard, numerous researchers have focused their attention on the development of the API X80 and even X100 grade steels with wall thicknesses over 70 mm. Reference Diana, Kubla and Rohden19 With conventional and simple approach, however, the development cannot be easily achieved since the increase in yield strength (YS) of the steel is no longer avoid forming the low-temperature transformation microstructure such as bainite including martensite–austenite (M/A) constituents. Although it is known that the steels with microstructure of bainite or martensite are more susceptible to the HAC failure, Reference Park, Koh, Jung and Kim1,Reference Kim, Jung and Kim18 there has been limited information with systematic approach for the trapping phenomenon of hydrogen atom. To date, the relationship among the hydrogen trapping behavior, microstructure, and cracking susceptibility has not been clearly established. Therefore, in this investigation, the hydrogen diffusion and trapping behaviors of several steels with different fraction of bainite in the microstructure are studied by utilizing the electrochemical permeation technique developed by Devanathan and Stachurski. Reference Devanathan and Stachurski20 In addition, the experimental permeation data is fitted by the theoretical diffusion equation proposed by Castaño–Rivera et al. Reference Castaño–Rivera, Ramunni and Bruzzoni21 Consequently, various fitted parameters relating to the hydrogen diffusion and trapping behaviors are presented, and their physical meaning is discussed.
II. EXPERIMENTAL
A. Specimen preparation
The test materials used in this study are high-strength ferritic steels developed for sour service application. Table I lists the chemical composition of the tested steels. For the Steels A, B, and C, the specimens were manufactured by TMCP involving the controlled rolling and accelerated cooling. By modifying the alloying elements and cooling rate in rolling process, the different fraction of bainite in the microstructure of the specimens can be obtained. Measured YS of the tested Steels of A, B, and C are 501.6, 517.5, and 570.1, respectively. The thin steel membrane, with 1 mm thickness, was machined from the center area of each steel plate for the electrochemical permeation evaluation.
Chemical composition (wt%) and fraction of bainite in microstructure of three tested steels.

For microstructure observation, the specimens were firstly ground to 2000 grit paper and polished with 0.25 µm diamond suspension. Then, the specimen was degreased with ethanol and etched with 5% nital etching solution. The microstructure was observed with scanning electron microscope (SEM). The fraction of bainite in the microstructure was roughly estimated by using an image analyzer.
B. Electrochemical hydrogen permeation measurement
For the electrochemical permeation test developed by Devanathan and Stachurski, Reference Devanathan and Stachurski20 thin steel membrane was located in the center of the double cell, and the schematic illustration of the permeation cell can be found in our previous study. Reference Kim, Seo and Kim22 To ensure the volume controlled diffusion, the steel membrane with 1 mm thickness was selected. Reference Park, Koh, Jung and Kim1,Reference Kim, Seo and Kim22 Before the permeation measurement through the steel membrane, the thin palladium (Pd) coating layer with around 100 nm thickness was electrochemically deposited on the steel surface in the detection side of the permeation cell. For this process, a galvanostatic current density of 2.8 mA/cm2 was cathodically applied to the steel for 2 min. Detailed information can be referred to the previous study. Reference Kim and Kim23 After the electroplating, the permeation cell was assembled with the steel membrane deposited with the thin Pd layer. The detection cell was then filled with deaerated 0.1 M NaOH solution, and the anodic potential of 250 mVsce was applied and maintained during the permeation measurement. When the background current density reached a steady state level, H2S-saturated acidic solution defined in NACE TM0284 standard 24 was injected into the hydrogen charging side of the permeation cell. Then, the galvanostatic current density of 2 mA/cm2 was applied to the steel membrane in the charging side. Lastly, the hydrogen oxidation current density was constantly measured in the hydrogen detection side. A simple schematic of electrochemical permeation technique can be referred to ISO 17,081 standard method. 10
C. Diffusible hydrogen content measurement and sulfide stress cracking test
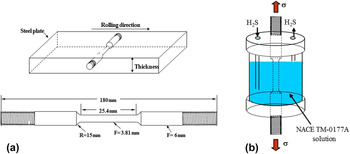
To evaluate the cracking susceptibility, both HIC and SSC tests in reference to NACE TM0284 24 and TM0177 test 25 methods, respectively, were used. The specimens were obtained from the center area of the steel plates. After HIC test, the diffusible hydrogen contents introduced in the tested steels were measured by JIS Z3113 method. 26 As for the SSC resistance, it was determined as the maximum sustaining load (threshold stress: σth) without fracture for 720 h. A schematics diagram of sub-sized specimen and configuration of test cell are illustrated in Fig. 1.
(a) Dimension of tested specimen for SSC test, and (b) schematic illustration of SSC test conducted in NACE solution. 25

III. RESULTS AND DISCUSSION
A. Microstructure analysis
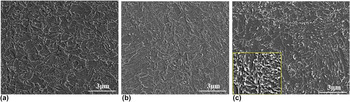
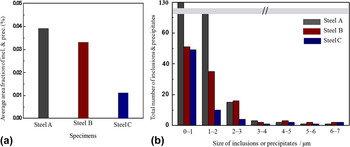
Figure 2 presents typical microstructures examined by SEM. In Steel A and B, fine-grain size of ferrite with a deformed polygonal type was clearly observed. According to several works, Reference Park, Koh, Jung and Kim1,Reference Koh, Kim, Yang and Kim14 this microstructure has been considered as the acicular ferrite. However, the microstructure of the steel plate typically produced by TMCP does not have irregular needle shape as the one observed frequently in the weld metal. To avoid any confusion and to separate microstructures between TMCP steel and weld metal, respectively, the microstructure observed in this study is defined as fine-grain size of ferrite. In fact, there is no significant difference in both microstructure and alloy composition, between Steel A and B. However, some changes in the microstructure of Steel C can be identified. It appears that small fraction of bainite structure is exhibited in Steel C. The appearance of bainite in Steel C can be closely associated with the addition of Cr and Mo which are known as one of the effective alloying elements to improve hardenability. Reference Koh, Kim, Yang and Kim14 The fraction of bainite in each microstructure of the tested steels was roughly estimated by using an image analyzer, and this information can be found in the rightmost column in Table I. Since it is known that one of the critical parameters for the initiation of hydrogen related cracks is the level of 2nd phase particle such as elongated MnS or coarse size of precipitate, the level is additionally analyzed by using the image analyzer. Figure 3 exhibits the information of 2nd phase particles contained in the tested steels. Although the difference in average area fraction of particles among three tested steels can be identified clearly, the difference is mainly attributed to considerable amount of particles smaller than 3–4 μm, which cannot contribute to the hydrogen related cracks. As there is no significant difference in the level of 2nd phase particles larger than 3–4 μm among the tested steels, level of 2nd phase particle with coarse size can be excluded from a number of metallurgical parameters for the cracking failures.
Microstructure of three tested steels.

(a) Average area fraction and (b) size distribution of inclusion and precipitate in three tested steels.

B. Electrochemical permeation and diffusible hydrogen measurements
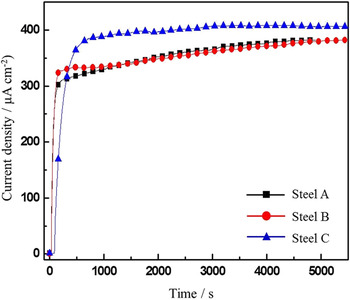
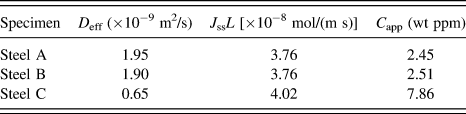
Figure 4 presents permeation transients of the three tested steels. As expected from the microstructure analysis between Steel A and B, there is no significant difference in the permeation curve between the steels. However, Steel C shows the noticeable difference in the permeation behavior. Longer break-through time (t bt) to diffuse out of the steel membrane, and higher steady-state permeation current density (i ss) are clearly exhibited in Steel C. According to our previous investigation, Reference Kim and Kim23 the behavior of longer t bt and lower i ss is more pronounced in the pressure vessel steel which is fully composed of bainite structure. Table II lists various diffusion parameters determined by Eqs. (1)–(4). The hydrogen diffusivity obtained by the time-lag method is increased in the order of Steel C, B, and A, with Steel A being the highest, and the hydrogen solubility expressed in mol/m3 is the other way around. This suggests that the increase in fraction of bainite in the microstructure can contribute to slower diffusion kinetics of hydrogen atoms. For more mechanistic analysis on the diffusion behavior, the permeation curves were fitted with modified Fick’s 2nd law of diffusion equation Reference Castaño–Rivera, Ramunni and Bruzzoni21,Reference Turnbull, Carroll and Ferriss27 and its numerical solution proposed by Castaño–Rivera et al. Reference Castaño–Rivera, Ramunni and Bruzzoni21 Basically, the modified diffusion equation considering both reversible and irreversible trapping behavior, with an assumption that the hydrogen solubility is uniform throughout the material, has been given by Turnbull et al., Reference Turnbull, Carroll and Ferriss27 and Castaño–Rivera et al. Reference Castaño–Rivera, Ramunni and Bruzzoni21 have recently proposed its numerical solution based on the finite difference method (FDM). According to their model, local equilibrium can be achieved, and there is high fraction of traps with high binding energy in the materials. The theoretical model given by Turnbull et al., Reference Turnbull, Carroll and Ferriss27 and numerical solution provided by Castaño–Rivera et al. Reference Castaño–Rivera, Ramunni and Bruzzoni21 can be described in the following Eqs. (5), and (6), respectively.
 $${{\partial C} \over {\partial t}} = {D_{\rm{L}}}{{{\partial ^2}{C_{\rm{L}}}} \over {\partial {x^2}}} - {N_{\rm{r}}}{{\partial {\theta _{\rm{r}}}} \over {\partial t}} - {N_{{\rm{irr}}}}{{\partial {\theta _{{\rm{irr}}}}} \over {\partial t}}\quad ,$$
 $${{\partial {\theta _{\rm{r}}}} \over {\partial t}} = {k_{\rm{r}}}{C_{\rm{L}}}\left( {1 - {\theta _{\rm{r}}}} \right) - p{\theta _{\rm{r}}}\quad ,$$
 $${{\partial {\theta _{{\rm{irr}}}}} \over {\partial t}} = {k_{{\rm{irr}}}}{C_{\rm{L}}}(1 - {\theta _{{\rm{irr}}}})\quad ,$$
where C L is the hydrogen concentrations in lattice, N represents the number of traps per unit volume, k and p are trapping and detrapping kinetic constant for traps, respectively. θ refer the fractional occupancy of traps. The subscripts of r and irr mean the reversible and irreversible traps, respectively.
 $${C'_j} = {C_j} \;+\; {D_{{\rm{app}}}}{{{C_{j + 1}} + {C_{j - 1}} - 2{C_j}} \over {{{\left( {\Delta x} \right)}^2}}}\Delta t - {N_{{\rm{irr}}}}{k_{{\rm{irr}}}}C\left( {1 - {\theta _{{\rm{irr}}}}} \right)\Delta t\quad ,$$
 $${\theta '_{{\rm{irr}}}} = {\theta _{{\rm{irr}}}} + {k_{{\rm{irr}}}}C\left( {1 - {\theta _{{\rm{irr}}}}} \right)\Delta t\quad ,$$
where C
j
and
 ${C'_j}$
are the number of diffusing atoms per unit volume at time, t and at time, t + Δt, respectively, θirr and
 ${\theta '_{{\rm{irr}}}}$
specify the fraction of occupied traps at time, t and at time, t + Δt, respectively, and Δt is the time interval.
Hydrogen permeation transients of three tested steels.

Hydrogen diffusion parameters of three tested steel.

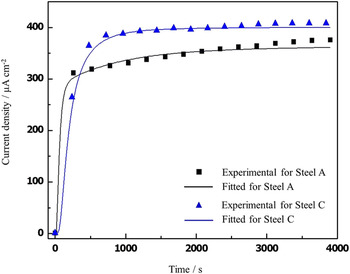
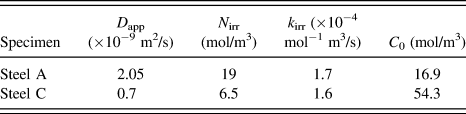
Actually, the numerical curve-fitting based on Eq. (5) was simplified with an assumption that only one type of irreversible trap site is contained in the sample. Figure 5 presents the curve-fitting with the equation described above to the experimental permeation data of Steel A and C, and some fitted parameters related with hydrogen diffusion and trapping are listed in Table III. Firstly, one of the peculiar features in Fig. 4 is that, contrary to our general expectation, the experimental transient of Steel C does not reach the steady-state even in 4000 s, and slight increase in permeation flux is continuously observed. Actually, it is generally accepted that, the absorption and desorption rates of hydrogen atoms maintain a balance at input and output side, respectively, after a certain period of charging time. However, the steady-state cannot be achieved when hydrogen atoms trapped at certain trap site with intermediate activation energy for hydrogen release are diffused slightly and continuously out of the trap site even at room temperature, and it could contribute to the slight increase in permeation flux with increasing the charging time. In this case, much longer time would be required to reach the steady-state condition. The tested steels were manufactured by accelerated cooling process, and particularly, Steel A and B have higher alloying elements of C and Mn acting as austenite stabilizer than Steel C does. Considering these facts, it may be assumed that the gradual increase in the permeation flux without reaching the steady-state even in 4000 s could be associated with slow diffusion kinetics of hydrogen atoms trapped in retained austenite (RA) islands. Since it is known that the diffusivity of hydrogen in FCC structure is much lower than that in BCC structure, Reference Murakami, Kanezaki, Mine and Matsuoka28,Reference Lovicu, Bottazzi, D’Aiuto, De Sanctis, Dimatteo, Santus and Valentini29 hydrogen atoms trapped at RA islands could be diffused so slowly out of the phase and this could prohibit the permeation flux from reaching the steady-state within a short time period. Previous article reported by Ryu et al. Reference Ryu, Chun, Lee, Bhadeshia and Suh30 has also indicated that hydrogen atom trapped at RA can be diffused out of the phase even at ambient temperature. Slow diffusion kinetics of hydrogen atoms in RA can also be referred to our previous work. Reference Kim, Yun, Suh and Kim31 Actually, since this logic is based partly on our speculation, further in-depth study would be required for clearer understanding on the phenomenon.
The curve-fitting to experimental permeation data of Steel A and C.

Hydrogen diffusion parameters determined by curve-fitting to the experimental permeation data.

It is also found from Table III that the irreversible trap density (N irr) of Steel A is higher than that of Steel C, which could be ascribed to the difference in density of 2nd phase particles between the two tested steels. Considering the fact that 2nd phase particles of oxide inclusion or precipitate can act as irreversible traps for hydrogen atoms, Reference Lee and Lee32,Reference Lee and Lee33 it could be expected that Steel A exhibiting higher fraction of inclusion/precipitate has larger N irr. It is generally considered that higher density of 2nd phase particles with coarse size is deleterious to hydrogen degradation by acting as a nucleation site for HIC or SSC. Most particles identified in Steel A, however, have fine size and they are rather beneficial for the degradation phenomenon. There is no discernible difference in trapping kinetic constant for irreversible traps (k irr) between two tested steels. From previous investigation, Reference Kim, Yun, Jung and Kim34 the value of k irr is greatly dependent upon the applied stress condition. Since the permeation test in the present study was conducted under no applied load, a significant local stress concentration could not be practically expected. Sub-surface hydrogen concentration (C 0) of Steel C is much higher than that of Steel A, and the value of apparent hydrogen diffusivity (D app) is the other way around. These suggest that Steel C has higher concentration of diffusible hydrogen, leading to much slower diffusion kinetics of hydrogen atoms. This could be attributed to higher fraction of reversible trap site in Steel C such as dislocation or bainite lath boundary. Considering these facts, it seems that the effect of matrix microstructure on the value of N irr could be disregarded, and the controlling factor for the value is the density of 2nd phase particle. Rather, the matrix microstructure contributes to the values of C 0 and D app which could be a direct index for the susceptibility to hydrogen degradation.
C. Hydrogen induced cracking and sulfide stress cracking test
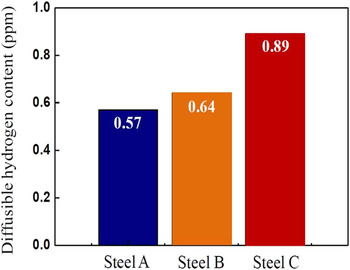
Figure 6 presents the diffusible hydrogen content introduced in the steels during the HIC test in reference to NACE TM 0284. 24 Although there is no big difference in the content between Steel A and B, Steel C has much higher diffusible hydrogen content. These values are in good agreement with the values of C app and C 0 obtained from the permeation test and curve-fitting to the permeation test, respectively. The values of crack length ratio (CLR) measured by the ultrasonic detection after the HIC test of Steel A, B, and C are 0, 2.5, and 9.6, respectively. This indicates that the susceptibility to HIC of the steels is directly associated with the diffusible hydrogen content or sub-surface hydrogen concentration.
Diffusible hydrogen contents of three tested steels measured by glycerin method. 26

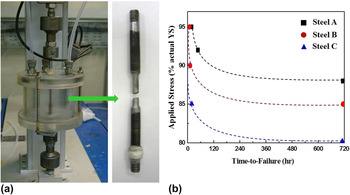
Figure 7 exhibits the resistance to SSC of the three tested steels. Firstly, as appears from Fig. 7(a), the necking phenomenon observed frequently from typical tensile test of ferritic carbon steel cannot be identified from the specimen fractured by SSC, suggesting that the failure mode can be classified as the brittle fracture induced by hydrogen diffusion in the steels. As for the SSC resistance among the tested steels, it is evident that Steel C is the most susceptible to SSC, which is a similar trend to the HIC resistance expressed by the CLR value. In addition, SSC susceptibility could also be associated with the fitted data of C 0 and D app which are described above, with an assumption that the density of coarse-sized-2nd phase particles with over critical size between the tested steels is the same.
(a) SSC test cell equipped with constant load testing device and tested specimen fractured by SSC, and (b) SSC resistance of the tested steels.

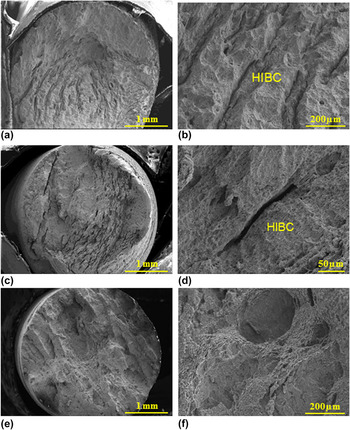
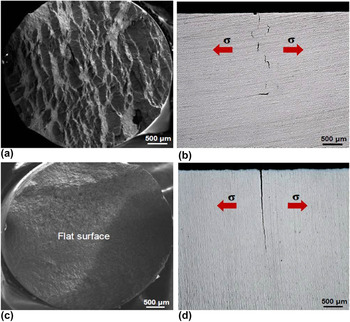
Additionally, to confirm the failure mode for SSC, the fracture surface was observed, and this is presented in Fig. 8. It appears that two types of fracture surface were observed; Type I SSC (stress-oriented SSC: SOHIC) and Type II SSC. The main difference in fracture surface between Type I and II SSC is the presence of primary cracks (Hydrogen Induced Blister Cracks, HIBC) which were developed parallel to the rolling direction (applied loading direction). The presence of HIBC in the fracture surface of tested specimen has signified that the specimen was fractured by Type I SSC, whereas the presence of only cracks perpendicular to the loading axis in the fracture surface without HIBC means that steel was fractured by Type II SSC. It is clear that Steel A and B belong to the former one, but there would be controversy as to whether Steel C is fractured by the former one or the latter one. Actually, HIBC is not at all observed in Steel C. For reference, the fracture surface of the steel with much higher fraction of bainite in the microstructure, which has been reported in the previous study, Reference Kim, Jung and Kim18 is provided in Fig. 9. This figure indicates that the fracture surface of pressure vessel steel manufactured by normalizing with oil cooling exhibits a mixture of Type I and II SSC failure mode, and the quenched steel shows a typical Type II SSC failure mode. According to NACE committee, they specify that the criterion for classifying the failure mode of the steel is Vicker’s hardness of 248. However, as indicated in the previous investigation, Reference Kim, Jung and Kim18 it would be difficult for the criterion to be directly applied to the steels with heterogeneous microstructure composed of soft ferrite coexisted with some hard phases like the case of Steel C. Although it seems that Steel C with some bainite phases could be fractured by Type II SSC failure mode, there are still uncertainties in this. Further study would be required for clearer understanding on the phenomenon.
Fracture surfaces of (a) Steel A, (c) Steel B and (e) Steel C after SSC test; (b), (d), and (f) magnified view of (a), (c) and (e), respectively.

(a) and (c) Fracture surfaces, and (b) and (d) crack propagation behaviors of oil cooled [(a) and (b)] and water quenched [(c) and (d)] specimens. Reference Kim, Jung and Kim18

IV. CONCLUSIONS
The hydrogen diffusion and trapping behaviors of three steels with different fraction of bainite in the microstructure are studied by utilizing the electrochemical permeation technique. In particular, the experimental permeation data is fitted by the theoretical diffusion equation. Based on this, the relationship between the fitted parameters and susceptibility to HAC are discussed. Major findings are as follows:
-
(1) There is no big difference in hydrogen diffusion parameters between Steel A and Steel B. However, significant decrease in apparent diffusivity, and increase in permeability and apparent solubility are obtained in Steel C. This is closely associated with the fraction of bainite in Steel C.
-
(2) From the fitted parameters obtained by the curve-fitting to the experimental permeation data, it reveals that sub-surface hydrogen concentration of Steel C is much higher than that of Steel A, and the value of apparent hydrogen diffusivity is the other way around. These suggest that Steel C has higher concentration of diffusible hydrogen, leading to much slower diffusion kinetics of hydrogen atoms. This could be attributed to higher fraction of reversible trap site in Steel C such as dislocation or bainite lath boundary.
-
(3) The fitted values related with hydrogen diffusion and trapping behavior are in good agreement with the crack length ratio and threshold stress obtained by HIC and SSC, respectively. It indicates that Steel C with higher fraction of bainite in the microstructure is the most susceptible to the cracking failures. Although it is also suspected that Steel C could be fractured by Type II SSC failure mode without the formation of hydrogen induced blister crack in the fracture surface, further in-depth study would be required for clearer understanding on this phenomenon.
ACKNOWLEDGMENTS
This paper was supported by Sunchon National University Research Fund in 2016.