Between the December 7, 1941 attack on Pearl Harbor and May 1942 the Japanese military occupied Southeast Asia's six main countries: Burma, Thailand (Siam), Malaya (including Singapore), Indonesia, Indochina, and the Philippines. The occupied territories of Southeast Asia covered 1.7 million square miles and had a population of some 140 million, almost double that of Japan. While they offered food, raw materials, and above all petroleum, Japan lacked the means to pay for these goods, essential to its war economy. Moreover, occupying Japanese forces were required to be locally self-sufficient. Southeast Asians had to support Japan's military.
Japanese policy for Southeast Asia was clear well before occupation. As Finance Minister Kaya Okinori explained in November 1941, “[Japan must] adopt a policy of self-sufficiency in the South, keep the shipment of materials from Japan to that area to the minimum amount necessary to maintain order and to utilize labor forces there, ignore for the time being the decline in the value of currency and the economic dislocations that will ensue from this, and in this way push forward.”Footnote 1
This article identifies wartime, “market-purchased,” resource transfers from Southeast Asia to the Japanese. We leave aside labor extraction and resources that the Japanese directly confiscated. Second, the article analyzes how occupation costs, military scrip (unbacked military notes), and bilateral clearing arrangements were used to finance the extraction. While Nazi Germany relied on similar techniques, money creation was substantially more important in occupied Southeast Asia than in Europe. Third, we attempt to quantify the monetary and inflationary consequences of Japanese financial policies for Southeast Asia.
No previous work has tried to measure wartime financial exploitation in Southeast Asia. Even for Europe during World War II, transfers to Germany are only now becoming a research area.Footnote 2 A path-breaking article by Filippo Occhino, Kim Oosterlinck, and Eugene White (Reference Occhino, Oosterlinck and White2008, p. 7) shows that in 1943 French transfers to Nazi Germany reached a staggering 55.5 percent of GDP. Southeast Asia did not transfer as much because its nonindustrial, low-income economies offered less scope for extraction than an advanced economy like France's. Moreover, the Japanese could use only a small share of many of Southeast Asia's prewar export commodities; and they lacked the merchant shipping to bring products home. Nevertheless, throughout Southeast Asia exploitation was substantial and, measured by prewar exchange rates, for Indochina reached over a third of GDP.
Even though the transfer of goods to Japan was chiefly financed by printing money, Southeast Asian inflation was limited because of Japanese legal restrictions on currency and the usefulness of money as a medium of exchange. Legal restrictions were the essence of J. M. Keynes' (Reference Keynes1972) plan for how Britain should pay for World War II. Unlike Keynes' forced saving program, however, Japanese restrictions to ensure the use of government-issued money in Southeast Asia echoed the coercive powers used during the Terror in revolutionary France to boost demand for the assignat. Thomas Sargent and François Velde show how the “guillotine-backed” assignat financed France's war with the German Empire and Austria that began in April 1792 (Sargent and Velde Reference Sargent and Velde1995, pp. 503–07). Legal restrictions backed by strict enforcement were not, however, the whole Southeast Asian story. In the great rice-producing areas of Thailand, Indochina, and Burma, the continued willingness of peasant rice growers to hold Japanese notes as a store of value helped to keep inflation multiples close to those of money supply increase. In Southeast Asia, a combination of legal restrictions and peasant money demand meant that hyperinflation appeared only late in the war.
OCCUPATION PATTERNS, BANKING, EXCHANGE RATES, AND SCRIP
The Japanese adopted two approaches to Southeast Asia's administration. In Thailand and Indochina, occupation was mediated through prewar structures: a Thai-run government and the French colonial administration of Indochina. These authorities were left to determine how to pay for resource transfers specified by Japan. By contrast, Malaya, Burma, Indonesia, and the Philippines fell under direct military administration.
Among Japan's first occupation acts was to revalue the yen and set a unit of each of Southeast Asia's currencies equal to one yen. Compared to 1937 exchange rates, the yen gained 35 percent to 101 percent. Although this made goods in Southeast Asia cheap for Japan, the amount of overvaluation, if not overvaluation itself, was partly by chance, since a Japanese aim was to emphasize monetary union and an appearance of equality in East Asia by decreeing that all currencies exchanged at unity with the yen. Exchange rates were, in any event, secondary for Japan, since it intended to supply few goods to Southeast Asia.
In occupied Western Europe, Germany's control of the banks and local stock markets afforded useful tools for financial repression (Oosterlinck Reference Oosterlinck2010, Reference Oosterlinck, Bucheim and Boldorf2012). Japan, however, lacked these options in Southeast Asia. The region's stock markets, where they existed, were too small to matter.Footnote 3 European banks were closed by the Japanese but, in any case, offered limited scope for financial repression because they were nearly all “exchange banks” whose chief function was to finance foreign trade. These banks held few deposits, made few loans, and served almost exclusively European customers (now either outside Southeast Asia or interned). Although the Japanese allowed local Asian banks to reopen, these were also of little use. Asian banks were tiny compared to the European banks and served a restricted, ethnically specific, clientele. European bank closures suited Japanese propaganda as a clear symbol of the New Order in Asia and Asia for Asians. But the practical consideration of a weak Southeast Asian financial structure probably drove the decision to hand over banking in Southeast Asia to the Yokohama Specie Bank and Bank of Taiwan (Unsigned 1942, p. 561; U.S., Office of Strategic Services, 20 Sept. 1944, pp. 227–28, 8 June 1944, p. 28, Dec. 1943, pp. 30–31).
Prewar authorities in Thailand and Indochina continued to issue money. For the rest of Southeast Asia, Japan printed military scrip (Shibata 1999 p. 532; Shimazaki Reference Shimazaki1989, pp. 364–94; Longmuir Reference Longmuir2002, p. 32). Scrip, literally campaign money given to Japan's invading forces and throughout the war poorly printed, was legal tender only in the country where it was issued. That restriction forestalled a potential problem of currency transfers between countries, a practice which, during the war, led to the demonetization of Germany's RKK (Reichskreditkassenscheine) wartime scrip.
In military-administered Southeast Asia, the Yokohama Specie Bank, and in the Philippines the Bank of Taiwan, soon took over the issue of scrip from the military. A specialist bank, the Southern Regions Development Bank, was set up to finance long-term resource development in Southeast Asia. However, such activities never took off and the Bank became responsible for issuing scrip in Burma, Malaya, Indonesia, and the Philippines.
The Southern Regions Development Bank started issuing scrip in April 1942, although in some areas not until 1943. Notes remained identical to those used by the military and the Yokohama Specie Bank and were still printed in Tokyo (Shibata 1996, p. 712). Like the Yokohama Specie Bank, the Southern Regions Development Bank was simply a conduit for passing scrip to the military who put it into circulation (Swan Reference Swan1989, pp. 320–21; Cohen Reference Cohen1949, pp. 95–96; Ránki Reference Ránki1993, p. 303; U.S., Office of Strategic Services, Oct. 1945, pp. A41–A42; Sept. 1944, p. 238).
Over the first year or so of the war in the military-occupied countries, prewar colonial currencies and some foreign currencies circulated alongside Japanese military scrip (U.S., Office of Strategic Services, Sept. Reference Bloc and Hoselitz1944, pp. 215–16, 237; Cribb Reference Cribb1981, p. 114; Longmuir Reference Longmuir2002, p. 125; Romualdez Reference Romualdez1962, p. 460). Subsequently, however, all other monies disappeared from open circulation through a combination of the operation of Gresham's Law that bad money drives out good and, as later discussed, because of strong Japanese coercion beginning around late 1942.
PAYMENTS AND TRANSFER OF GOODS TO JAPAN
The Japanese transferred resources to themselves in Malaya, Indonesia, the Philippines, and Burma simply by printing the required amount of currency (scrip). Acquiring currency to spend in Thailand and Indochina was slightly more complicated. However, the Japanese appear to have been able to dictate currency requirements in these countries as well. This section tabulates large Southeast Asian payments to the Japanese and the need to finance these by money creation.
Occupation Costs, Bilateral Clearing Arrangements, and Yen Credits
Japan used baht in Thailand and piastres in Indochina to buy goods it exported and to meet local military and administrative (occupation) costs. Japanese currency requirements were, in theory, negotiated and the Thai and Indochinese governments, even if under Japanese control, may have limited stated demands. However, once the Japanese had specified their currency demands the local authorities met them.Footnote 4 The mechanics of supply were, first, the Yokohama Specie Bank credited at the Bank of Japan in Tokyo the accounts of the Bank of Siam (established in December 1942) or Banque de l'Indochine with the yen equivalent of baht or piastres to be given to Japan. These Southeast Asian “central banks” then credited the Yokohama Specie Bank in Bangkok or Saigon with local currency for military use.Footnote 5 Yen credited to Thailand and Indochina were “special.” They could not be spent in Japan or used to purchase imports from Japan. Thailand did, however, negotiate an agreement for some 10 percent of its yen credits to be converted into gold held in Tokyo.
Although occupation costs typically exceeded actual military and administrative costs, bilateral clearing agreements negotiated with Thailand and Indochina were potentially an even more powerful means of extraction. They gave Japan purchasing power in these two countries that was limited only by three factors: the physical capacity to provide goods and services for Japan; how much of these goods Japan could use; and the availability of shipping to carry goods (Wiwat Reference Wiwat1961, pp. 399–402; U.S., Office of Strategic Services, July 1947, p. 6). As such, bilateral agreements suited not just wartime finance but Japan's long-term goals of integrating Southeast Asia into the yen bloc and creating an empire in East Asia.
Payments to Japan
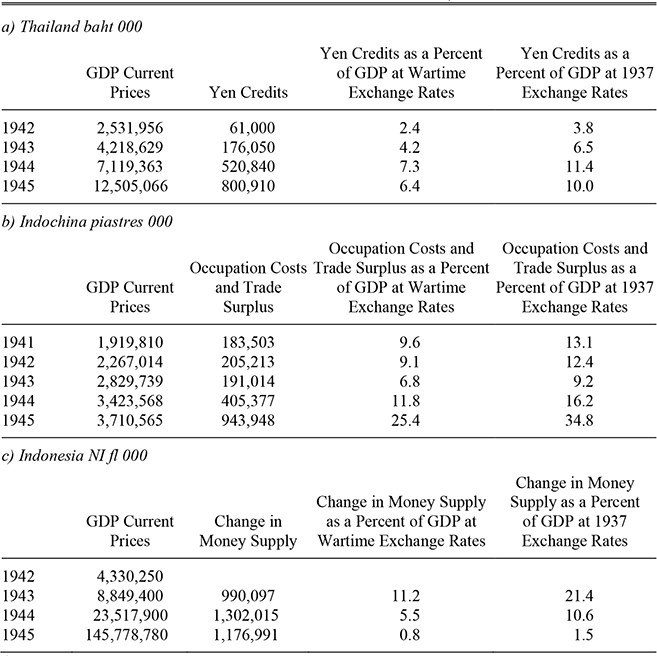
Thailand, Indochina, and Indonesia provided the most resources and we can use wartime national income estimates to evaluate transfers to Japan as a share of GDP (Table 1). For all three countries, exploitation was substantial at arbitrary, wartime exchange rates, and even larger at prewar (market) exchange rates. Between 1942 and 1945 Thailand's payments averaged 6 percent of GDP at wartime rates and a little over 9 percent at 1937 rates. Payments made by Indochina at Japanese wartime rates rose from 9.1 percent of GDP in 1942 to 25.4 percent by 1945. At 1937 market exchange rates, 1945 payments were over a third of GDP. Indochina made such large payments, probably the biggest in Southeast Asia, because it was Japan's chief military and logistical base in Southeast Asia; because it was the second most important source (just behind Korea) of rice imports; and because the pro-Vichy colonial government was in no position to resist demands from Tokyo (Robequain Reference Robequain1944, pp. 367–73).Footnote 6
After reaching 11.2 percent of GDP in 1943, or nearly twice that at prewar rates, payments from Indonesia fell sharply. Japan's chief demand on Indonesia was for petroleum, but by 1944 systematic American submarine and air attacks had decimated the Japanese tanker fleet. Japan began the war with 575,000 tons of tanker capacity, and although in December 1943 this peaked at 834,000 tons, by the time of surrender capacity was just 247,850 tons (U.S., United States Strategic Bombing Survey 1946c, p. 91). Japanese merchant shipping as a whole was similarly affected. During 1944 it fell to 40 percent, and in 1945 to under a quarter, of its 1941 tonnage. By the end of 1944, Japan was cut off from Southeast Asia and so Indonesian oil fields no longer had much value (Fuel Forum 1972, p. 664; U.S., United States Strategic Bombing Survey 1946a, pp. 41–44).
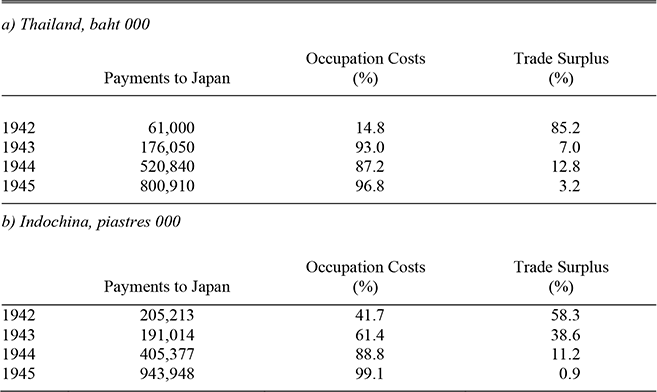
During the war, the composition of Thai and Indochinese payments to Japan changed radically. Indeed, at the same time as Japan lost control of Pacific shipping lanes, it had to increase military expenditure in Southeast Asia to deal with probable Allied invasion. Initially, the chief component of payments was exports (mainly rice) to Japan (see Table 2). By the last two years of the war, however, occupation costs comprised over 90 percent of payments as Japan's focus shifted to defending Southeast Asia.
Nonmarket extraction cannot be reliably quantified, but it was large enough that payments shown in Table 1 are certainly a lower bound of total transfers. Plunder included, for example, four months' supply of crude oil from Indonesia and about 150,000 tons of rubber from Malaya (Milward Reference Milward1977, p. 165). Looting was significant in regard to all types of transport. Quantities of railway rolling stock and rails were taken from around Southeast Asia, especially from Malaya, to build the Siam-Burma Railway.
A high proportion of Southeast Asians did at least some “voluntary” work towards the Japanese war effort and large numbers were co-opted as forced labor. The best-known instance involved most of the 166,000 Asians who worked on the Siam-Burma Railway. Its construction cost approximately 66,000 Asian and 15,000 European POW lives, over 300 persons per mile of track laid. Payment at less than market wages of a proportion of those working for the Japanese, including most of Indonesia's 2.6 million romusha (unskilled laborers), should be counted as a tax. So should forced deliveries of food, mainly rice in Indonesia and Indochina, at below market prices. Overall, probably at least 5 million Southeast Asian civilians died prematurely as a result of the Japanese occupation.
Why Weren't Payments from Southeast Asia Larger?
Although the payments in Table 1 constitute a lower bound for total resource transfers to Japan, these seem unlikely anywhere in Southeast Asia to have approached the 1943 high point of the over 50 percent of GDP that Nazi Germany extracted from France. Even in Indochina, Japan was unable to achieve exploitation on such a scale.Footnote 7 There were four main reasons for the comparatively smaller payments from Southeast Asia to Japan than France to Germany, none of them financial. One was that in Southeast Asia, a low standard of living limited available surpluses that could be appropriated. Second, Southeast Asia was a collection of highly specialized monoeconomies. Prewar Southeast Asia exported just four main commodities, rice, rubber, tin, and sugar, to the global (chiefly Western) market. These commodities were produced in far greater quantities than a relatively small economy like Japan's could use. Third, as discussed above, by 1944 Japan found it difficult to get home those commodities it wanted because of severe shortages of merchant shipping. Fourth, Japan's rapid initial conquests boxed it into diverting resources to try to maintain a vast Pacific defensive perimeter. Until September 1943 this included not only Burma (which supplied almost no goods to Japan and eventually cost over 185,000 Japanese lives) but stretched to western New Guinea in the south, encompassed the Gilbert Islands in the west, and extended northwards to the Aleutian Islands.
Financing Payments
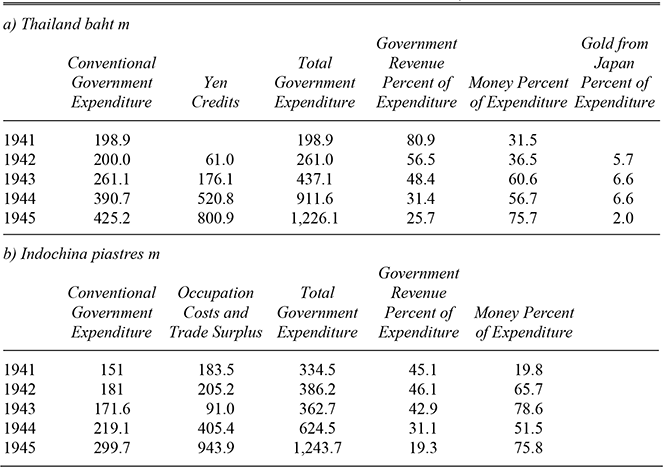
War can be financed by bonds, through taxation, and by printing money. In Southeast Asia, the Japanese relied heavily on money creation (see Table 3). During the war in both Thailand and Indochina, government revenue growth lagged well behind inflation. Conventional government expenditure alone gave rise to modest budget deficits which combined with occupation costs and trade surpluses with Japan to create large deficits. Currency issues, measured in Table 3 by the annual change in money supply, largely filled the gap. From 1943 money financed half to three-quarters of total government spending in each country.
For the Japanese war effort, bond sales and conventional taxation were poor alternatives to money creation. Neither the Thai and Indochinese governments nor Japanese military administrations could borrow abroad. Although in Japan, war finance depended on financial institutions' purchases of government bonds, nowhere in occupied Asia was their sale attempted on any scale (Cohen Reference Cohen1949, pp. 88–90; U.S., Office of Strategic Services, 1 Oct. 1945, p. A42; U.S., United States Strategic Bombing Survey, 1946a, p. 91). Given the elimination of most of the prewar banks in Southeast Asia, this is hardly a surprise. The Japanese did, however, try to use savings campaigns to raise resources. The Asian news media and Allied intelligence describe numerous schemes, for example in March 1944 a “gigantic savings campaign” in Malaya (U.S., Office of Strategic Services, 20 Sept, Reference Bloc and Hoselitz1944, p. 211). The collapse in exports and per capita income essentially destroyed prewar tax structures, even though government and Japanese administrators made considerable efforts to replace them.Footnote 8 New taxes included “voluntary” gifts from Chinese businessmen, lotteries, and taxes on gambling, amusement parks, cockpits, bicycles, hand carts, dance hostesses (taxi dancers), female visitors to dance halls, restaurants, and coffee shops, the last four all associated with the great wartime upsurge in prostitution.
THAILAND AND INDOCHINA METHODS OF FINANCING GOVERNMENT EXPENDITURE AND PAYMENTS TO JAPAN, 1941–1945

Notes:
Money is the change in money supply from official statistics. This change as a percentage of total government expenditure and government revenue as a percentage of total government expenditure does not add to 100 percent in any one calendar year. However, for both Thailand and Indochina over the five years 1941–1945, the totals for government expenditure plus money add to close to 500 percent. There were also small sales of bonds in the two countries but data for these sales are not available.
Source:
See the Appendix.
Southeast Asian governments set up by the Japanese in Burma and the Philippines, and the French colonial administration looked to bond sales to soak up excess purchasing power and restrict inflation. Bond finance had some success in the Philippines, where the prewar state-owned Philippine National Bank was not liquidated and was made to purchase most of the bonds issued by the nominally independent Laurel government (Romualdez Reference Romualdez1962, p. 459; U.S., Office of Strategic Services, 20 Sept. Reference Bloc and Hoselitz1944, pp. 245–46). However, with this exception, none of the wartime Southeast Asian saving, taxation, or bond schemes went far towards reducing the need to finance through money.
A MODEL OF SEIGNIORAGE AND INFLATION
To explore the implications of Japan's wartime reliance on seigniorage revenue in Southeast Asia, we adapt a framework of Michael Bruno (Reference Bruno1991) and Bruno and Stanley Fischer (Reference Bruno, Fischer and Ben-Porath1986). Seigniorage requirements depended largely on the course of the war. They increased sharply because Japan's conquests in Southeast Asia soon faced the threat of Allied invasion. As a result, defense spending had to be stepped up. GDP fell because Southeast Asia was cut off from its export markets. Suppose the demand to hold money balances increases with income and declines with expected inflation. Under the restricted banking regime of wartime Southeast Asia, the aggregate money stock, M, is equivalent to the nominal money base, H. Thus the real money stock is represented by h = H/P, where P is the price level. A modified quantity theory demand for money function is

where k includes both the transactions and store of value motives for holding money; y is real national income; π is expected inflation; and b measures the effect of inflation on the willingness to hold money as seen in Figure 1. Seigniorage, d, in any period is the increase in real money balances (Ht – Ht -1)/Pt required to pay for the resources extracted. In a steady state, the rate of increase of the money supply (Ht – Ht -1)/Ht equals the rate of inflation, π.

SEIGNIORAGE, INFLATION, AND THE DEMAND FOR MONEY
In Figure 1, any given level of seigniorage can be represented by a constant multiple of the vertical times the horizontal: d′ represents a higher level of seigniorage than d. Points A and B in Figure 1 are both steady state combinations of seigniorage and inflation. Whether or not they represent stable equilibria depends on how inflation expectations are formed (Bruno and Fischer, 1990). What matters, then, is, first, the response of inflation to changes in the seigniorage Japan needed from the occupied countries and, second, shifts in Southeast Asian demand for money in response to wartime events. At point A, an increase in the seigniorage required by Japan (a shift from d to d′ in Figure 1) increases the level of inflation to point A′. The higher rate of money creation gives rise to excess real balances at the starting level of inflation, leading to an increased demand for goods and services and more rapidly rising prices as people seek to adjust their real balances. A downwards shift in the demand for money (and new equilibria at C′ and D′), due, for instance, to a loss of confidence caused by Japanese war reversals would produce a similar effect.
At a point like B, Figure 1 suggests—counterintuitively—that an increase in seigniorage would reduce the steady state inflation, as shown by point B′ on the d′ curve. However, so long as expectations of inflation moved in the same direction as actual inflation, both B and B′ are unstable equilibria and Japan's increased demand for resources would set off accelerating inflation, because the excess real balances would drive prices up faster, leading to an ever-increasing gap between actual and desired real balances, as shown above point B in Figure 1.
In Figure 1, if the seigniorage curve lay wholly above the h line there would be no equilibrium—the level of resources required could never be extracted through money creation alone. Even if such a dire situation was avoided, there was an obvious danger, as financing war required greater seigniorage, of moving to the upper equilibrium at B′ or, after yet more demand for seigniorage, reaching A″. At these points, any further increases in inflation would lead to a hyperinflationary spiral and Japan would have either to limit newly created money or bolster the demand for money by legal restrictions or other means.
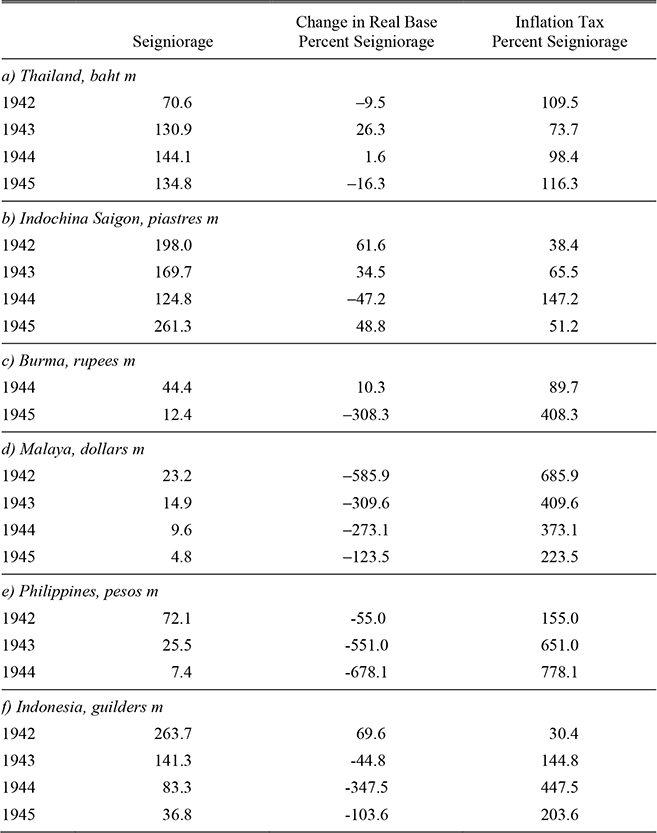
Real seigniorage is made up of two elements, the change in real money balances from one period to the next and the inflation tax, that is the amount by which the private sector must augment its nominal money holdings to maintain the same value of real balances when inflation is positive. When an economy is growing and inflation is stable, the desired real money stock will grow and the first element will be positive. However, as equation 1 shows, when inflation is rising fast enough the desired real money stock may fall. If so, the first element will be negative and the inflation tax will account for more than total real seigniorage. Significant falls in real money balances —as occurred in several Southeast Asian countries—may be associated with inflation taxes much greater than the resources extracted through seigniorage. Let us rewrite seigniorage as
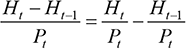
Adding and subtracting the lagged real base to and from the right-hand side of equation 3 and noting that Pt = Pt −1(1 + πt) yields
![\[
\begin{array}
\frac{{H_t \minus H_{t \minus 1}}}{{P_t}} = \left[{\frac{{H_t}}{{P_t}} \minus \frac{{H_{t \minus 1}}}{{P_t \minus 1}}} \right] + \left[{\frac{{\pi _t}}{{1 + \pi _t}}} \right]\left[{\frac{{H_{t \minus 1}}}{{P_t \minus 1}}} \right]
\end{array}
\](https://static.cambridge.org/binary/version/id/urn:cambridge.org:id:binary:20160308071059351-0569:S0022050713000843_eqn4.gif?pub-status=live)
The first term is the change in real money balances from one period to the next and the second term represents the inflation tax. We quantify both below.
SOUTHEAST ASIAN GDP AND FINANCE FOR OCCUPATION AND WAR
The standard assumption is that “wealth in real terms and real income, seem to be relatively stable during hyperinflation.” This near-stability, Phillip Cagan (Reference Cagan and Friedman1956, pp. 31–33) goes on to point out, is necessary for “changes in real cash balances in hyperinflation [to] result from variations in the expected rate of change in prices.”Footnote 9 In occupied Southeast Asia, however, incomes fell massively and probably so did money demand. A consequent leftwards shift in the money demand function in Figure 1 would point to the likelihood of hyperinflation.
Wartime Southeast Asian GDP
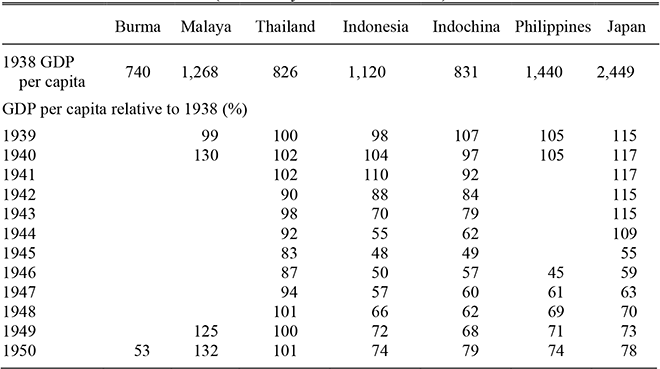
In World War II Southeast Asia, “Economic life receded from modernity”; countries retreated “toward an isolation and autarchy that harked back to precolonial times” (Bastin and Benda Reference Bastin and Benda1968, p. 127). Real per capita GDP estimates, although coarse, accord closely with this judgment. They point to one of the deepest macroeconomic crises in modern history (See Table 4 and cf. Barro and Ursúa, Reference Barro and Ursúa2008). After 1941 real per capita income in Indonesia and Indochina fell every year. By 1944 in both countries it was only somewhat over half, and in 1945 under half, of 1938 levels. Between 1938 and 1946 income in the Philippines shrank by more than half.
No GDP data exist for Malaya, but over the course of the war GDP probably fell by at least half and perhaps more. The prewar Malayan economy depended heavily on rubber and tin produced for export. Output of both commodities dropped precipitately. Rubber production was, by 1942, about a quarter of its 1937–1939 average. In 1942 tin output slumped to a third of the 1937–1939 level, recovered somewhat in but in 1944 was only 17.5 percent of late 1930s levels. The only buyer of rubber and tin was Japan. Thailand was the Southeast Asian economy least affected by war and occupation, and even in 1945 income remained at 82.6 percent of the 1938 benchmark.
SOUTHEAST ASIA AND JAPAN GDP PER CAPITA, 1938–1950 (1990 Geary-Khamis $ and index)
Source:
See the Appendix.
Japanese Needs for Finance
Soon after Japan occupied Southeast Asia, the battles of the Coral Sea in May 1942 and Midway in June 1942 put it under pressure. By mid-1943, following further losses, Japan began a strengthening of defenses that continued for the remainder of the war. In June 1944 battles in the Philippine Sea and the loss of Saipan, which breached the inner line of Japanese defenses, gave further impetus to these efforts.
The systematic destruction of Japanese shipping and military buildup in Southeast Asia increased the need for revenue, to pay for local labor and materials to establish coastal defenses, build airfields, and so forth. As early as October 1943, the construction of ports and airbases in Malaya was said to have caused the printing of far more military scrip there than in other occupied countries.Footnote 10 In Indochina, constructing and equipping airfields was the biggest item in a large budgetary increase in early 1944. Expenditure escalated during 1944 and even more in 1945.Footnote 11
A greater need for revenue implied more seigniorage. Since Southeast Asians were paid in scrip, the expansion of wage labor in conjunction with Japan's military buildup increased the demand for money to buy food and other necessities (Kratoska Reference Ikehata, Trota Jose and Kratoska2005, pp. 243–44; Sato Reference Sato1994, pp. 168, 178). Thus, at the same time as the greater Japanese need for seigniorage must have shifted rightwards the d curve in Figure 1, local demand for money helped to offset the inflationary effects of Japanese war finance.
MONEY SUPPLY AND INFLATION IN SOUTHEAST ASIA
Data Sources
Money supply data, described in the Appendix, derive from Japan's Ministry of Finance records and from Thailand's and Indochina's government accounts. These data are reliable until sometime in 1945, when Japanese record keeping deteriorated or ceased. Then Allied reconstructions of Japanese policy provide some additional information.Footnote 12 Statistics are typically monthly for the four military-administered countries and annually for Thailand and Indochina. Data for the Philippines exist through January 1945, for Indonesia until July 1945, and for Malaya and Burma until 12 and 15 August 1945 respectively. Rapid money supply expansion during the war's last two months, and especially its final two weeks in August when surrender was inevitable, makes Malayan and Burmese data not entirely comparable with that for Indonesia and the Philippines.
Money Supply and Inflation
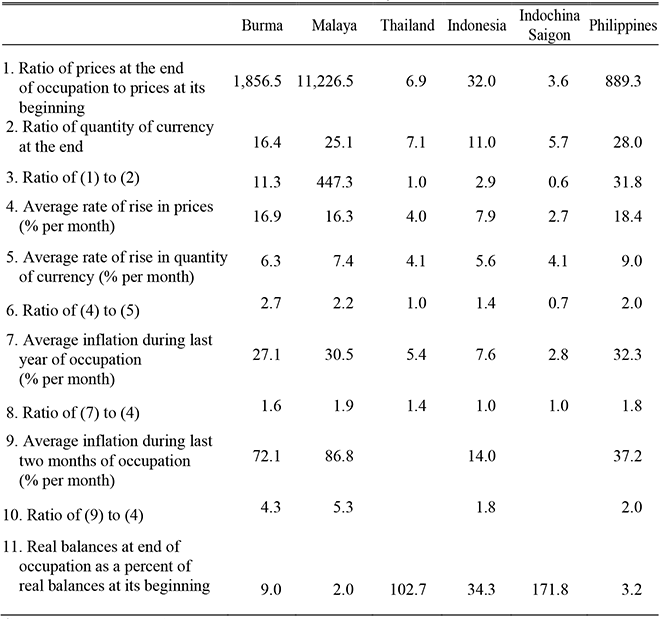
As Table 5 shows, the money creation and inflation time series are quite contrasted between Thailand and Indochina and the four military-administered Southeast Asian countries, both in the magnitude of inflation (lines 1, 4, 7, and 9) and the quantity of currency issued (lines 2 and 5). Although the Japanese instituted numerous price controls, these were ineffective.
Between 1942 and 1945 inflation and money supply relationships in Thailand and southern Indochina (Cochinchina and the lower part of Annam, together represented by Saigon) appear to satisfy even the naive quantity theory. The price level in Thailand at the end of occupation, at 7.1 times December 1941 prices, compares to a 6.9-fold increase in money. Inflation data may somewhat understate actual price rises (Ungphakorn and Suvarnsit Reference Ungphakorn and Suvarnsit1952, p. 70). However, in both countries measures to decrease money supply helped to limit inflation. In February 1945 Thailand reduced the money supply by some 30 percent after demonetizing the 1,000 baht note and exchanging it for bonds at 1 percent interest, while in March 1945 Indochina limited withdrawals from banks for individual depositors to 2,000 piastres per month.Footnote 13 A separate price index exists for Hanoi (northern Indochina) but not separate money supply figures. The Hanoi index (and other data) indicates a 15-fold increase in wartime prices.Footnote 14 Since a main focus of the present article is the holding of real balances in rice-surplus areas, and northern Indochina around Hanoi was a rice deficit area and one without its own money supply data, the remainder of the article concentrates on southern Indochina.
SOUTHEAST ASIA CHARACTERISTICS OF INFLATION AND MONEY DURING THE JAPANESE OCCUPATION, 1942–1945
Source:
See the Appendix.
Among the military-administered countries, Burma was comparable to Thailand and Indochina. Data for Burma are for Rangoon, and so, like Thailand and southern Indochina, indicative of the demand for money in a rice-surplus area. Unlike Thailand and Indochina, however, Burma was subject to instability associated with political uncertainty and some of the most intense fighting in the Southeast Asian theatre. Although a lack of data for 1942 and 1943 hampers analysis, from Japan's initial bombing of Rangoon on 22 December 1941, through the city's fall on 8 March 1942 and possibly until March 1943, prices appear to have risen much faster than money supply. However, during the next 21 months, until December 1944, when money supply increased by about a factor of 10, prices rose only slightly faster. This changed between January and August 1945, which encompassed Rangoon's fall in May: Burma's money supply less than doubled but prices rose 21.4 times so that by the war's end Burmese prices had increased by a factor of 1,856.5.
In Malaya, the Philippines, and Indonesia, price rises far outdistanced monetary expansion. Malaya appears the extreme example: by the end of the war, money supply had multiplied 25.1 times while prices were 11,000 times higher. However, the Philippines and Indonesia might well show similar money supply and price histories if data were available for the final weeks of the war when the Japanese issued particularly great quantities of currency.
The literature almost universally refers to hyperinflation in Southeast Asia. But by either the Cagan (prices rising 50 percent a month) or Reinhart-Rogoff (40 percent) criteria, hyperinflation was not typical until late in the war (Cagan Reference Cagan and Friedman1956, p. 25; Reinhart and Rogoff Reference Reinhart and Rogoff2009, p. 5).Footnote 15 Only the Philippines had a 40 percent or more monthly price rise before 1945. Even there, inflation did not reach 40 percent until August 1943. Between November 1943 and January 1945 monthly Philippine inflation exceeded 50 percent on three occasions, but then fell back to a lower level in the next month. Malaya never approached 40 percent monthly inflation until the final days of the war in August 1945. Burma became hyperinflationary only in the last two months of the war as retreating Japanese troops desperately drew on their monetary stocks to obtain food and supplies.
THAILAND END-OF-YEAR INDEX OF REAL VALUE OF CURRENCY AND RATE OF CHANGE IN PRICES, 1941–1945
REAL BALANCES
This section explores contrasting trends in real balances. In Thailand, Indochina (Figures 2 and 3), and, before 1945, in Burma, real balances, despite high inflation, were well maintained (Figure 4). By contrast, in Malaya and the Philippines real balances fell sharply over time (Figures 5 and 6). More importantly in all the countries, Japan could finance occupation by printing money because real balances held up sufficiently well that hyperinflation was largely avoided. Clearly, then, one would want to know: Why did Southeast Asians continue to hold money to the extent they did when its value was being comprehensively debauched?
INDOCHINA END-OF-YEAR INDEX OF REAL VALUE OF CURRENCY AND RATE OF CHANGE OF PRICES, 1941–1945
Malaya, the Philippines, and Indonesia
The path of real balances during high inflation or hyperinflation is complicated. Surely as prices skyrocket, people demand less money as its real value falls and the cost of holding currency rises (Figures 5 and 6). Initially, however, real balances may rise because, as Keynes observed, people are so accustomed to considering money the ultimate standard that they hoard it and postpone purchases (Keynes Reference Keynes1971, p. 40). Moreover even after real balances start to fall, the decline is often erratic and marked by reversals (Cagan Reference Cagan and Friedman1956, p. 27 and see, for example, Bernholz Reference Bernholz1996, p. 301).
In Malaya and the Philippines, there was insufficient willingness to hold scrip to support more than brief rises in real balances. Balances fell irregularly but inexorably. By August 1945 real balances in Malaya stood at 2 percent of their level at the onset of occupation, while in January 1945 the Philippine figure was 3.2 percent. In July 1945 Indonesian real balances were a third of their initial level.
BURMA END-OF-MONTH INDEX OF REAL VALUE OF CURRENCY AND RATE OF CHANGE IN PRICES, JUNE 1942–AUGUST 1945
Four principal reasons explain why scrip was held in military-administered Southeast Asia. To begin with, military decrees and coercion provided strong incentives to hold currency. After the first year of occupation Japanese administrations outlawed the use of prewar currencies. Their mere possession was deemed criminal and punishable with arrest, often torture, or even death.Footnote 16 A second reason is that good money substitutes for scrip were not available. Japan forced the Southeast Asian countries into autarky which supported its monetary monopoly by cutting off access to substitute currencies. Indeed, all that was left was the clandestine use of prewar monies and various guerrilla-issued currencies in the Philippines.
MALAYA END-OF-MONTH INDEX OF REAL VALUE OF CURRENCY AND RATE OF CHANGE IN PRICES, FEBRUARY 1942–JULY 1945
A third reason to hold scrip was its considerable transactional benefits. The Japanese instituted monopoly buying and distributing organizations, all of which dealt in scrip. With the disappearance of prewar export markets, Japanese buying organizations were the principal, or even the only, outlet for export staples like rubber and tin in Malaya and sugar and abaca in the Philippines. Malayan and Philippine staple producers could only obtain wage goods by selling their output to Japanese buyers. Local (barter) demand for the staples was slight or nonexistent since they were of little local use. In areas specialized in producing rice, its surfeit undermined barter demand. Money payments to the large numbers of laborers and other workers employed by the Japanese were all in scrip. Furthermore, nearly everyone in the military-administered countries needed scrip for the many taxes levied by the Japanese, to obtain rationed goods including food and clothing, and for any other market transaction.
PHILIPPINES END-OF-MONTH INDEX OF REAL VALUE OF CURRENCY AND RATE OF CHANGE IN PRICES, JANUARY 1942–JANUARY 1945
Fourth, although confidence in scrip fell because the Allies announced that it would become worthless after Japan surrendered, not all Southeast Asians believed this propaganda.Footnote 17 Almost certainly, a number of people continued to hold scrip in the likelihood that, even if Japan lost the war, it would still have some value. A rational basis for this belief is confirmed by actual Bank of England strategy. Elliptically set out in a telegram, it was that: we “have to redeem Japanese occupation currency most important that the impression should be created that we do not (repeat not) contemplate such redemption.”Footnote 18 In stressing that for Burma scrip must be accorded postwar value, the Bank's Governor, Sir Otto Niemeyer, found, for the commercial banks and for himself, it “inconceivable that the reoccupying Power would create a position in which the Burmese could not use the money in their pockets.”Footnote 19
As the war went on, scrip was, however, increasingly shunned as a store of value. By the war's latter stages in Malaya, “only the most stupid were lulled into a sense of wealth” by holding large quantities of Japanese notes. Others “who had amassed ‘fortunes' quickly changed the paper money into commodities, and substantial investments” (Chin Reference Chin1946, p. 45). Apparently, given the opportunity even the clerks in Japanese banks changed their pocket money into British currency.Footnote 20 Axis reversals especially eroded scrip as a store of value. In Malaya, “Every time there was an Axis defeat, particularly Japanese defeats, prices of goods jumped up. Every Allied victory … and every visit of B-29s over Malaya, caused spurts of prices in foodstuffs. Saipan, Iwojima, Manila, Rangoon, and Okinawa were inflation springboards” (Chin Reference Chin1946, p. 45). In the Philippines, prices rose each time air-raid precautions and defense drills were held in Manila (Jose Reference Jose, Ikehata and Trota Jose1999, p. 211). Insofar as money, as opposed to jewels or durable goods, remained a store of value, this largely devolved to prewar currencies exchanged among those considered trustworthy (See, for example, Akbar Reference Akbar1990, p. 134).
Thailand, Indochina, and Burma
In Thailand and Indochina, real money balances were impressively persistent (Figures 2 and 3). The same appears to be true of Burma until the country's 1945 descent into military chaos including both the period of direct military rule and that of the puppet Ba Maw government (Figure 4). Burma suggests that balances were maintained for more important reasons than the identity of scrip to prewar notes (true only of Indochina) and a continuity of governments (Indochina and Thailand). Those reasons were that peasants produced for the market and tended to hoard money. The maintenance of real balances in Thailand, Indochina, and Burma is especially striking, since models like that in Figure 1 specify a negative relationship between money demand and inflation and implicitly assume constant real income. Southeast Asian GDP decline should have reduced the demand for real balances and hastened hyperinflation's onset.
Real balances in Thailand stayed approximately constant and in Indochina appear to have risen. In Burma, after an apparently sharp fall, real balances stabilized and remained near to or above their March 1943 level until December 1944. During 1945, however, balances collapsed after the British launched two major offensives followed by the capture of Mandalay on 20 March and the fall of Rangoon on 3 May. In August 1945, real balances in Burma were 9 percent of their June 1942 level.
Thailand, Indochina, and Burma had transactional motives for holding money similar to Malaya and the Philippines. Burmese transactions were “largely (if not entirely) based on Japanese-issued rupees.”Footnote 21 These were, a wartime Burmese government official recalled, the only legal currency and an unwillingness to accept them “meant imprisonment, torture, or death” (Pe Reference Pe1961, p. 93). The Thai and Indochinese governments helped to sustain a demand for money through policies to support producers by buying their output (U.S., Office of Strategic Services, 10 July 1945, pp. 33–34, 13 March 1945, p. 26, 16 Dec. 1944, p. 7).
The unchanged physical appearance of the Indochinese piaster, and nearly identical appearance of the Thai baht, may seem to bolster a store of value motive for high real balances. But the principal explanation lies elsewhere. High real balances in Thailand, Indochina, and, for part of the war, in Burma are explained mainly by the fact that all three economies were dominated by numerous small peasant rice growers. Unlike producers in the rice deficit areas, they could easily achieve food self-sufficiency, since rice and many other basic foodstuffs could be obtained through household production or barter. Such small rural cultivators tend to hoard money, even in the face of inflation. Under inflationary conditions, Keynes (Reference Keynes1971, p. 66) observed, as “more money flows into the pockets of the peasants, it tends to stick there.” For Thailand, it was reported that only 20 percent or 25 percent of notes in circulation were in Bangkok; “The rest are in the provinces, where they largely disappear into farmers' hoards: and the demand of the provinces for fresh supplies of notes is a never ceasing one” (Thailand 1951, p. 55).Footnote 22 In Burma, villagers in rice-producing districts insisted on payment in Japanese currency: “They thought it was better than British and enjoyed the feeling of wealth which they got by carrying away large wads of brand new Jap notes.”Footnote 23 Even when brought to the cities, rural dwellers like Indochina's Cao Dài religious sect apparently had consumption patterns little affected by inflation. In Saigon, the Japanese relied heavily for their workforce on the Cao Dài who, being vegetarians “ate simple food with lots of vegetables, rice, and seeds. Any extra money they earned was channeled back to their families or to their temples” (Tràn Reference Ikehata, Trota Jose and Kratoska2005, p. 291).
Peasant money illusion may not, however, fully account for the holding of money in rice-surplus areas. Producers in these areas had limited spending opportunities because local production generally provided no more than small quantities of inferior substitutes for prewar imported manufactures and because Japan sent few goods to Southeast Asia (Robequain Reference Robequain1944, pp. 381, 383; Ingram Reference Ingram1971, p. 164; Thamsook Reference Thamsook1977, pp. 88–92; Hung Reference Hung2004, p. 188; Jose 2005, p. 270; Pe Reference Pe1961, p. 55). Given this absence of manufactured goods, and so long as a postwar redemption of wartime notes could be anticipated, as seemed especially likely in Indochina, Thailand, and Burma, it was rational to hold money. Probably peasants realized that manufactured goods would become more abundant after the war and prices would decline dramatically. The likelihood of redemption in Burma was bolstered by the establishment of the Ba Maw government in August 1943 and its 1944 announcement of a specimen Burmese currency.
After the war, most, but not all, of Southeast Asia avoided the “monetary overhang” that befell the Netherlands, France, Belgium, Denmark, and Norway (Barendregt Reference Barendregt1993). A notable exception was Indonesia where the returning Dutch found themselves forced to use Japanese scrip and put a great deal more of it into circulation to finance government in those cities that they controlled. Added to that, and so to already considerable inflationary pressures, Indonesian Republican forces issued their own currency in exchange for Japanese scrip (Cribb Reference Cribb1981). In Thailand and Indochina, wartime currency still circulated. However, Thailand wrote off its yen credits (Thailand 1951, pp. 54–55) and the Philippines demonetized Japanese currency as did Burma and Malaya.
SEIGNIORAGE AND THE INFLATION TAX
Governments and military administrations, Keynes (Reference Keynes1971, p. 37) remarked, rely on seigniorage to finance themselves when no other methods exist. Although that was not strictly true in Southeast Asia, for much of the war printing money was an effective, as well as a near costless, way for Japan to tax the mass of the population. This is not unusual: In Greece during World War II, despite hyperinflation, monthly seigniorage often exceeded German occupation costs (Palairet Reference Palairet2000, pp. 142–47). Between 1937 and 1945 in nationalist China, the government's needs were largely met through inflationary finance (Young Reference Young1965, p. 310). This section uses equation 4 to quantify seigniorage and decompose it into revenue from changes in real money balances and the inflation tax.
Japanese finance in wartime Southeast Asia relied on the inflation tax (Table 6) with some important differences between rice-surplus Thailand, Indochina, and Burma, where real balances were generally maintained, and Malaya, the Philippines, Indonesia, and Burma, where they were not. In Thailand and Indochina, high real balances, despite high inflation and falling GDP, allowed Japan to gain increasing amounts of seigniorage at relatively low cost. Between 1942 and 1944 seigniorage in Thailand doubled while the inflation tax (although still near 100 percent) fell somewhat. In 1945, however, real balances fell as Thais sought to avoid the tax on inflation. In other places, Japanese military administrators had to rely on high inflation taxes to try to offset strongly negative changes in real balances. In the Philippines, the inflation tax reached 651 percent in 1943 and 778.1 percent in 1944. That did not, however, prevent a sharp fall in seigniorage as populations sought to avoid taxation.
Seigniorage and Inflation Instability
The model in Figure 1 predicts that after the money demand function had shrunk enough, Southeast Asian economies would enter an unstable inflation regime. For the most part, however, even Southeast Asia's military-administered countries did not reach such a situation until late in the war. In the model, after the onset of rapid inflation the seigniorage-inflation relationship becomes unstable. Indeed, even if rapid inflation is followed by a heavy fall in seigniorage the ensuing equilibrium is likely to be unstable. At that point, inflation instability tends to rise at the same time that the level of real seigniorage begins to decline.
We can begin to look at this question in the Philippines following the mid-1943 change in Japanese war strategy which required more funding for defense installations. Then seigniorage both fell decisively and became unstable. We divide the sample at August 1943, which gives us 18 observations before this wartime break and another 18 following it, and regress seigniorage on a time trend. Figure 7 plots the fitted values and residuals for the two regressions. The standard deviation of the regression residuals is 4.96 for January 1942 to July 1943 but 9.97 for August 1943 to January 1945. A similar conclusion is also indicated by the timing of the instances when Philippine inflation exceeded 50 percent: all three were between August 1943 and the fall of Manila in February 1945.
SOUTHEAST ASIA COMPOSITION OF SEIGNIORAGE, 1942–1945
Note:
For 1945 Burma seigniorage data are up to June 1945 and for 1945 seigniorage for Malaya and Indonesia data are until July 1945.
Source:
See the Appendix.
PHILIPPINES SEIGNIORAGE, FITTED VALUES AND RESIDUALS, 1942–1945
Data for Malaya are less clear because they are far more incomplete than those for the Philippines. They are also complicated by Japanese attempts to cut money supply growth and restrict inflation (see the Appendix). At first, seigniorage rose, but like the Philippines, Malaya had a breakpoint in July 1943 (Figure 8). Malaya also shows large changes in seigniorage around the breakpoint, but the large standard deviation for the residuals of 20.0 for March 1942 to June 1943 compared to 5.6 for July 1943 through July 1945 likely reflects Japanese currency manipulations. The standard deviation for the last two years of the war would, of course, be much larger if it included the 34 days between the beginning of August 1945 and British reoccupation of Malaya, when money supply rose 77 percent and prices by almost 600 percent.
VON THÜNEN SQUATTERS' BAND
Japan Occupation Costs and Benefits
Japan went to war in Southeast Asia for economic reasons. At first, a policy of war to increase economic strength in East Asia looked an excellent investment. Japan lost a mere 3,500 men in conquering Malaya; for Burma, the toll was another 2,000. The rest of Southeast Asia fell with few casualties. “To destroy the British Empire in the Far East,” this was, Louis Allen (Reference Allen, Nish and Allen2011, p. 301) remarked, “not, surely, an inordinate price.”
The broader costs of World War II to Japan are, of course, well-known: some 2.7 million dead, almost half of the area of 66 Japanese cities leveled, two-thirds of Tokyo, Osaka, and Nagoya reduced to rubble and burnt ruins, utter devastation throughout the home islands until the 1950s, and a decade and a half before national income regained its 1937 level (Dower Reference Dower2000, pp. 98, 45–48, 118, 558–59; U.S., United States Strategic Bombing Survey 1946a, pp. 2, 54–55; Cohen Reference Cohen1949, pp. 406–09; Ōuchi Reference Ōuchi1958, p. 343). No doubt, some of these costs should be assigned to the occupation of Southeast Asia, but that is beyond our scope. Instead, we assume that the occupation of Southeast Asia was separate from the rest of the war and evaluate its cost to Japan in terms of military expenditure in Southeast Asia and the return on this expenditure.
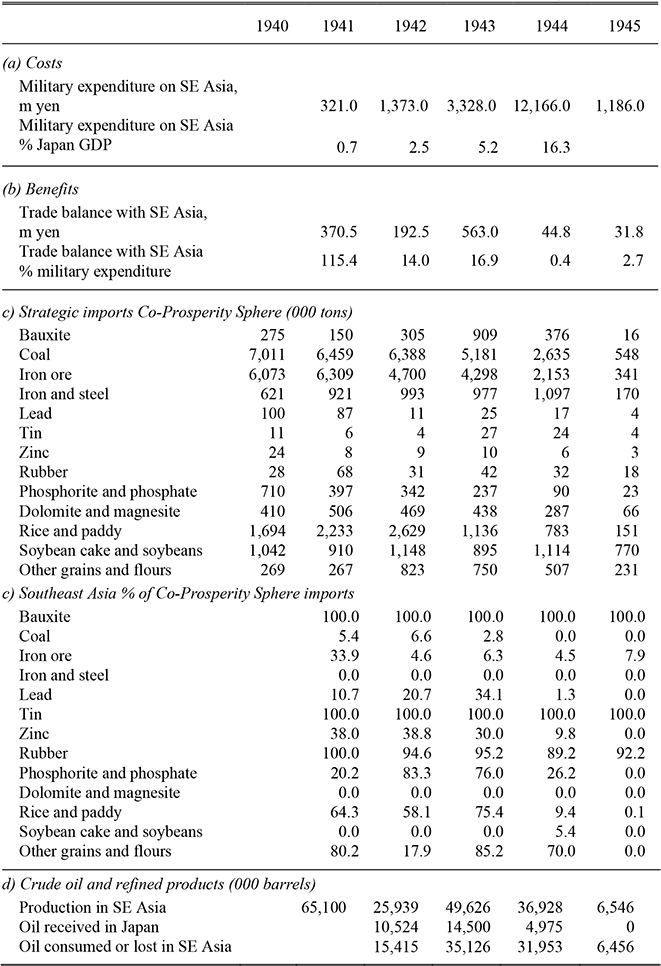
A military currency primarily aims “to fasten the costs of military occupation upon the occupied country,” something the Japanese did rather successfully in Southeast Asia (Lester Reference Lester1944, p. 396). Japanese financial dexterity and the policy of living off the land in Southeast Asia limited the cost of occupation. Nevertheless, between 1941 and 1944 Japan's military spending directly attributable to Southeast Asia averaged 6.2 percent of GDP, jumping to 16.3 percent in 1944, when Allied invasion threatened.
The next question involves the size of the transfers of tangible goods to Japan. As Table 7 shows, the net flow of goods from Southeast Asia to Japan was both tiny and a fraction of the outlay on military expenditures. Between 1942 and 1945 trade surpluses with Southeast Asia were 2.5 percent of military expenditure on the region. From 1942 through 1944 trade surpluses amounted to four-tenths of a percent of Japanese GDP (Table 7, panels a and b). Trade surpluses may be somewhat understated because the shipment of military goods to Southeast Asia may appear both as Japanese military expenditure and as exports to Southeast Asia. But the picture is clear: the flow of tangible goods to Japan during the war could not offset large costs.
Yet it might be that these small imports had huge strategic value. Rice was important. Southeast Asia also yielded two raw materials unobtainable elsewhere and fundamental to Japan's war effort (Table 7, panels c and d). One was bauxite which, used to make aluminum, was essential for aircraft manufacture. Imports from Southeast Asia enabled Japan to stay in what was, above all, an air and sea war (U.S. 1946b, 1946a, pp. 23–25, 49–50). Japan was less fortunate with the other critical raw material, oil, because Allied depletion of Japan's oil tanker fleet increasingly interdicted petroleum shipments. By 1944 Japan's two years' prewar petroleum stockpile was exhausted, and little oil from Southeast Asia reached Japan (Table 7, panel d). The last Japanese tanker convoy for Japan left Singapore on 19 March 1945; it probably never arrived (U.S., 1946c, pp. 6, 49). Again, strategic inputs cannot balance an investment decision to make Southeast Asia part of an East Asian Japanese Empire.
JAPAN HOME ISLANDS COSTS AND BENEFITS OF SOUTHEAST ASIA, 1941–1945
Notes:
(1) Total military expenditure includes both Army and Navy expenditure and refers to expenditure made in Japan. (2) Tons are metric tons. (3) Imports of scrap iron are excluded. They were (in 000 tons) 2,124 in 1940 and 181 in 1941 but then became negligible. (4) For 1941 iron ore for Southeast Asia includes imports from countries outside the Co-Prosperity Sphere. (5) GDP data from Ohkawa and Shinohara do not differ greatly from that in U.S. United States Strategic bombing survey, 1946a, p. 84. (6) Oil data are approximate due to destruction by the Japanese of records in Singapore. No division between oil consumed in Southeast Asia and oil lost in the region is possible.
Sources:
Military expenditure: 1946a, p. 85; Japan, Ministry of Finance, 1955. Trade and Strategic Imports: U.S., United States Strategic Bombing Survey, 1946a, pp. 189–96; Japan, Ministry of Finance, 1941–1951, data for 1941–1944-48. Oil supplies: Cohen Reference Cohen1949, p. 140. GDP: Ohkawa and Shinohara Reference Ohkawa and Shinohara1979, p. 269.
CONCLUDING REMARKS
Japan had hoped to gain much more from Southeast Asia than wartime exploitation through financial arrangements. It sought to acquire a “natural” economic region big enough to secure independence from the international economy. East Asia would be molded into a vast autarkic economic unit centered on Japan, supplying both resources to it and a market for Japanese goods. While wartime financial policy was only a part of this plan, it revealed, perhaps as much as anything, the reality of Japan's vision for Greater East Asia.
After deciding on war to pursue empire, Japan had little alternative to inflation to finance occupation in Southeast Asia. Whatever its longer-term effects, high inflation was an efficient means of wartime finance. It avoided the enforcement problems of overt taxation in a big geographical area with a predominantly rural population.
To fund the war effort, Japan imposed administratively set exchange rates, required Southeast Asian governments to issue massive amounts of currency, and in Thailand and Indochina enacted a yen bloc of bilateral trading arrangements. The combined effect was to create large international debts in Southeast Asia but eliminate any mechanism forcing Japan to reduce these. It is striking that even military-administered Southeast Asia had comparatively moderate, Latin American-like inflation for much of the war and hyperinflation only near its end when Japan had clearly lost. In light of the model explored in this article, Southeast Asia's wartime inflation experience is testament to a combination of strict Japanese controls and the transactions benefits of holding money despite its rapidly depreciating real value. Stanley Fischer advocates legal requirements to use domestic rather than a foreign currency as a way for governments to capture seigniorage (Fischer Reference Fischer1982, p. 306). Japan, like revolutionary France some 150 years earlier, successfully implemented this approach by backing up monetary monopoly and legal requirements to use government currency with an effective, if drastic, enforcement mechanism. Both in France and for Japan, strongly enforced legal restrictions ensured that seigniorage could largely finance war.
In Southeast Asia, a continuing demand for real balances enabled Japan to avoid issuing as much new money as would have been required if the demand for real balances had been less and therefore the rise in prices greater. Scrip, occupation costs, clearing arrangements, and seigniorage afforded Japan a low-cost way to finance occupation and gain control of Southeast Asian resources. In the end, however, major Japanese failures in naval strategy and the protection of oil tankerage and other merchant shipping told heavily. These failures prevented Japan from realizing the full exploitative potential of the financial measures analyzed in this article.
Data Sources Appendix
BURMA
Money Supply: Japan Center for Asian Historical Resource, National Archives of Japan [hereafter JACAR], B05013001900 (Japan, Foreign Office Diplomacy Record, File No. Navy-I-1-6), Southern Regions Development Bank, “Monthly Balance of Southern Development Bank Notes”; Bank of Japan Research Bureau 1970, p. 384; Longmuir Reference Longmuir2002, p. 43.
Prices: Prices are for Rangoon and from Bank of Japan Research Bureau 1970, p. 385.
MALAYA
Money Supply: JACAR, Southern Regions Development Bank, “Monthly Balance”; Bank of Japan Research Bureau 1970, p. 384.
Prices: Prices are for Singapore and up to December 1944 from a wholesale price index from the Bank of Japan Research Bureau 1970, p. 385. Money supply data for the first part of the occupation are weak, largely absent, and should be treated with caution. A first data point is for February 1942 but data are absent for March 1942 through February 1943 and for Figure 7 have been interpolated. Data for March 1943 are subject to two quite contradictory figures and it was decided to omit both. After March 1943 money supply data exist for each month and, until August 1945 are judged reliable. December 1944 prices are linked to a cost of living index from NA, CO853/726/3, “Validity of Contracts Entered into Before and During the Japanese Occupation.” The cost of living index was constructed by British authorities after the war using Japanese records of a large variety of retail prices and records from a number of government bodies. Weights are: foodstuffs 0.65; tobacco 0.04; light and water 0.04; transport 0.10; clothing 0.08 and rent 0.09. For May to 12 August 1945, this cost of living index is linked to an index of the value of the British-issued Straits dollar in terms of occupation currency. Throughout the occupation the cost of living and value of Straits dollar indexes moved closely together. However, the Bank of Japan wholesale price index records substantially higher inflation than the British reconstruction of a cost of living index.
THAILAND
Money Supply and Yen Credits: Thailand, Department of Commerce and Statistics, 1944, p. 435; Thailand 1951, p. 54. Payments to Japan are yen credits plus Thailand's trade surplus. The annual trade surplus and sale of gold by Japan are from Shenoy Reference Shenoy1950, p. 291. In the official statistics, the inclusion of yen credits as imports gives the misleading impression that Thailand ran a large trade deficit with Japan. See Thailand 1951, pp. 7–14.
Prices: Ingram Reference Ingram1971, p. 164 derived from Bank of Thailand figures for the cost of living and based on the family budget of white-collar workers and wage earners in Bangkok. According to Ungphakorn and Suvarnsit (Reference Ungphakorn and Suvarnsit1952, p. 70) the inflation figures cited in Ingram are “lower than most people would consider as representing the actual level of prices.” For an alternative, somewhat different but apparently less reliable, price index, see Thailand 1951, p. 55.
Government Revenue and Expenditure: Thailand 1951, pp. 1–3.
INDONESIA
Money Supply: JACAR, Southern Regions Development Bank, “Monthly Balance.” The 1941 figure is from Shibata 1996, p. 702, which gives the sum of 316m guilders for 6 December 1941. Payments to Japan are the annual change in money supply.
Prices: Bank of Japan Research Bureau 1970, p. 385. Prices are for Jakarta and differ in some instances from prices for Medan in the same source.
INDOCHINA
Money Supply, Yen Credits, and Trade Surplus: Indochina, 1927–1948, data for 1941–1942, pp. 176, 245 and 1948, pp. 179–80, 287. Yen credits are expenditure by Japanese armed forces in Indochina and from NA, FO371/53959, Lt. Colonel T. H. Sweeny, “Second Report on Japanese Financial Manipulations in French Indo China.” After a 9 March 1945 coup the Japanese took over Indochina. They printed large amounts of currency near the end of the war, but much of it appears not to have been put into circulation.
Prices: Vietnam 1951, p. 283. Price data are for the Saigon working class cost of living. For 1945 data are an average of the first two quarters.
Government Revenue and Expenditure: Indochina 1948, pp. 257–60, 304. The budget deficit is quantified as “VII. Recettes extraordinaires” on p. 260. A similar entry does not appear for 1942. See Indochina 1945, p. 245.
PHILIPPINES
Money Supply: Romualdez Reference Romualdez1962, pp. 450–52. Money supply data include the 230m of prewar treasury certificates. Before 1945 money supply data from Romualdez and JACAR, Southern Regions Development Bank, “Monthly Balance” are in close agreement but for 1945 the Bank's data show a smaller increase in money supply.
Prices: Romualdez Reference Romualdez1962, pp. 461–62. Price data are unavailable after January 1945.
Note: In military-administered Southeast Asia, money supply data during the first year of the Japanese occupation exclude, except for the Philippines, prewar currency issue. During this period, before the use of colonial currencies was prohibited data are subject to some uncertainty since it is unknown at what rate prewar money disappeared from circulation.
GDP
Notes: For Burma, the Philippines, and Japan all data are from Angus Maddison (Reference Maddison2003). Figures for Malaya, Thailand, Indonesia, and Vietnam are benchmark per capita GDP in Maddison (1938 benchmark for Thailand and Indonesia; 1913 for Malaya and Indochina) and use per capita GDP data from Pierre van der Eng and Jean-Pascal Bassino, transformed into indexes, to extend Maddison's data. The indexes are multiplied by Maddison's benchmark 1990 GK$. Results of this estimation procedure agree closely with 1950 figures from Maddison. Malaya includes the Malay Peninsula (including Penang and Malacca) and Singapore. Account is taken of higher per capita income for Singapore than the peninsula as follows. For both 1913 and 1950, Maddison shows Singapore per capita income to be 42 percent higher than peninsular. Accordingly, peninsular per capita income is multiplied by 1.42 to estimate Singapore's income. Malayan income to include Singapore is weighted, for 1938–1940, by Singapore's share of 12.9 percent of Malayan population recorded by the 1931 Census and, for 1949 and 1950, the 16.1 percent share recorded by the 1947 Census. Per capita income in Indochina is assumed to be the same as in Vietnam and estimated to include Cambodia and Laos by multiplying the 1936 share in total Indochina population of those two provinces by Vietnam GDP and adding the result to Vietnam GDP. In 1936 Vietnam contained 82.4 percent the prewar Indochinese population. While GDP measures are the estimates of highly knowledgeable scholars of Thailand and Indochina respectively, they are still likely to incorporate a margin of error. Estimates may also underestimate GDP due to difficulties in taking into account black market transactions.
GDP Sources: Maddison (Reference Maddison2003, pp. 180–85); Van der Eng (Reference Van der Eng1991, Reference Van der Eng1992a, Reference Van der Eng1992b, pp. 368–69, Reference Van der Eng1994); Bassino, forthcoming and personal communication (Nov. 2010), Vietnam national income, 6 Feb. 2011.
Exchange Rates: Van der Eng (Reference Van der Eng1993).