How high were living standards in preindustrial society? This issue has been recently debated for preindustrial England.Footnote 1 Day wage evidence suggests living standards were trendless in preindustrial England from 1200 to 1800, and significantly higher than in much of modern Africa.Footnote 2 Other sources, however, suggest significant growth. England before 1600, for example, despite the high estimated real wages, was less than 5 percent urban.Footnote 3 But urbanization increased steadily between 1550 and 1800, to 28 percent by 1800.Footnote 4 The supposed Consumer Revolution of 1600–1750 is another indicator of income growth. The Industrious Revolution, an increase in work days per year, has been in turn posited to reconcile the general economic growth witnessed by countries such as England and the Netherlands, 1200–1800 in the absence of day wage gains.Footnote 5
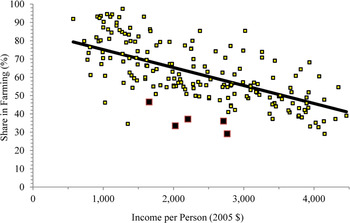
SHARES IN FARMING, FORESTRY, AND FISHING AND REAL INCOME PER PERSON, 1946–2005

Here we estimate the farm shares in preindustrial England in 1560–1579 and 1653–1660 from probate documents, and show that it is completely compatible with the income levels suggest by real wages. One reliable relationship in economics is Engel's Law, which implies that poorer societies have a larger share of people employed in farming, fishing, and forestry. Figure 1 shows, for example, the share of the population employed in farming, forestry and fishing in countries 1946–2005 that had per capita incomes for the same year below $4,500 (in 2005 U.S. Dollars). There are 66 countries, and a total of 182 observations.Footnote 6 The estimated relationship between the farm share and income is linear.Footnote 7 Using fixed effects for countries with more than one observation, the estimated fit for this data is

where θ is the share in farm employment, and y is income per capita in 2005 dollars. The R 2 is so high because countries that deviate from the regression line in Figure 3 tend to do so systematically. There were observations for Guyana, for example, for 1946, 1960, 1965, 1977, and 1980. The farm share in employment in Guyana was always 26–35 percent less than predicted by the regression line. The likely major source of these effects are systematic errors in estimating comparable real incomes across countries, which are fixed by benchmark date estimates of comparative price levels. But this regression implies that if we know the real income and farm employment share in England in a later period, then we can with high confidence infer its likely earlier farm share from earlier incomes.
Note that the relationship estimated in equation 1 implies the income elasticity of demand for farm output varies with income.Footnote 8 For an income of $1,000 (2005 dollars), the lowest end of the modern range, it is as high as 0.87. For England around 1800 it is 0.58. This elasticity is reasonable given the evidence from poor English workers' budgets in 1787–1796, 1837–1844, and 1863 of an average food expenditure elasticity of 0.62.Footnote 9
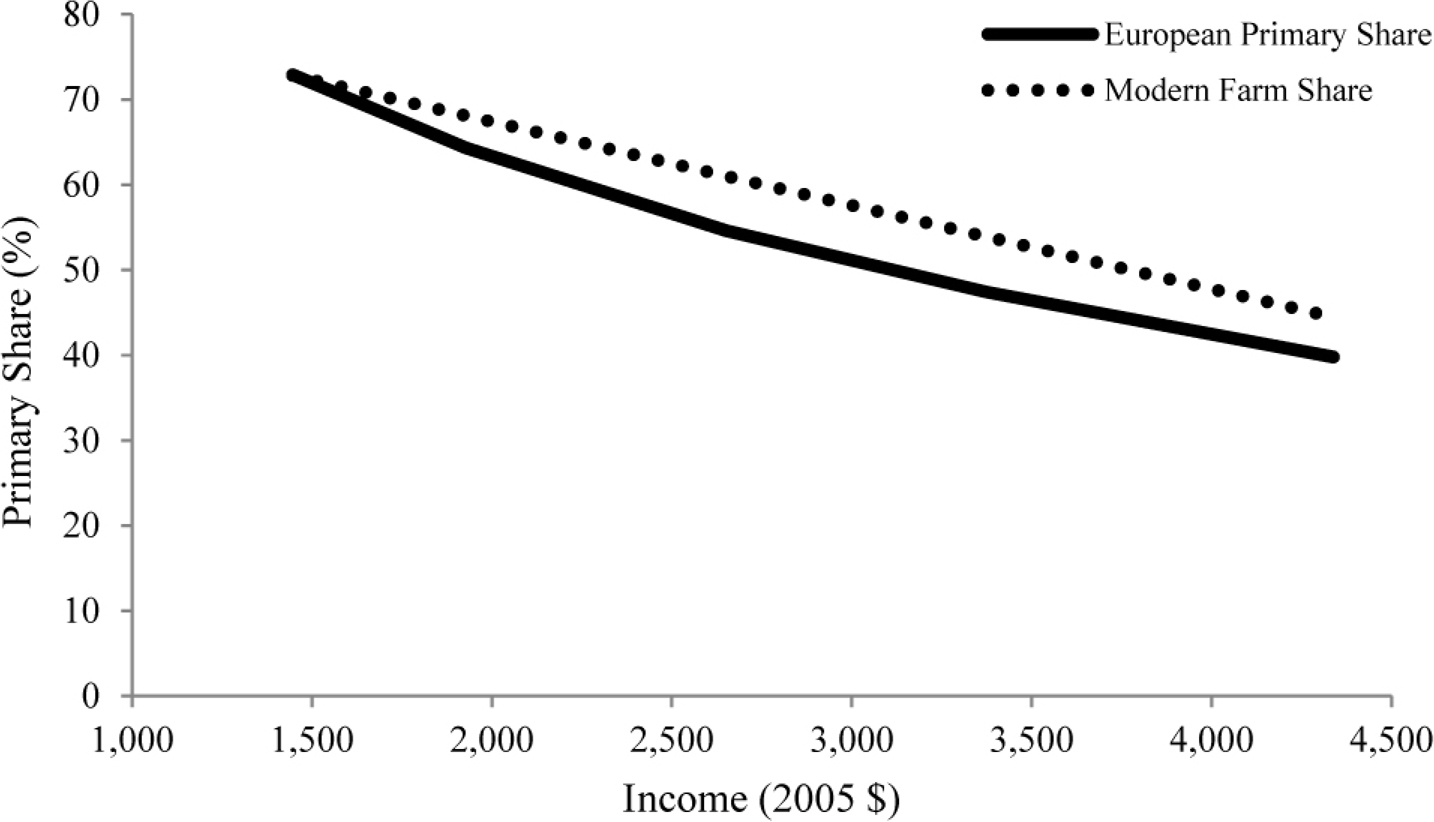
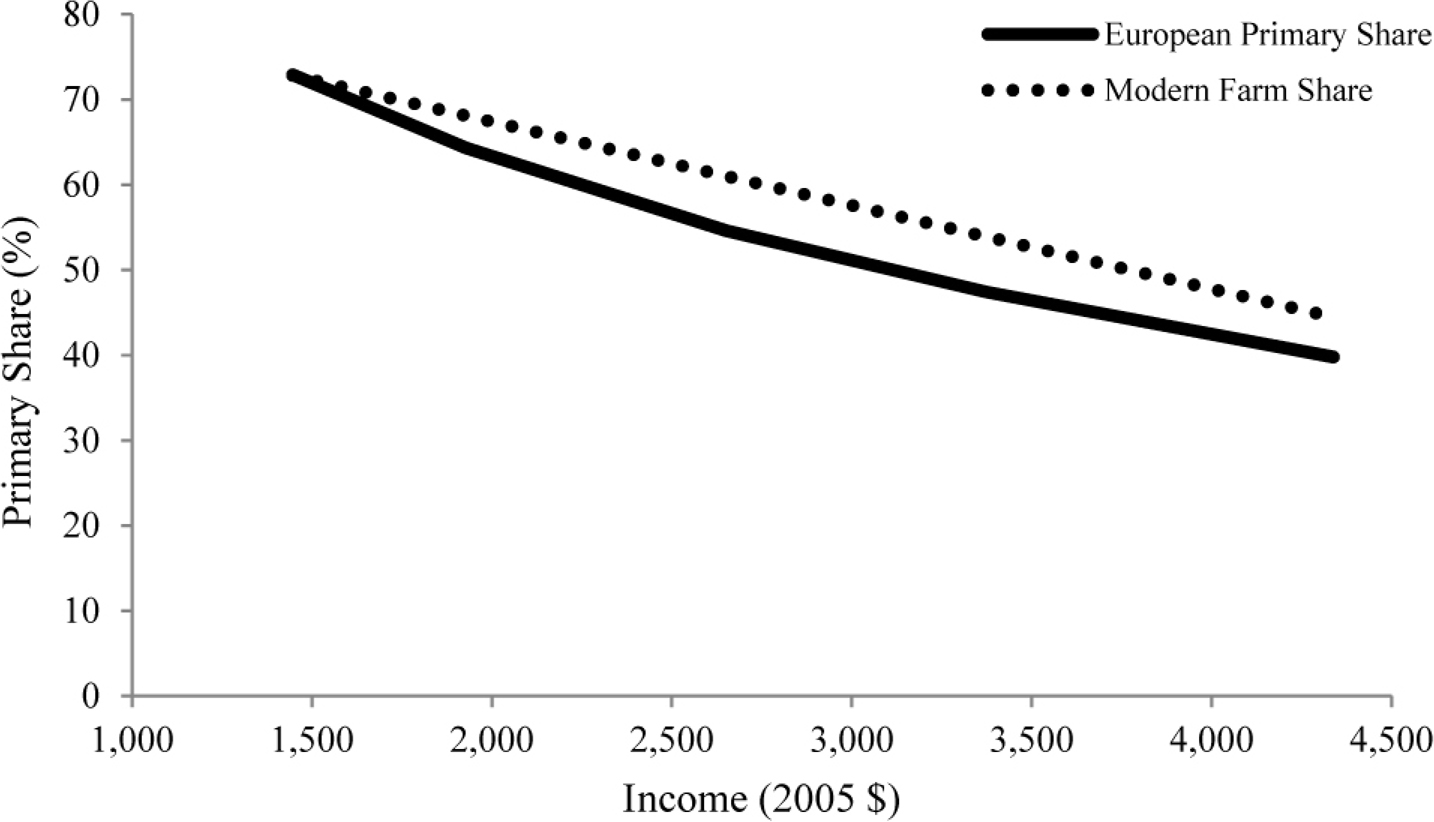
It may be objected that the modern relationship between the farm employment share and income is different for some reason in early Europe. Figure 2 shows the estimated modern farm share/income relationship compared to that Nick Crafts estimated for nineteenth-century Europe. At higher incomes, the European primary share is less than the modern farming share, but at the incomes proposed by Angus Maddison and Stephen Broadberry et al. for preindustrial England there is little difference. We have to expect farm employment shares of 70 percent or more in England before 1600 if there was significant preindustrial growth.Footnote 10
NINETEENTH-CENTURY EUROPEAN INCOME AND PRIMARY SHARES FROM CRAFTS
Here we argue that the day wage evidence of lack of growth 1200–1800 in England cannot be easily dismissed. We use occupations reported in probate records in England 1560–1858 to show that the farm employment share in 1560–1579 and 1653–1660 was in fact much higher than the urbanization rate might suggest, and is completely consistent with the standards of living suggested by English wage data over these years. Even earlier data from the Poll Taxes of 1379 and 1381, detailed in Clark, suggest similarly a low farming employment share and high incomes in these years.Footnote 11 The low preindustrial farm employment share supports the reliability of the day wage evidence, and the consequent absence of long-term growth in England, 1200–1800. By implication, the real wage series elsewhere in Europe are likely a good guide to living standards also.
PROBATE RECORDS AS A SOURCE ON PREINDUSTRIAL OCCUPATIONS
A potential source for the English occupational structure over time is statements of occupation in probate records.Footnote 12 After 1695 parish registers of baptisms, marriages, and deaths begin to more frequently record occupations, and as a census of the whole adult population are likely a preferred way of estimating the occupational structure of the population.Footnote 13 But before 1695 parish records rarely note occupations. Even post 1695 the parish registers reveal little about female occupations, women being one-third of the labor force in 1861. And by 1841 and later, the female share employed in farming is much less than for men. The only alternative sporadically available occupation sources before 1695 are muster rolls and tax lists.
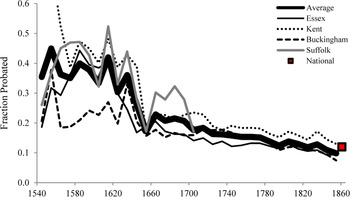
Probate records, however, indicate occupations for a substantial number of those probated from the 1540s onwards. Indexers of probate archives often list these occupations, making large numbers of such statements available for analysis 1540–1857. Figure 3, for example, shows the estimated fraction of adult men dying in Buckingham, Essex, Kent, and Suffolk who were probated in the various ecclesiastical courts covering these counties.Footnote 14 This is, by decade, the number of surviving probate records for men, divided by the estimated number of adult men dying.Footnote 15
Though they cover a substantial fraction of the preindustrial, male population probates are potentially misleading on the sectoral occupational distribution in that richer men were always more likely to be probated. If an industry was capital or land intensive, it would be overrepresented in probate occupations (assuming the producers tended to also own the production equipment). Thus in 1841, when we can compare the distribution of occupations in probates in Essex with those in the census, shoemakers (little capital) are undercounted in probates, and millers (much capital) are overcounted. Probates will reveal the true share in farming only if farm producers are as likely to be property owners as nonfarm producers. Fortunately, as we will see below, this appears to be the case in all periods 1540–1858. Indeed, if anything, will occupations oversample the farming sector. Nigel Goose and Nesta Evans, for example, claim that in the sixteenth and seventeenth centuries will making was relatively less frequent among men in larger towns.Footnote 16
FRACTION OF MEN PROBATED BY DECADE, 1540–1861

HOW REPRESENTATIVE WERE PROBATES OF THE FARMING EMPLOYMENT SHARE?
The key test of whether male probate occupations accurately represented the farm share is whether such occupation reports were generated proportionately to population in rural and urban areas. Suppose the proportion of men probated differed between the farm and nonfarm sectors: the fraction of the population reporting an occupation through probate was ωf in farming, and ωnf in nonfarm occupations. Suppose also ωf < ωnf. In that case, the probate occupation rate in completely rural parishes would be, at ωf, lower than the proportion in completely urban parishes, ωnf. In general suppose that the true fraction of a parish in farm occupations was ϕ. Then the overall rate of probate occupation reporting per person will be

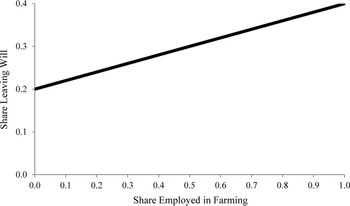
HYPOTHETICAL PROBATE RATES AND NONFARM EMPLOYMENT SHARES, ΩF ≠ ΩNF

If ωf < ωnf then the more rural the parish (the greater is ϕ), the lower the probate occupations rate. Figure 4 illustrates what the frequency of probates would look like as we move from all farm parishes to no farm parishes if ωf = 0.2, and ωnf = 0.4. We would see a clear gradient in probate frequencies between town and country.
Thus the key test of whether will occupations tend to over or understate the share in agriculture is the frequency of occupation reports relative to populations in rural and urban areas. If rural populations have probate occupation rates the same rate as urban rates, then probates must correctly report the farm share of the population. Only if probate occupation frequencies were lower in rural areas would probates understate the share in farming.
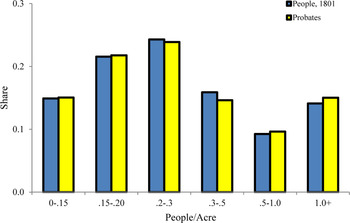
In England from 1540 to 1841 probate occupations tend, if anything, to modestly over sample the rural population in all periods, and thus are biased towards reporting too many farm occupations. In 1801 and 1841 probate occupation reports come in exactly the same proportion as populations in rural and urban areas. Figure 5 shows the share of probate occupations and population, by parish population density, for 1801 for Essex. The correspondence is close. A similar figure for 1841 for Essex shows exactly the same correspondence.
THE DISTRIBUTION OF PROBATES VERSUS PEOPLE, ESSEX, 1801

In earlier years, probate occupation reports cover a larger share of the male population, including poorer men. But this does not seem to bias them in any way towards nonfarm populations. Now, indeed, they tend to modestly oversample rural areas. One earlier measure we have of parish populations, and population densities, is the Hearth Tax of 1662–1689. The Hearth Tax was an assessment collected on every fire hearth or stove. The records list both the numbers of 1841 hearths and the houses in each parish, even the hearths of those so 1841 poor they were excused from the tax. We measure parish population density 1662–1689 through hearths per acre, rather than houses, since richer houses would have multiple hearths, which represent their likely Tax large population of servants. For example, Ampton in Suffolk in 1674 had just eight houses. But one of these, that of Sir Algernoone May, had 21 hearths, so that the parish had 38 hearths, which likely better indicates its true population.
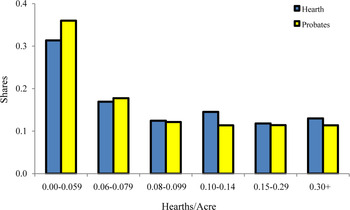
PROBATE OCCUPATIONS VERSUS HEARTHS PER ACRE, ESSEX, 1670

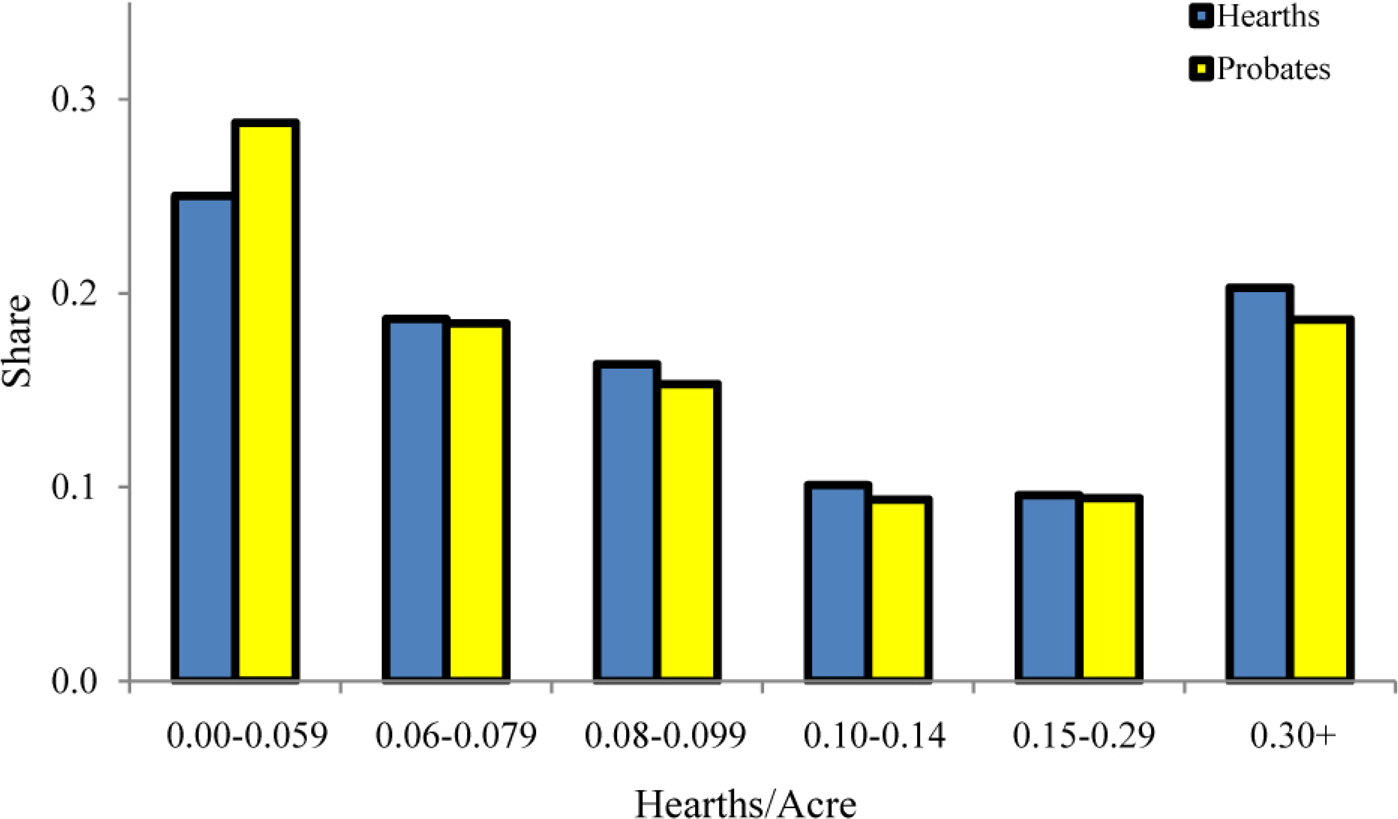
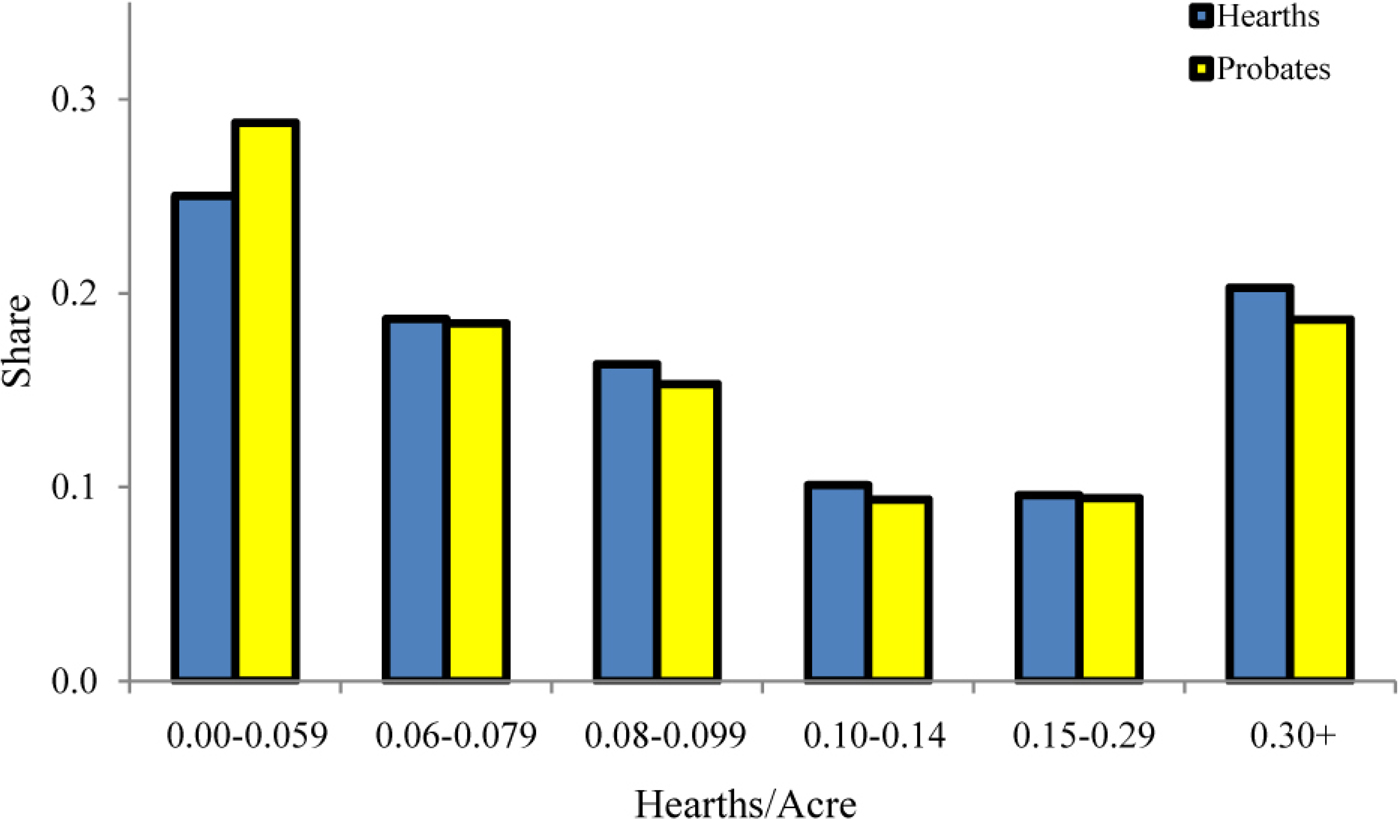
Parishes were divided into six groups based on the number of hearths per acre: from the most rural with 0.00–0.06 hearths per acre, to the most urban with more than 0.3 hearths per acre. Figure 6 shows for Essex the distribution of population across parishes of the various levels of hearths per acre in 1670, compared to the distribution of probates reporting occupations in 1650–1699.Footnote 17 In 1670 the probates tended to modestly oversample occupations in rural areas. A similar pattern is revealed in Suffolk in 1674. Figure 7 shows the distribution of parishes across different population densities in Suffolk as revealed by hearths rural parishes with less than 0.2 people per acre, to the most urban with more than 7 people per acre.
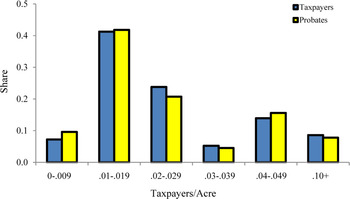
We get an even earlier estimated parish population density for Suffolk from the records of the Lay Subsidy of 1524. These lists of taxpayers by parish, which included as well as property holders also wage earners earning at least £1 per year, allow an approximation to parish population densities in Suffolk in 1524.Footnote 18Figure 8 shows that even as early as 1540–1599 will occupation reports are distributed across rural and urban parishes in proportion to their relative populations in 1524. From at least 1540 the share of people reported as farming in probate records will provide an unbiased estimate of the farm share in the population.
PROBATE OCCUPATIONS VERSUS HEARTHS PER ACRE, SUFFOLK, 1674
PROBATE OCCUPATIONS 1540–1599 VERSUS TAXPAYERS, 1524, SUFFOLK

SHARES IN FARMING AND FISHING, 1841
Notes:
Occupation shares based on all probates for Essex and Surrey, 1824–1857.
Thus probate occupations in preindustrial England, if anything, tended to modestly overstate farm occupation shares in both the sixteenth and seventeenth centuries. The likely reason for this earlier bias is that farming in preindustrial England was even more property intensive than town production activities, because of the value of land and farm inventories.
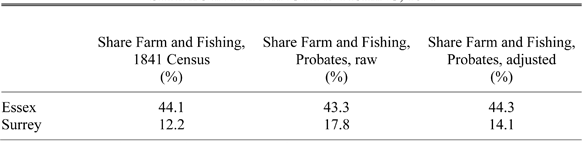
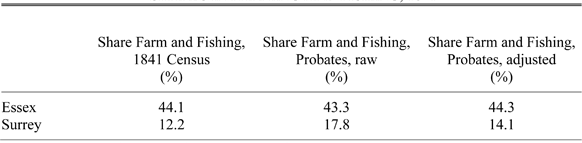
The second test of will occupation reports as a source on the general occupational split between farming and fishing and other occupations comes by comparing these reports for the years 1824–1857 with occupations in the 1841 Census. The 1841 Census has the advantage that occupations were recorded in a terms very similar to those of occupation statements in probates. Table 1 shows the census share in farming in Essex and Surrey, counties with very different degrees of urbanization, compared to the shares among men's probates stating occupations.Footnote 19 The Essex shares match almost exactly. In Surrey, the probates report too many men in farming. But this stems largely from there being disproportionately many probates from rural areas. Once we correct for that, the farming share in probates is within 2 percent of the census share. While the probates show accurately the farm— nonfarm division of the population, they are not so useful in revealing the occupational structure within the nonfarm sector, because, as noted, more capital intensive occupations produce more probates.
THE PROBATED SHARE IN FARMING BY PARISH POPULATION DENSITY, ESSEX
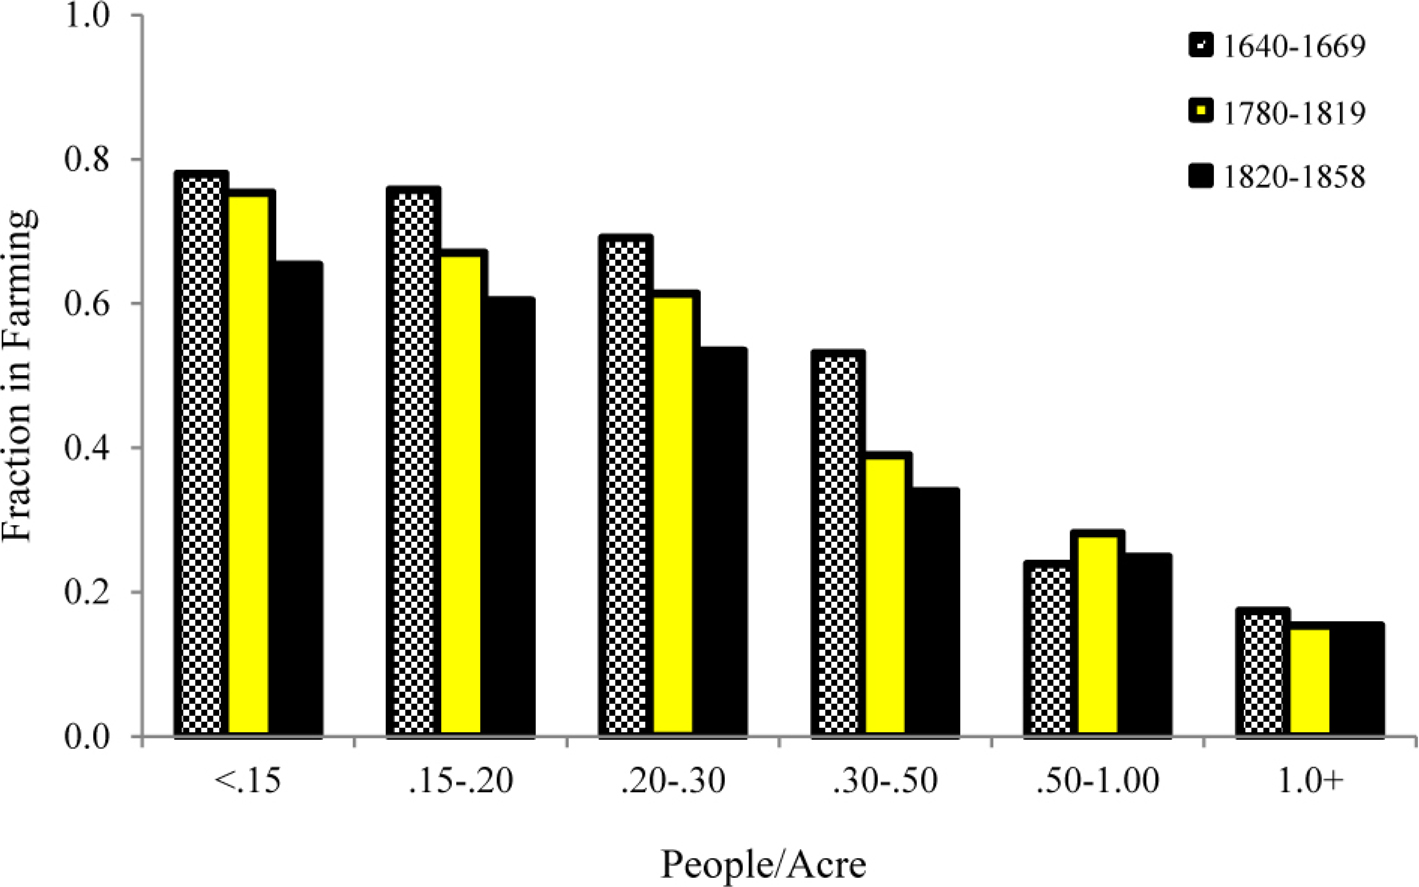
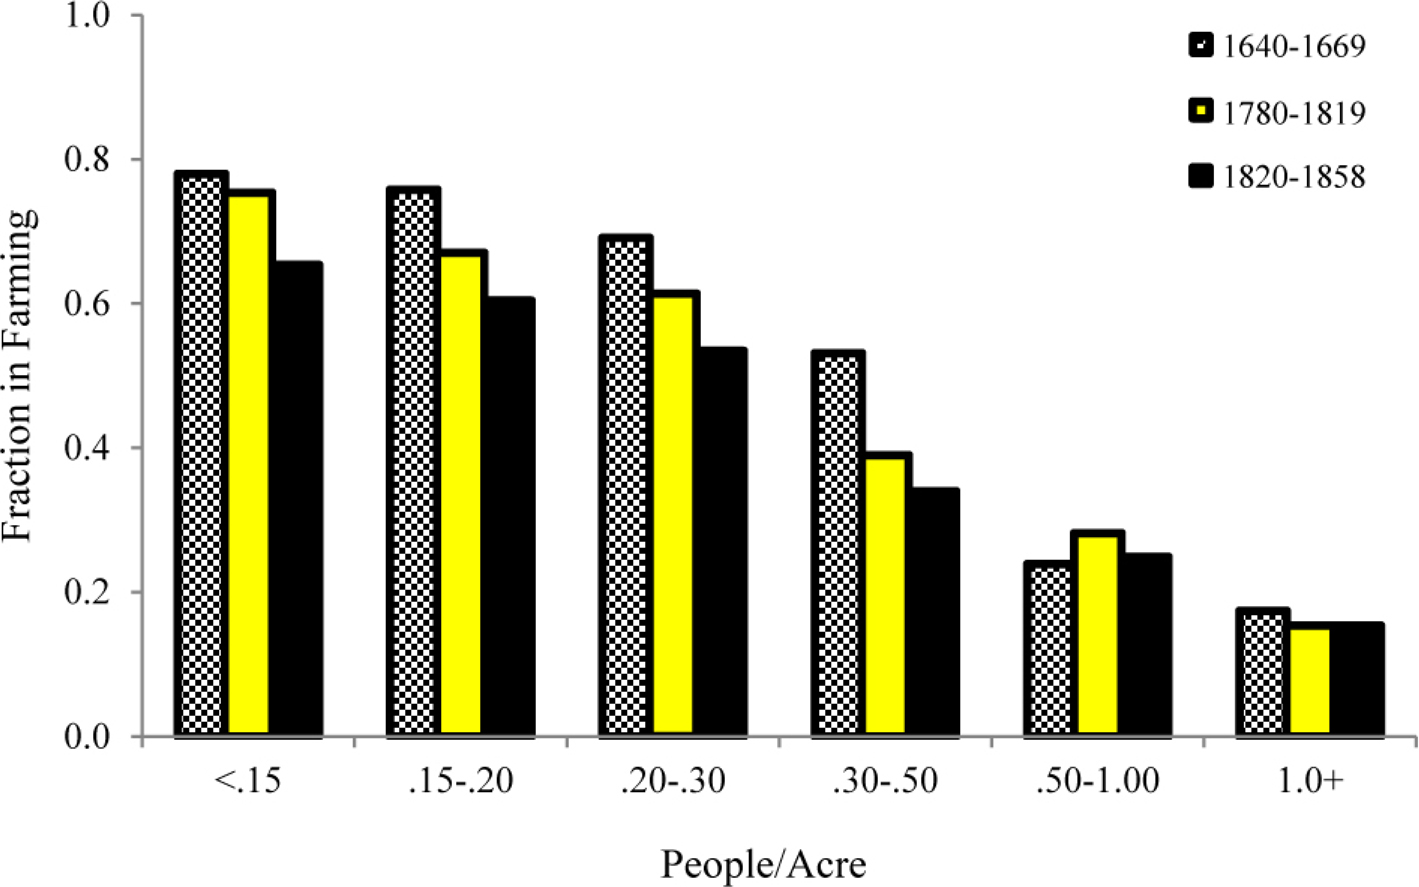
The reason we find below that the share of farming nationally was only 60 percent even before 1660, despite low levels of urbanization, is that even in completely rural areas a significant fraction of men reported occupations outside farming. Figure 9 shows the share of testators reporting farming or fishing as their occupation in Essex in three periods—1640–1679, 1780–1819, and 1820–1858—where parishes are grouped by their estimated numbers of people per acre in each period.Footnote 20 Even in the most rural parts of Essex in 1640–1679, those with more than 6 acres per person, only 75 percent of the probated reported farming occupations. And in a broad swath of parishes which would not be counted as urban—they had between 1 and 5 acres of land per person—only a minority of the probated engaged in agriculture.
Looking at parishes with less than 0.3 hearths per acre in Suffolk in 1675, for the years 1600–1702 the main occupations were as follows: farming and fishing, 0.666, clothing production and distribution, 0.128; clergy, 0.049; food production and distribution, 0.046; building trades, 0.036; transport, 0.027; and metalworking, 0.019. Rural preindustrial England thus had both significant manufacturing activity, but also trade and transport. The share of the probated in the most rural parishes of 1670 reporting farming occupations circa 1800 and 1840 declined only modestly—to 69 percent in 1800 and 61 percent in 1840. The preindustrial countryside in England had many manufacturing and service workers.
We see exactly the same phenomenon of significant numbers of rural workers in nonfarm employment in the occupation reports from the earlier Poll Tax returns of 1377–1381.Footnote 21 This is why urbanization rates in preindustrial England provide a very poor guide to the share of the population employed in farming.
NATIONAL FARMING SHARE, 1652–1660
Before 1858 estates in England were probated in a great variety of ecclesiastical courts. Thus getting a representative sample of probate occupations for every county in England would be an enormous task. However in 1652 to 1660, in the Interregnum, the great majority of probates were filed in the newly established national Court for Proving of Wills and the Granting of Administrations, which sat in London. The index of this court in these years is available to us from the National Archives, filed with the Prerogative Court of Canterbury probates. We thus have for 1652–1660 an estimate by county of the farming share in employment.
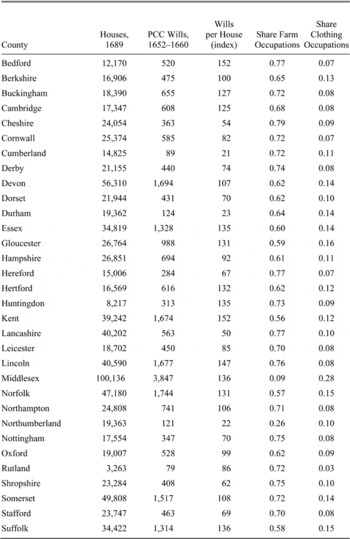
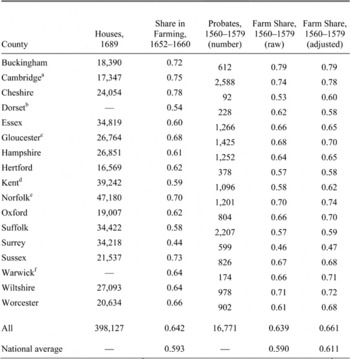
Table 2 shows for each county in England the number of houses in 1689 estimated from the hearth tax.Footnote 22 This measures the likely relative populations of these counties in 1652–1660. In the third column in the table are shown the number of interregnum probates giving occupations for each of these counties in 1652–1660. The probate frequencies relative to the likely populations of the counties are shown in column 4, with 100 set as the average. The closer is a county to London, the greater the probate numbers relative to estimated population. Thus the most northern counties, Cumberland, Northumberland, Durham, and Westmorland, all show only 21–29 percent of the average number of probates per person. To get the national share in farming and fishing we thus have to reweight the share in farming in each county by the relative county population, to correct for the underrepresentation of the north of England.
FRACTION IN FARMING AND FISHING BY COUNTY, 1652–1660

Sources:
Houses, 1689. Glass, “Gregory King's Estimate,” p. 372, Houghton estimate.

The fifth column shows the fraction of will makers in each county in 1652–1660 who reported their occupation as being in farming or fishing. This varied from a low of 9 percent in Middlesex to a high of 79 percent in Cheshire. For 1652–1660 the population weighted average for the country as a whole was 59 percent. Thus even one hundred years before the Industrial Revolution, a substantial fraction of the English labor force, 41 percent, was engaged in other than agricultural occupations.
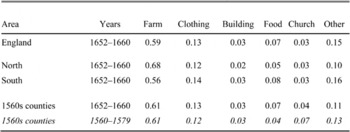
Interestingly, in 1652–1660 there is little evidence from the probates of the later industrialization of the north. By the 1760s Leigh Shaw Taylor and E. A. Wrigley report that about 65 percent of the occupied of Lancashire and the West Riding of Yorkshire were employed in manufacturing. As Table 3 shows, on average 68 percent of the probated in the north were engaged in farming, compared to 56 percent in the south. Lancashire, in particular, reports 77 percent in farming, well above the national average.
Table 2 also shows the fraction of those probated engaged in the production and distribution of textiles and clothing, shown in the last column.Footnote 23 Lancashire is below the national average of 13 percent, and Yorkshire just at this average. Concentrations of such workers appear in Middlesex, followed by Worcester and Gloucester. However, if we look just at the production of cloth (such occupations as weaver, fuller, dyer, shearman, comber, clothworker, and clothier) the county with the largest percentage was Suffolk (9.2), followed by Worcester (8.1), Devon (8.1), Gloucester (7.8), Norfolk (7.3), Somerset (7.3), Essex (6.9), and Wiltshire (6.9). Cloth production was concentrated in East Anglia and the South West, as would be expected from the history of these industries.

NATIONAL FARMING SHARE, 1560–1579
From probates, the earliest broad representative estimation of occupational structure we can get is 1560–1579. Before this few probates state occupations, and those that do are potentially unrepresentative, since they seem to contain too many clergy. Probates fell under ecclesiastical courts, and clergy may have had easier access to these courts in early years.
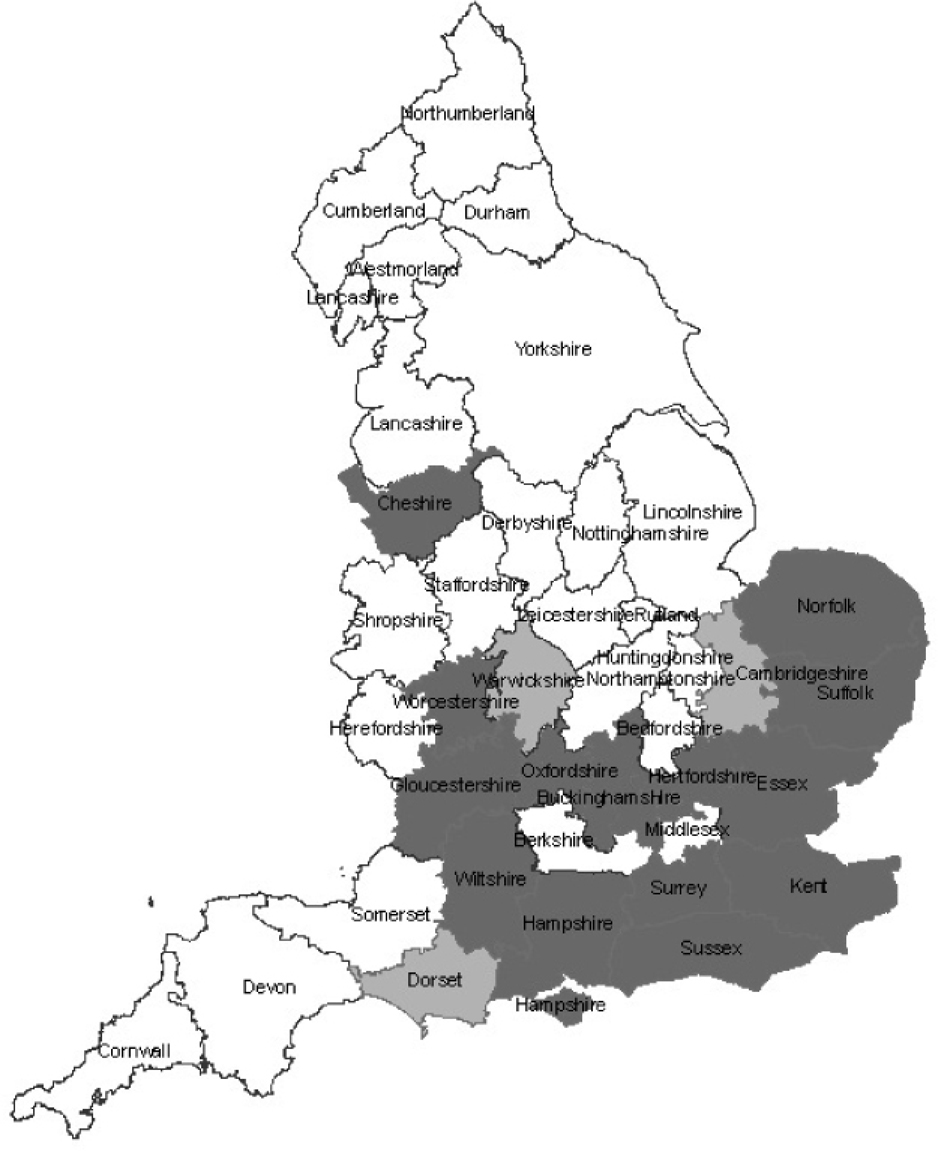
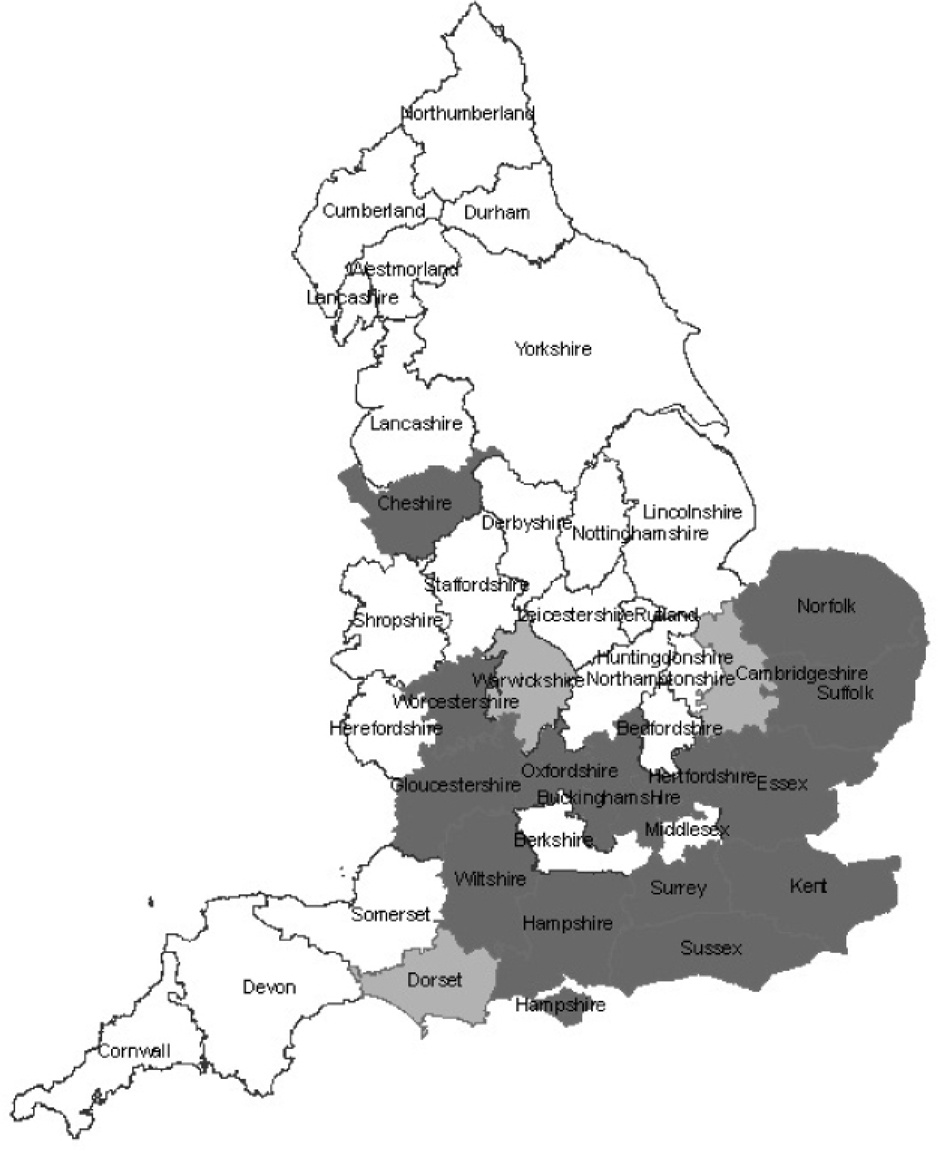
We have thus constructed for a broad range of 17 counties and parts of counties in 1560–1579, representing 33 percent of the population of England, county-level estimates of the shares of probates listing occupations in farming and fishing. The sample includes parts of South London, so it will capture hopefully a representative sample of the effects on occupational shares of the growth of London. Because ecclesiastical jurisdictions crossed county boundaries, in some cases we only have data for part of the county in 1560–1579 (Cambridge, Dorset, Gloucester, Kent, Norfolk, and Warwick). In these cases, we compare the occupation shares in 1560–1579 with the share of the equivalent parishes later. Figure 10 shows the distribution of these counties across England. Where the partial county data was more limited, we expanded the years covered to 1550–1589 to reduce sampling errors earlier.
THE SAMPLE COUNTIES IN ENGLAND, 1560–1579
The farm share estimates for 1560–1579 are shown in Table 4. Column 3 reports the farming share in these counties in 1652–1660. Column 5 shows the same raw estimated farm share for 1560–1579 for these counties, and column 4 the number of observations 1560–1579. There is no shortage of observations on which to make this estimate: 16,771 occupation statements. Based on the raw numbers, the same share of the population was employed in farming in 1560–1579 as in 1652–1660 in the sample counties. The implied national population share in farming would be 59 percent in 1560–1579, the same as in 1652–1660.
As Table 3 shows for these counties, there was little change in the allocation of the probated across occupations between 1560–1579 and 1652–1660. In 1652–1660, 13 percent of the probated were in clothing production and distribution, but the comparative figure in 1560–1579 was already 12 percent. Three percent were in building in both periods. The nonfarm activity that did show a significant increase was food manufacture and distribution, up from 3 percent to 7 percent. There was a rising share across all categories of food manufacture and distribution—bakers, brewers, butchers, grocers, and maltsters—between these two dates. But this was counterbalanced by a declining share of the probated reporting church occupations. An average of 6.5 percent of men report clerical occupations in 1560–1579, nearly double the 3.6 percent clergy for these same counties in 1652–1660. Some of this higher share may reflect occupational realities in the mid-sixteenth century. The extensive holding of religious institutions were seized by the crown only in 1536–1539, with many monks and priests pensioned off, so plausibly a higher fraction of men dying 1560–1579 were indeed clergy. But some may reflect either a higher likelihood of clergy being attributed an occupation in earlier years, when few men had an occupation attributed to them, or a higher likelihood of clergy having wills proved in church courts.
FRACTION FARMING AND FISHING BY COUNTY, 1560–1579

Notes:
a Part of the county, 1550–1589; b Part of the county, 1550–1589; c Excluding Bristol; d East Kent; e Norfolk Deanery; and f Parishes in the Worcester diocese, 1550–1589. The farm share in 1652–1660 is calculated for the same parishes as earlier in all cases.
FARM SHARES, 1560–1579 VERSUS 1652–1660

To control for possible overrepresentation of clergy in the early years, the last column of the table reports for each county in 1560–1579 the share in farming, making the share of clergy in 1560–1579 the same as that for the same county in 1652–1660. In this case, the estimated share in farming in 1560–1579 in the sample counties becomes 66 percent, and the implied national share in farming in 1560–1579 is 61 percent. Thus we can conclude that the national share of employment in farming in 1560–1579 was, at 59–61 percent, little more than in 1652–1660.Footnote 24
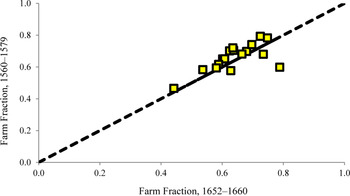
Figure 11 shows the estimated share in farming in counties in 1560–1579 versus the share in 1652–1660. As can be seen, there is a close relationship between the shares in these two periods (the correlation coefficient is 0.7). Also shown is the 45 degree line, where the shares are the same in both periods. Most counties are very close to this line.
Though we lack information on any county in the north other than Cheshire in 1560–1579, this will not likely bias our estimated farm share then, since by 1652–1660 the farm share in the north was still higher than in England as a whole. The north became heavily involved in manufacturing only after 1660.
BIASES IN THE PROBATE ESTIMATED FARM SHARE?
Are there biases in the probate occupation statements that would bias downwards estimated farm employment in 1560 and 1650? Many men in the preindustrial era pursued a variety of occupations, such as weaver and farmer, but the probate statements normally state only one occupation. In a sample of 5,000 wills from Suffolk, Essex, and Surrey pre-1650, 21 percent of farmers, for example, left cattle. But 8 percent of craftsmen—carpenters, smiths, etc.—also left cattle. A significant fraction of craftsmen engaged in some farming on the side. But while this adds noise to estimates of the fraction engaged in farming, but there is no reason to expect that it would bias estimates against farm occupations. For just as craftsmen engaged in some farming, so did early farmers engage also in some construction, manufacturing, service, and trade. Farm households, for example, routinely engaged in the production of homespun cloth, in shoes, and in wooden objects.
Suppose the distribution of the fraction of time spent on farm and nonfarm work across the population was as in Figure 12. The fraction of the population who spend the majority of their time in farming is 0.6, but on either side of that share there are many people who split their time between both sectors. However, if we exactly calculate the share of time that the average person spends in farming, it is also 0.6. The only way in which making the split at the point where people's time switches towards more than 0.5 in agriculture would underestimate the share in farming would be if people who spend most of their time in nonfarming pursuits engaged in more farm activities than the corresponding people who were mainly in farming. There is no evidence this was ever the case.
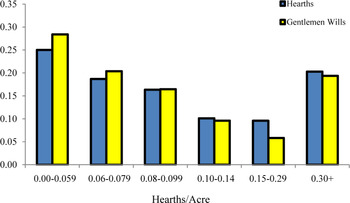
A second issue is the substantial numbers of will makers who instead of an occupation were described as “gentleman” or “esquire.” In Suffolk 1600–1702, for example, 9 percent of men beyond those with a specific occupation are described only by honorifics such as “gentleman” or “esquire.” If these men were really just high-class farmers, then we would underestimate the share in farming. However, if that was the case, then “gentlemen” should appear more frequently per head of the population in the most rural areas. Figure 13 shows the distribution of testators described only as “gentleman” or the like compared with the distribution of hearths by parish hearth density for Suffolk, 1600–1702. The distributions are very similar, with just a slight bias in favor of rural locations. Gentlemen as a group were not just high-status farmers.
THE ESTIMATED SHARE IN FARMING WITH MIXED OCCUPATIONS

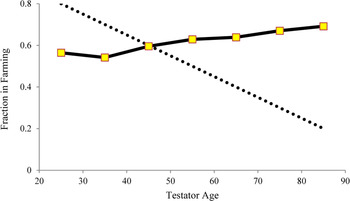
A third issue with probate occupation reports is that they were made at the end of the lives of testators. Before 1700 the average testator had an estimated age at making the will of 53. In contrast, the average worker would be aged about 39 years assuming that everyone aged 15–65 was employed. What if there was a life cycle where men were more likely to be employed in farming when young and in nonfarm occupations when older? In that case, probates overstate the share of the total labor force employed outside farming. Using a large sample of probates assembled from Essex, Suffolk, and Surrey in 1560–1699 we can show, however, that if anything the life-cycle path was for a larger share of men to be employed in farming at older ages.Footnote 25Figure 14 shows the share of testators reporting farming or fishing as occupations as a function of their estimated age at the time of the will. The dotted line shows the expected share on the hypotheses that men began work in farming then moved to nonfarm occupations. As can be seen there instead a modest increase in the share of men reporting farm occupations with age.
DISTRIBUTION OF “GENTLEMEN” VERSUS HEARTHS, SUFFOLK, 1600–1702

The observed pattern of additional older men reporting farm occupations is clearly the product of those in farm occupations living longer on average.Footnote 26 The gain in the farm share, for example, is as much in the years 50–59 to 80+ as it is from ages 20–29 to 50–59. Presumably changes in occupation were much more common for men of working age than for those who would be effectively retired. In that case, the rate of probates relative to those occupied in farming would be lower, all things equal, than the rate in nonfarm occupations. However, we have seen above that the probate rate relative to the farm population is if anything higher in England before 1700 than in the nonfarm population. So even though those engaged in farming lived longer, there is no evidence that probates understate farm occupations because of either life-cycle occupation changing, or differences in average years lived by occupation.
The final issue is the effect of the omission of women. Women were not included in the probates sample, since occupations are rarely recorded, and the most common one recorded “spinster” is ambiguous between being an occupation and a statement about marital status. Could this omission bias the estimated occupational shares against farming? Suppose probates really only describe the occupational split of the male population. In both 1381 and 1841 women tend to be employed significantly less in farming than men.Footnote 27 So in this case the low farm shares observed in 1560–1579 and 1652–1660 would be underestimates. England in the preindustrial period was even less agricultural than the probates would suggest.
AGE AT PROBATE AND SHARE IN FARMING, 1560–1699

Another possibility is that the occupations of male testators, mainly richer men and property owners, serve as an index of the location of economic activity in general. There were the same numbers of workers, both men and women, associated with each of these property owners in the farm and nonfarm sectors. Thus though women are not directly included, the index we use implicitly is counting all workers in each sector. In this case, the distribution of probate occupations will not overstate the farm share in employment. But in both cases, the omission of women will not bias us towards finding too few farm occupations.
CONCLUSION
The apparent contradiction between wage and income estimates for preindustrial England and the urbanization record is resolved once we get detailed information on the economic activity of men in England from probates. These show that a large fraction of rural workers, more than a third, in the years before 1700 were engaged in nonfarm activities. Urbanization is not a good guide to the division of the population between farm and nonfarm employments in preindustrial England. It may fail also in the rest of preindustrial Europe.
The evidence assembled here suggests that in both 1560–1579 and 1652–1660, only about 60 percent of the population in England engaged in farming or fishing. The estimated real income based on modern farm shares would be $2,107 per person in 2007 (in 2005 dollars). This would make England in 1560 richer than at least 25 countries in Africa. It was more than three times as rich as Burundi ($645), and more than twice as rich as Tanzania ($894), Madagascar ($859), and Niger ($824). England then would have an income similar to Uzbekistan, Nicaragua, and Bangladesh in 2007.Footnote 28
Most importantly, the probate evidence developed here supports the idea that real day wages are indeed a good guide to living standards and incomes in the preindustrial world. The estimates in Clark of English national income, made from factor payments, are completely consistent with the share in farming estimated here for 1560–1579 and 1653–1660.Footnote 29 The expected farming shares from the Clark income estimates for 1560–1579 and 1653–1660, are 61 percent and 63 percent, compared to the estimate from the probates of 61 percent and 59 percent. These farm share estimates are in turn inconsistent with alternative estimates of income in England, such as those of Maddison, and of Broadberry et al., which argue for significant preindustrial economic growth.Footnote 30
And the wage evidence elsewhere in Europe is clear. There is little sign from wages of economic growth anywhere in Europe 1400–1800, and indeed a general tendency for living standards to decline. Wage estimates for places as diverse as Flanders, France, Sweden, Italy, and the Ottoman Empire suggest no gains in income 1400–1800, and instead a general decline.Footnote 31
The good fit between day wages and farm occupation shares in England 1560 and 1660 in turn casts doubt on two recently posited revolutions for England in the year 1600–1750, the Consumer Revolution and the Industrious Revolution. The Consumer Revolution is the supposed observance of a rise in household consumption, particularly of new goods, in England in the years 1600–1750, that greatly exceeds any gain in incomes predicted from wages in these years. The Industrious Revolution, an increase in the number of days worked per year as people switched from consumption of leisure to consumption of goods, has been in turn posited as the source of the mysterious income increase implied by the Consumer Revolution. The existence of this pair of revolutions, however, would imply that incomes in 1660, and particularly in 1560, would be significantly lower than would be indicated by day wages. The farm employment share in turn should be significantly higher than day wages would indicate. We do not see this. Incomes in both 1560 and 1660 seem to be in line with those predicted by day wages. There is no evidence from the farm share for either of these supposed revolutions.Footnote 32
Appendix: Assignment of Occupations to Sectors
Farming/Fishing: Brander, Castrator, Dredger, Drover, Farmer, Farrier, Fisher, Fisherman, Gamekeeper, Gardener, Grain Picker, Grazier, Groom, Harvest Man, Hayman, Herdsman, Hop Man, Husbandman, Laborer (outside the most urban parishes), Marshman, Nurseryman, Oyster Dredger, Scavelman, Seedsman, Sheepman, Shepherd, Warner, Warrener, Veterinary Surgeon, Yeoman.
Clothing/Fabrics/Shoes: Bagmaker, Barker, Baymaker, Bed Weaver, Bleacher, Bodice Maker, Braider Embroiderer, Broadcloth Weaver, Button Maker, Capper, Card Maker, Chaloner, Clog Maker, Cloth Maker, Cloth Weaver, Cloth Worker, Clothier, Clothman, Cobbler, Collar Maker, Comb Maker, Comber, Cord Maker, Cord Winder, Cordiner, Cordwainer, Coverlet Maker, Coverlet Weaver, Currier, Dornick Weaver, Draper, Drawer, Dyer, Feather Bed Driver, Fellmonger, Felt Maker, Fuller, Fustian Maker, Fustian Weaver, Glover, Haberdasher, Hair Maker, Hair Weaver, Hatter, Hosier, Leather Currier, Leather Dresser, Leather Worker, Linen Bleacher, Linen Draper, Linen Weaver, Liner, Lining Weaver, Lister, Mercer, Merchant Tailor, Milliner, Milner, Pinner, Point Maker, Poldavis Weaver, Quilt Weaver, Reed Maker, Sackcloth Weaver, Sacking Weaver, Say Maker, Say Scourer, Say Weaver, Say Worker, Sere Maker, Sewing Man, Shearer, Shearman, Shoemaker, Silk Weaver, Skinner, Spindle Maker, Spur Maker, Spurrier, Stapler, Stay Maker, Stuff Weaver, Tailor, Tanner, Twill Weaver, Water Glover, Weaver, Webster, Whitener, Woollen Draper, Wool Chapman, Wool Comber, Wool Man, Woollen Weaver, Wool Stapler, Worsted Weaver, Yarn Man.
Church: Archdeacon, Bachelor of Divinity, Bishop, Canon, Chaplain, Church Clerk, Cleric, Clerk, Curate, Doctor of Divinity, Hermit, Minister, Organist, Parish Clerk, Parson, Pastor, Preacher, Priest, Professor of Divinity, Professor of Theology, Rector, Sexton, Sub-dean, Treasurer of Saint Paul's London, Vicar.
Food/Lodging: Alehouse Keeper, Baker, Beer Brewer, Bocher, Brewer, Bucher, Butcher, Cheese Factor, Cheesemonger, Cook, Corn Merchant, Costermonger, Distiller, Eelmonger, Fishmonger, Gingerbread Maker, Grocer, Inn Holder, Innkeeper, Malt Grinder, Malster, Maltster, Mill Hand, Miller, Oatmeal Maker, Oatmeal Man, Poulterer, Salt Refiner, Salter, Saltfiner, Slaughterman, Spicer, Victualler, Vintner, Viteler, Water Distiller.
Construction/Housing: Architect, Brick Burner, Brick Maker, Brick Layer, Brick Striker, Builder, Carpenter, Carver, Dauber, Freemason, Furbisher, Gilder, Glasswright, Glazier, Hardware Man, House Carpenter, Housewright, Joiner, Lime Burner, Locksmith, Mason, Pailmaker, Painter, Paviour, Pipe Maker, Plasterer, Plumber, Pump Maker, Reed Layer, Reeder, Rough Mason, Sawyer, Stone Mason, Thatcher, Tiler, Timber Man, Timber Master, Timber Merchant, Timber Sawyer, Well Beater, Wright.
Transport: Anchorsmith, Boatman, Boatwright, Carrier, Carter, Cartwright, Coachman, Ferryman, Harness Maker, Keelman, Mariner, Mate, Portman, Saddler, Sail Sewer, Sailmaker, Sailor, Seafarer, Seaman, Ship Carpenter, Shipmaster, Shipwright, Skepmaker, Waterman, Wheeler, Wheelwright.
Metals: Armourer, Bell Founder, Blacksmith, Bladesmith, Copper Smith, Cutler, Edge Tool Smith, Goldsmith, Gun Maker, Gun Smith, Gunlock Maker, Ironmonger, Metalman, Nailman, Pewterer, Silversmith, Smith, Whitesmith, Wire Drawer.
PROBATE SOURCES
The sources of the local probate occupations for each county before 1600:
Buckingham:https://apps2.buckscc.gov.uk/ecommerce/WillsExternal/WillsExternalSearch.aspx.
Cambridge: Evans, “Occupations and Status”; and Serjeant and Serjeant, Index of the Probate Records, 1354–1700.
Cheshire: http://apps.cheshirewestandchester.gov.uk/RecordOfficeWillEpayments/search.aspx.
Dorset: http://history.wiltshire.gov.uk/heritage/index.php.
Essex: http://seax.essexcc.gov.uk/.
Gloucester: http://ww3.gloucestershire.gov.uk/genealogy/Search.aspx.
Hampshire: http://calm.hants.gov.uk/DServe/Advsearch.htm.
Hertfordshire: http://seax.essexcc.gov.uk/, http://www.irishorigins.com/NationalWills/Search/HRT.
Kent: Fry, Calendar of Administrations; and Ridge, Index of Wills and Administrations.
Norfolk: http://nrocat.norfolk.gov.uk/Dserve/public/searches/nroprobate.htm.
Oxford: http://www.irishorigins.com/NationalWills/Search/Oxfordshire.
Suffolk: Serjeant and Serjeant, Index of the Probate Records of the Court of the Archdeaconry of Suffolk, 1444–1700 and Index of the Probate Records of the Court of the Archdeaconry of Sudbury, 1354–1700, http://nrocat.norfolk.gov.uk/Dserve/public/searches/nroprobate.htm.
Surrey: Webb, Surrey Will Abstracts, 1996–2004.
Sussex: Fry, Calendar of Administrations. Hall, Calendar of the Wills and Administrations.
Warwickshire: Fry, Calendar of Wills and Administrations.
Wiltshire: http://history.wiltshire.gov.uk/heritage/index.php.
Worcestershire: Fry, Calendar of Wills and Administrations.
The source of PCC probate occupations in all periods: http://www.nationalarchives.gov.uk/documentsonline/wills.asp
Other online data:
International Labour Organization: http://laborsta.ilo.org/STP/guest
 As y gets smaller, the income elasticity gets bigger, maximizing at 1.