


1. Introduction
Galois representations play a crucial role in different aspects of modern number theory. The main source of Galois representations is the geometric ones, namely the ones obtained by looking at the étale cohomology of varieties. Among varieties, the case of curves is the easiest one. If
 $\mathscr{C}\,$
is a plane curve defined over a global field K, the local L-function of
 $\mathscr{C}\,$
at a prime
 $\mathfrak{p}$
of good reduction (that we denote by
 $L_{\mathfrak{p}}(t)$
) can be computed counting the number of points of
 $\mathscr{C}\,$
over different finite extensions of the residue finite field
 $\mathbb{F}_p$
. Such a counting can be done quite efficiently using, e.g., the method described in [Reference Sutherland15].
Let
 $\ell$
be a prime not dividing the norm of
 $\mathfrak{p}$
and let
 $\rho_{\mathscr{C},\ell}$
denote the
 $\ell$
-adic representation attached to the curve
 $\mathscr{C}\,$
obtained by considering the action of the Galois group
 $\textrm{Gal}(\overline{K}/K)$
on the Tate module of the Jacobian
 $\textrm{Jac}(\mathscr{C}\,)$
. By the Néron–Ogg–Shafarevich criterion, the image of the inertia subgroup is trivial, so the restriction of
 $\rho_{\mathscr{C},\ell}$
to a decomposition group at
 $\mathfrak{p}$
is completely determined by the action of a Frobenius element. Its image corresponds to a semisimple matrix whose characteristic polynomial matches the local L-factor
 $L_{\mathfrak{p}}(t)$
, which can be computed sing the aforementioned algorithm of Sutherland.
However, when
 $\mathscr{C}\,$
has bad reduction at
 $\mathfrak{p}$
, understanding the image of the whole decomposition group at
 $\mathfrak{p}$
or of its inertia subgroup is not so easy. Since the action of the decomposition group
 $D(\mathfrak{p})$
on
 $\mathscr{C}/K$
matches its action on
 $\mathscr{C}/K_{\mathfrak{p}}$
(the completion of K at the prime ideal
 $\mathfrak{p}$
), it is enough to study the case when K is a local field of characteristic p.
Among the bad reduction cases, the so called “semistable” case is the easiest to study, since the image of the inertia subgroup consists of many copies of the two-dimensional Steinberg representation (see Definition 5.1), corresponding to the toric part of the abelian variety
 $\textrm{Jac}(\mathscr{C}\,)$
. The number of copies can be read from the component graph attached to a semistable model of
 $\mathscr{C}$
, as explained in [Reference Bouw and Wewers4] (see also Theorem 5.4). The nonsemistable case is more subtle, and it is hard to provide an algorithm to explicitly describe the image of the decomposition group at
 $\mathfrak{p}$
.
During the last years, a somewhat combinatorial approach was proposed via the use of “clusters” to study minimal models and Galois representations of hyperelliptic curves (see the fundamental article [Reference Dokchitser, Dokchitser, Maistret and Morgan8] and also [Reference Dokchitser6] and [Reference Dokchitser, Dokchitser and Morgan9]). The main purpose of this article is extend their combinatorial algorithm to the superelliptic case.
Let
 $\mathscr{O}$
be a complete discrete valuation ring, let
 $\pi$
be a local uniformizer, let K denote its field of fractions, and let k denote its residue field of characteristic p. Suppose that the n-th roots of unity belong to the field K.
Definition. An n-cyclic or superelliptic curve is a nonsingular curve given by an equation of the form
 \begin{equation} \mathscr{C}\;:\; y^n=\,f(x), \end{equation}
where
 $f(x) \in \mathscr{O}\,[x]$
has no repeated roots (equivalently
 ${Disc}(f(x)) \neq 0$
).
Remark. Sometimes in the literature (like in [Reference Bouw, Koutsianas, Sijsling and Wewers2]) an equation of the form (1.1) over a field not containing the n-th roots of unity is still called superelliptic.
Our main result is a description of the image under
 $\rho_{\mathscr{C},\ell}$
of the inertia subgroup (when
 $\ell \neq p$
) using the weighted cluster description introduced in [Reference Dokchitser, Dokchitser, Maistret and Morgan8], when f(x) has all its roots in K and
 $p \nmid n$
(which is not a semistable situation, but closed to it). Over an abelian extension
 $K_2$
of K (
 $K_2$
can be taken to be
 $K(\sqrt[n]{\pi})$
), the curve admits a stable model. Such a model consists of the union of different connected components
 $\mathcal{Y}_t^{(i)}$
(the notation and an algorithm to compute them are given in Sections 2 and 4). Let
 $\Upsilon$
be the dual graph of the components
 $\{\mathcal{Y}_t^{(i)}\}$
(see Section 5). Then there is an isomorphism of
 $\textrm{Gal}(\overline{K}/K_2)$
-modules
 \begin{equation} V_{\ell}(\textrm{Jac}(\mathscr{C}\,)) \simeq \bigoplus V_{\ell}(\mathcal{Y}_t^{(i)}) \oplus \bigoplus_i \textrm{St}(2) \otimes \chi_i,\end{equation}
where the second sum runs over generators for the first cohomology group of
 $\Upsilon$
,
 $\textrm{St}(2)$
is the Steinberg 2-dimensional representation (see Definition 5.1) and the
 $\chi_i$
are explicit unramified characters (see Proposition 5.2).
The description of the irreducible components
 $\{\mathcal{Y}_t^{(i)}\}$
in the article [Reference Bouw and Wewers4] is given in terms of ordered triples (up to an equivalence relation) of the ramified points of the cover map
 $\mathscr{C} \to \mathbb{P}^1$
(sending
 $(x,y) \to y$
). Our first contribution is to compute the stable model in terms of the so called clusters, a more combinatorial description given in [Reference Dokchitser, Dokchitser, Maistret and Morgan8] for hyperelliptic curves. For that purpose, recall how a stable model of
 $\mathscr{C}\,$
is obtained: start with a stable model
 $\mathscr{X}\,$
of a marked projective line, and compute its normalization
 $\mathscr{Y}\,$
under the natural projection map
 $\mathscr{C} \to \mathbb{P}^1$
. The cluster picture is a powerful combinatorial way to compute the stable model
 $\mathscr{X}$
, as explained in [Reference Dokchitser, Dokchitser, Maistret and Morgan8] (which clearly is independent of the cover and its degree). While recalling the cluster picture construction, we show explicitly how to go from clusters to the triples considered in [Reference Bouw and Wewers4] and vice versa.
The new phenomena appearing in the nonhyperelliptic case (i.e. when
 $n > 2$
) is that the normalization of projective lines might not be irreducible. This very interesting phenomena will be explained in Section 4. Unlike the hyperelliptic case, the irreducible components of the normalization might have positive genus (hence each of them contribute to the first summand of (1.2)). The genus of an irreducible component however can be read from the cluster picture (as described in Proposition 4.3).
Another new problem that arises when the normalization has reducible components consists on describing how the irreducible components intersect between themselves and the action of the Galois group
 $\textrm{Gal}(\overline{K}/K)$
on the intersection points. We provide an answer to both problems, via a nice combinatorial formula in Section 4. Our description not only allows us to describe the component graph of the special fiber of
 $\mathscr{Y}$
, but also to describe the Galois action on the intersection points (and on the connected components graph), providing also an explicit description of the characters appearing in the second part of (1.2).
The aforementioned tools provide an explicit description of
 $V_{\ell}(\textrm{Jac}(\mathscr{C}\,))$
as
 $\textrm{Gal}(\overline{K}/K_2)$
-module. Its structure as
 $\textrm{Gal}(\overline{K}/K)$
-module is a little more subtle. It depends not only on the component graph, but also on the action of the Galois group
 $\textrm{Gal}(K_2/K)$
on each component
 $\mathcal{Y}_t^{(i)}$
. In particular, one needs to incorporate to the decomposition (1.2) twists by ramified characters (corresponding to subextensions of
 $K_2/K$
). Such an extra information can be also encoded in a combinatorial object using the so called weighted clusters (as described in Section 6.1). In Propositions 6.6 and 6.8, we explain how to get a decomposition similar to (1.2) over K.
The article contains different examples aimed to show how the method works and provide a better understanding of the definitions and results. Special emphasis is given to Example 2, which serves as our testing object through different sections.
Notations. Let us introduce the main notations used through the article:
-
K denotes a local field,
 $\mathscr{O}$
denotes its ring of integers,
$\pi$
denotes a local uniformizer of
$\mathscr{O}$
, k denotes its residue field, and v(x) denotes the normalized valuation of K (so that
$v(\pi)=1$
).
-
$K_2 = K[\sqrt[n]{\pi}]$
, an abelian extension of K.
-
The symbol
$\mathscr{R}$
denotes the set of roots of the polynomial f(x). -
S denotes the set of ramified point of our cover
$\mathscr{C} \to \mathbb{P}^1$
, namely it equals
$\mathscr{R} \cup \{\infty\}$
if
$n \nmid \deg\!(f(x))$
and
$\mathscr{R}$
otherwise. The letter D denotes the divisor supported at S, i.e.
$D = \sum_{r \in S}[r]$
. -
T denotes the set of triples of distinct elements of S.
-
$(\mathscr{X},\mathscr{D})$
denotes the stable model of the marked projective line
$(\mathbb{P}^1,D)$
. The letter
$\mathscr{Y}\,$
denotes the normalization of
$\mathscr{X}\,$
in the function field
$K(\mathscr{C}\,)$
.
-
$\overline{X}$
denotes the special fiber of
$\mathscr{X}\,$
and
$\overline{Y}_t^{(\ell)}$
denotes the components of the special fibers of
$\mathscr{Y}$
.


Two strong assumptions of this article are that
 $\mathscr{R} \subset K$
and that
 $p \nmid n$
. Since we are mostly concerned with the image of inertia (and
 $p \nmid n$
), we also assume that
 $\zeta_n \in K$
. In the first sections, we further assume that f(x) is a monic polynomial, in particular
 $f(x) = \prod_{r \in \mathscr{R}}(x-r)$
. The last section explains how to deduce the general case from the monic one (corresponding to a suitable twist).
The recent article [Reference Dokchitser and Dokchitser7] presents a general method to compute the Galois representation
 $V_\ell(\textrm{Jac}(\mathscr{C}\,))$
attached to a curve
 $\mathscr{C}/L$
, without the assumption that f(x) factors linearly over L. The main idea of the method is the following: let K be the field obtained by adding to L the n-th roots of unity together with the roots
 $\mathscr{R}$
of f(x), and let
 $K_2 = K(\sqrt[n]{\pi_K})$
, where
 $\pi_K$
denotes a local uniformizer of K. As explained before, the Galois representation
 $\rho_{\mathscr{C},\ell}$
attached to
 $\textrm{Jac}(\mathscr{C}\,)$
restricted to
 $\textrm{Gal}(\overline{K}/K_2)$
decomposes like
 \begin{equation*}\rho_{\mathscr{C},\ell}|_{\textrm{Gal}(\overline{L}/K_2)} \simeq \bigoplus_j \eta_j \oplus \bigoplus_i \textrm{St}(2)\otimes \chi_i,\end{equation*}
where the characters
 $\eta_j, \chi_i$
are unramified characters. Since the characters
 $\chi_i,\eta_j$
are unramified ones, they can be extended to unramified characters
 $\widetilde{\chi_i},\widetilde{\eta_j}$
of
 $\textrm{Gal}(\overline{K}/L)$
. By Frobenius reciprocity,
 $\rho_{\mathscr{C},\ell}$
is a subrepresentation of (compare with [Reference Dokchitser and Dokchitser7, Theorem 1])
 \begin{equation*}\textrm{Ind}_{\textrm{Gal}(\overline{K}/K_2)} ^{\textrm{Gal}(\overline{K}/L)} \rho_{\mathscr{C},\ell}|_{\textrm{Gal}(\overline{K}/K_2)} \simeq \left(\bigoplus_i \widetilde{\eta_j} \oplus \bigoplus_i \textrm{St}(2)\otimes \widetilde{\chi_i}\right)\otimes \textrm{Ind}_{\textrm{Gal}(\overline{K}/K_2)} ^{\textrm{Gal}(\overline{K}/L)} 1.\end{equation*}
The representation
 $\textrm{Ind}_{\textrm{Gal}(\overline{K}/K_2)} ^{\textrm{Gal}(\overline{K}/L)} 1$
is an Artin representation, whose irreducible components can easily be computed. Which irreducible parts on the right hand side appear in the representation
 $\rho_{\mathscr{C},\ell}$
can be computed via counting the number of points of the semistable model of
 $\mathscr{C}\,$
(that will be described in Section 4) at all unramified subextensions of
 $K_2$
, as explained in [Reference Dokchitser and Dokchitser7, Theorem 1, ii)]. In particular, a combination of our method and their algorithm provides a complete description of the Galois representation attached to an hyperelliptic curve
 $\mathscr{C}\,$
over a local field K when
 $p \nmid n$
.
The article is organized as follows: The first section recalls the description of the stable model
 $(\mathscr{X},\mathscr{D})$
of the marked projective line
 $\mathbb{P}^1$
following the description given in [Reference Bouw and Wewers4]. The second section explains (and proves) its relation with the cluster picture of [Reference Dokchitser, Dokchitser, Maistret and Morgan8]. In particular, we describe explicitly a map from
 $(\mathscr{X},\mathscr{D})$
to proper clusters and prove that it gives a bijection between such sets. A crucial result is Theorem 3.7, which states that under such a map, two components of
 $\mathscr{X}\,$
intersect if and only if the respective clusters are parent/child to each other (a result proven in [Reference Dokchitser, Dokchitser, Maistret and Morgan8]).
Section 4 is devoted to describe the semistable model
 $\mathscr{Y}\,$
over
 $K_2$
. In particular, Proposition 4.1 gives an explicit formula for the number of components over each line of
 $\mathscr{X}\,$
in terms of information that can easily be read from the cluster picture. Proposition 4.3 gives a formula for the genus of each such irreducible component.
As explained before, equation (1.2) implies that our Galois representation is completely determined by the stable model and its graph of components (as expressed more concretely in equation (5.1). In Section 5 (Theorem 5.4), we give a formula for the number of terms in the second sum of (1.2) in terms of the cluster picture and explain how to compute the unramified characters
 $\chi_i$
appearing in (1.2).
In Section 6, we explain how to compute the Galois representation over our base field K. For that purpose, one first needs to understand how a Galois representation attached to a superelliptic curve varies under “twisting”. More concretely, given two superelliptic curves
 \begin{equation*} \mathscr{C}\;:\; y^n =\,f(x),\end{equation*}
and
 \begin{equation*} \mathscr{C}\,'\,:\; y^n = c \cdot f(x),\end{equation*}
how are the Galois representations of
 $\mathscr{C}\,$
and
 $\mathscr{C}\,'$
related?
Answering this question in particular allows to consider general polynomials f(x) (not only monic ones as assumed before), relaxing our starting hypothesis. Although such a problem is well known to experts, we did not find a precise reference to a solution, so we studied it in Section 6.3. For each divisor d of n, there is a contribution to
 $V_\ell(\textrm{Jac}(\mathscr{C}\,))$
from the curves
 \begin{equation*}\mathscr{C}_{n/d}\; :\; y^{n/d} =\,f(x). \end{equation*}
In particular, our module splits as a sum of what might be called the d-new contributions, and it is enough to understand the effect of twisting on them. The main result of Section 6.3 is Proposition 6.6, where the effect of a twist on the d-new part is explained and proved. The key point is to consider
 $V_\ell(\textrm{Jac}(\mathscr{C}\,))^{d\text{-new}}$
as a module not over
 $\mathbb{Z}_\ell$
but over
 $\mathbb{Z}_\ell[\zeta_d]$
.
The
 $\mathbb{Z}[\textrm{Gal}(\overline{K}/K)]$
-module
 $V_\ell(\textrm{Jac}(\mathscr{C}\,))$
admits then a decomposition similar to that of (2.1), after adding some ramified twists. The information regarding the new extra twists can also be encoded into the cluster picture, using what is called a weighted cluster. The purpose of Section 6 is to describe weighted clusters and show how to read the new characters from them (as stated in Proposition 6.8).
2. The minimal stable model
$(\mathscr{X},\mathscr{D})$

Assume that the curve
 $\mathscr{C}\,$
has positive genus (as otherwise the Galois representation is trivial). The method presented in [Reference Bouw and Wewers4] to compute the stable minimal model of
 $\mathscr{C}\,$
is the following: consider the cover
 $p\;:\;\mathscr{C} \to \mathbb{P}^1$
obtained by sending
 $(x,y) \to x$
. Since K contains the n-th roots of unity, this is a cyclic Galois cover of degree n ramified precisely at the points
 \begin{equation*} D = \sum_{r \in \mathscr{R}}[r] + \begin{cases} [\infty] & \text{ if }n \nmid \deg\!(f(x)),\\ 0 & \text{ otherwise.} \end{cases} \end{equation*}
Consider the marked curve
 $(\mathbb{P}^1,D)$
and compute its minimal semistable model
 $(\mathscr{X},\mathscr{D})$
. A semistable model of
 $\mathscr{C}\,$
is then obtained as the normalization
 $\mathscr{Y}\,$
of
 $\mathscr{X}\,$
in the function field of
 $\mathscr{C}$
, i.e.
 $\mathscr{Y}\,$
fits in the following diagram

The stable model
 $(\mathscr{X},\mathscr{D})$
is obtained by gluing open affine lines blown up at a point in the special fiber of
 $\mathbb{P}^1$
(as explained in [Reference Dokchitser, Dokchitser, Maistret and Morgan8, Section 3],[Reference Bouw and Wewers4] and also [Reference Liu13]). Recall the algorithm given in [Reference Bouw and Wewers4] to compute
 $(\mathscr{X},\mathscr{D})$
. Let
 \begin{equation} S = \textrm{Supp}(D) = \mathscr{R} \; \cup \; \begin{cases} \infty & \text{ if } n \nmid \deg\!(f(x)),\\ \emptyset & \text{ otherwise}. \end{cases} \end{equation}
Remark 2.1. The assumption that
 $\mathscr{C}\,$
has positive genus implies in particular that S has at least 3 elements. Otherwise, either f(x) has degree 1 or it has has degree 2 and
 $n=2$
, but in both such cases the curve
 $\mathscr{C}\,$
has genus 0.
Let T denotes the set of triples of distinct elements of S. The coordinate function of
 $t=(a,b,c) \in T$
is defined as
 \begin{equation} \varphi_t(x)=\frac{(b-c)}{(b-a)} \frac{(x-a)}{(x-c)}.\end{equation}
It corresponds to the Möbius transformation sending (a, b, c) to
 $(0,1,\infty)$
. Define an equivalence relation on T by declaring that two elements
 $t_1, t_2 \in T$
are equivalent (denoted
 $t_1 \sim t_2$
) if the map
 $\phi_{t_2}\circ \phi_{t_1}^{-1}$
extends to an automorphism of
 $\mathbb{P}^1_{\mathscr{O}}$
; equivalently, the map
 $\phi_{t_2}\circ \phi_{t_1}^{-1}$
can be represented by a matrix in
 $\textrm{PGL}_2(\mathscr{O}\,)$
.
Lemma 2.2. The equivalence relation satisfies the following properties:
-
(1) The permutation of a triple (a, b, c) is equivalent to (a, b, c).
-
(2) Any triple is equivalent to one with
$v(b-c)= v(a-c) \le v(a-b)$
.

Proof. The first assertion follows from a straightforward matrix computation. For the second one, note that the map from triples of elements to triples of rational numbers given by
 $(a,b,c) \to$
 $(v(b-c),v(a-c),v(a-b))$
is
 $S_3$
invariant, hence we can assume
 $v(b-c) \le v(a-c) \le v(a-b)$
. But
 $a-b = (a-c) + (c-b)$
hence
 \begin{equation*} v(a-b) \ge \min\{v(a-c),v(b-c)\}=v(b-c) \end{equation*}
with equality if both values are different. Then the assumption
 $v(b-c) \le v(a-c) \le v(b-c)$
implies that
 $v(a-c) = v(b-c)$
.
Definition 2.3. An ordered triple is a triple (a, b, c) with
 $v(a-c) = v(b-c) \le v(a-b)$
.
If (a, b, c) is an ordered triple, define its radius to be
 $\mu = v(a-b)$
.
Proposition 2.4. Let (a, b, c) be an ordered triple.
-
(1) If
$\infty \in S$
then any ordered triple (a, b, c) is equivalent to the ordered triple
$(a,b,\infty)$
. -
(2) The radius
$\mu$
depends only on the equivalent class of the triple. -
(3) The ordered triple (a, b, c) is equivalent to the ordered triple
$(\alpha,\beta,\gamma)$
, if and only if the following two properties hold:


-
they have the same invariant, i.e.
$\mu = v(a-b) = v(\alpha-\beta)$
, -
$a \equiv b \equiv \alpha \equiv \beta\!\! \pmod{\pi^\mu}$
.


Proof. By the equivalence relation definition, an ordered triple
 $T_1=(a,b,\infty)$
is equivalent to a triple
 $T_2=(a, b, c)$
(with
 $c \neq \infty$
) if and only if
 $\lambda_2 \circ \lambda_1^{-1}$
extends to an automorphism of
 $\mathbb{P}^1_{\mathscr{O}}$
, where
 $\lambda_i$
is the Möbius transformation sending the triple
 $T_i$
to the triple
 $(0,1,\infty)$
. Such maps are explicitly given by
 \begin{equation*} \lambda_1(x) = \begin{pmatrix} 1 & & & -a \\[4pt] 0 & & & b-a \end{pmatrix}\cdot \begin{pmatrix} x \\[4pt] 1\end{pmatrix}, \qquad \lambda_2(x) = \begin{pmatrix} (b-c) & & & -a(b-c)\\[4pt] (b-a) & & & -c(b-a)\end{pmatrix} \cdot \begin{pmatrix} x\\[4pt] 1\end{pmatrix}, \end{equation*}
where
 $\left(\begin{smallmatrix} a & b\\ c & d\end{smallmatrix}\right) \cdot \left( \begin{smallmatrix} x \\ 1\end{smallmatrix}\right) = \frac{ax+b}{cx+d}$
. Then, the Möbius matrix attached to the composition
 $\lambda_2 \circ \lambda_1^{-1}$
equals
 \begin{equation*}[\lambda_2 \circ \lambda_1^{-1}] = \left( \begin{array}{cccc}c &&& -ab\\[4pt] 1 &&& c-a-b \end{array} \right).\end{equation*}
The matrix has integral entries, and its determinant equals
 $(a-c)(b-c)$
, whose valuation is even (since
 $v(a-c) = v(b-c)$
) so it corresponds to an element in
 $\textrm{PGL}_2(\mathscr{O}\,)$
. In particular, both triples are indeed equivalent.
To prove equivalence of ordered triples (a, b, c),
 $(\alpha, \beta, \gamma)$
, since we can add
 $\infty$
to the set, it is enough to restrict to the case
 $(a,b,\infty)$
and
 $(\alpha,\beta,\infty)$
. It is easy to check that the transformation sending one triple to the other one is given by the matrix
 \begin{equation*}M=\left( \begin{array}{cccc}(a-b)&&& (\alpha-a)\\[4pt] 0 && & (\alpha-\beta) \end{array} \right). \end{equation*}
For a multiple of M to lie in
 $\textrm{GL}_2(\mathscr{O}\,)$
, it must happen that
 $v(a-b) = v(\alpha-\beta)$
, hence the two triples have the same radius, as stated. At last, under such assumption, the two triples are equivalent if and only if
 $v(a{-}\alpha) \ge \mu$
(the radius of the triples). Recall that
 $\mu = v(a-b)$
, so
 $a \equiv b\!\! \pmod{\pi^\mu}$
and the same holds for
 $\alpha$
and
 $\beta$
, as stated.
The semistable model
 $\mathscr{X}\,$
consists of one component (a projective line) for each equivalence class of T.
Definition 2.5. A special point is either an element of S or a singular point where two components of
 $\mathscr{X}\,$
intersect.
The special fiber
 $\bar{X}$
of
 $\mathscr{X}\,$
is a tree of projective lines where each component contains at least 3 special points. For each
 $t \in T$
, the map
 $\varphi_t$
extends to a proper
 $\mathscr{O}$
-morphism
 $\varphi_t\;:\;\mathscr{X} \to \mathbb{P}^1_{\mathscr{O}}$
, whose reduction (denoted
 $\overline{\varphi_t}$
) is a contraction morphism with contracts all but one component of
 $\bar{X}$
to a closed point (see [Reference Bouw and Wewers4, Proposition 4.2]). Furthermore, if
 $r \in \mathscr{R}$
then
 $\overline{\varphi_t}(r) = \overline{\varphi_t(r)}$
. Extend the valuation v on
 $\mathscr{O}$
by setting
 $v(\infty) = -\infty$
.
Remark 2.6. Given a cyclic curve
 $\mathscr{C}\;:\; y^n =\,f(x)$
, there are many transformations that preserve the model (for example translation). The combinatory behind the computation of a stable model of
 $\mathbb{P}^1$
attached to the roots of p(x) depends on the particular equation. However, the information obtained from it (number of components, discriminant, etc) does not.
Example 1. Let p be an odd prime number congruent to 1 modulo 3 (so the 6-th roots of unity belong to
 $\mathbb{Q}_p$
). Let
 $\mathscr{C}/\mathbb{Q}_p$
be the superelliptic curve given by the equation
 \begin{equation*} \mathscr{C}\;: \; y^6 \!= x(x-p^2)(x-p)(x-p-p^2)(x-2p)(x-2p-p^2)(x-1)(x-1-p)(x-1-2p). \end{equation*}
The set of roots equals
 $\mathscr{R} = \lbrace 0, p^2, p, p+p^2, 2p, 2p+p^2, 1, 1+p, 1+2p \rbrace$
and
 $S = \mathscr{R} \cup \lbrace \infty \rbrace$
(since
 $6 \nmid \textrm{deg}(\,f) )$
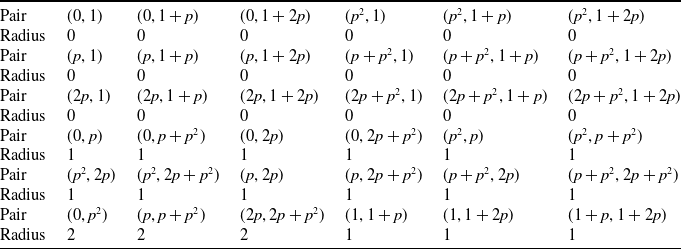
. By Proposition 1.4, any ordered triple (a, b, c) is equivalent to the ordered triple
 $(a,b,\infty)$
, and there are 36 such triples. The radii are given in Table 1.
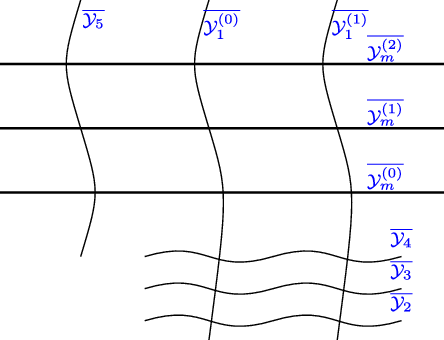
By Proposition 1.4 (3), all elements in the first three rows are equivalent, all elements in fourth and fifth rows are equivalent, the three first elements of the last row are not equivalent, and the last three elements in the last row are equivalent, hence there are six equivalent classes. The ordered triples and the charts can be taken to be:
Ordered triples and radii for Example 1.

-
$t_0=(0,1, \infty), \; \varphi_0(x)= x$
-
$t_1=(0, p, \infty),\; \varphi_1(x)= \frac{x}{p}$
-
$t_2=(0, p^2, \infty), \; \varphi_2(x)= \frac{x}{p^2}$
-
$t_3=(p, p+p^2, \infty), \; \varphi_3(x)= \frac{x-p}{p^2}$
-
$t_4=(2p, 2p+p^2, \infty), \; \varphi_4(x)= \frac{x-2p}{p^2}$
-
$t_5=(1, 1+p, \infty), \; \varphi_4(x)= \frac{x-1}{p}$


Then the special fiber of
 $\mathscr{X}\,$
looks like Figure 1.
Special fiber of
 $\mathscr{X}$
.

3. Clusters and their relation with
$(\mathscr{X},\mathscr{D})$

Clusters were defined in [Reference Dokchitser, Dokchitser, Maistret and Morgan8] to study hyperelliptic curves. We strongly recommend the reader to take a look at such article as well as the expository article [Reference Best, Alexander Betts, Bisatt, van Bommel, Dokchitser, Faraggi, Kunzweiler, Maistret, Morgan, Muselli and Nowell1] since we follow closely their definitions and notations.
Definition 3.1. A cluster s is a nonempty subset of
 $\mathscr{R}$
of the form
 $\mathfrak{s} = D(z,d)\cap \mathscr{R}$
, for some disc
 $D(z,d)=\{x \in \overline{K} \; : \; v(x-z) \ge d\}$
where
 $z \in \overline{K}$
and
 $d \in \mathbb{Q}$
. A proper cluster is a cluster with more than one element.
Let
 $\textrm{Cl}(\mathscr{R})$
denote the set of proper clusters of
 $\mathscr{R}$
. For a cluster
 $\mathfrak{s}$
, let
 $|\mathfrak{s}|$
denote the number of elements of
 $\mathscr{R}$
contained in
 $\mathfrak{s}$
.
Lemma 3.2. Given
 $\mathfrak{s}_1,\mathfrak{s}_2$
clusters, then either they are disjoint or one is contained in the other.
Proof. The result follows from the fact that in the ultrametric world, any point belonging to a ball can be taken to be its center (see [Reference Dokchitser, Dokchitser, Maistret and Morgan8, Section 1.5]).
Definition 3.3. If
 $\mathfrak{s}, \mathfrak{s}'$
are clusters with
 $\mathfrak{s}' \subsetneq \mathfrak{s}$
a maximal subcluster, we write
 $\mathfrak{s}' < \mathfrak{s}$
and refer to
 $\mathfrak{s}'$
as a child of
 $\mathfrak{s}$
and
 $\mathfrak{s}$
as a parent of
 $\mathfrak{s}'$
.
The diameter of a proper cluster
 $\mathfrak{s}$
is given by
 $\mu(\mathfrak{s}) = \min\{v(z-t) \; : \; z,t \in \mathfrak{s}\}$
(note that in [Reference Dokchitser, Dokchitser, Maistret and Morgan8] the authors use the term depth for such invariant).
Lemma 3.4. Let
 $\mathfrak{s}$
be a proper cluster, and let
 $a,b \in \mathfrak{s}$
two elements satisfying that
 $v(a-b) = \mu(\mathfrak{s})$
. Then
 $\mathfrak{s} = D(a,{\mu(\mathfrak{s})}) \cap \mathscr{R}$
.
Proof. Clearly,
 $v(a-b) \ge \mu(\mathfrak{s})$
for all
 $b \in \mathfrak{s}$
, hence
 $\mathfrak{s} \subset D(a,{\mu(\mathfrak{s})}) \cap \mathscr{R}$
. For the other inclusion, by definition
 $s = D(\alpha,d) \cap \mathscr{R}$
, for some
 $\alpha$
and d. Since
 $a \in \mathfrak{s}$
,
 $a \in D(\alpha,d)$
, we can take it as the ball center, so
 $\mathfrak{s} = D(a,d) \cap \mathscr{R}$
. But
 $\mu(\mathfrak{s})$
is the minimal valuation between elements in s hence
 $d \ge \mu(\mathfrak{s})$
and
 $D(a,\mu(\mathfrak{s})) \cap \mathscr{R} \subset \mathfrak{s}$
.
Definition 3.5. The maximal cluster is the cluster containing all other clusters and all elements of
 $\mathscr{R}$
. We denote it by
 $\mathfrak{s}_{\text{max}}$
.
Let (a, b, c) be an ordered triple in T, and let
 $\mu = v(a-b)$
be its invariant. Define a map
 $\Phi\;:\; T \to \textrm{Cl}(\mathscr{R})$
by
 \begin{equation} \Phi((a,b,c)) = D_{\mu}(a) \cap \mathscr{R}. \end{equation}
Theorem 3.6. The map
 $\Phi$
gives a well-defined map between equivalence classes of T and the set of clusters of
 $\mathscr{R}$
. Furthermore, the map
 $\Phi$
satisfies the following properties:
-
(1) It is injective.
-
(2) The set
$\textrm{Cl}(\mathscr{R}) \setminus \{\mathfrak{s}_{\text{max}}\} \subset \textrm{Im}(\Phi)$
. -
(3) The cluster
$\mathfrak{s}_{\text{max}}$
lies in the image of
$\Phi$
if either one of the following properties hold:-
i. The element
$\infty \in S$
, -
ii. there are three different elements
$a,b,c \in \mathscr{R}$
satisfying (equivalently,
\begin{equation*}\mu(\mathfrak{s}_{\text{max}}) = v(a-b) = v(b-c) = v(a-c)\end{equation*}
$\mathfrak{s}_{\text{max}}$
has more than two childs).
-


Proof. To prove that
 $\Phi$
gives a well-defined map on classes, we need to prove that if
 $t_1=(a,b,c)$
and
 $t_2=(\alpha,\beta,\gamma)$
are equivalent ordered triples of T then
 $\Phi(t_1) = \Phi(t_2)$
. By Proposition 2.4, the condition
 $t_1 \sim t_2$
implies that
 $\mu =v(a-b) =v(\alpha-\beta)$
and
 $a \equiv b \equiv \alpha \equiv \beta \mod \pi^\mu$
. Then
 $\alpha \in D_{\mu}(a)$
, so
 $D_{\mu}(a) = D_{\mu}(\alpha)$
and
 $\Phi(t_1) = \Phi(t_2)$
.
-
(1) Injectivity: let
$t_1 = (a,b,c)$
and
$t_2 = (\alpha,\beta,\gamma)$
be two ordered triples such that
$\Phi(t_1) = \Phi(t_2)$
. Note that (3.2)Then we can recover the invariant
\begin{equation} v(a-b) = \mu(\Phi(t_1))=\min\{v(z-t) \; : \; z,t \in \Phi(t_1)\}. \end{equation}
$\mu$
of the triple
$t_1$
as the diameter of
$\Phi(t_1)$
. Since
$\Phi(t_1) = \Phi(t_2)$
, the
$\mu$
invariant of
$t_2$
equals that of
$t_1$
. On the other hand, since
$\Phi(t_1) = \Phi(t_2)$
,
$\{\alpha,\beta\} \subset \Phi(t_2)$
so
$a \equiv b \equiv \alpha \equiv \beta\!\! \pmod{\pi^\mu}$
and
$t_1 \sim t_2$
by Proposition 2.4.
-
(2) Let
$\mathfrak{s} \in \textrm{Cl}(\mathscr{R})$
be a proper cluster which is not maximal. Let
$a,b \in \mathfrak{s}$
be a pair such that
$v(a-b) = \mu(s)$
. Clearly
$\mathfrak{s} = D_{\mu}(a) \cap \mathscr{R}$
. Since
$\mathfrak{s}$
is not maximal, let c be any element not in
$\mathfrak{s}$
. Then
$\mathfrak{s} = \Phi(a,b,c)$
. -
(3) As before, given
$\mathfrak{s}_{\text{max}}$
, let
$a,b \in \mathfrak{s}_{\text{max}}$
be a pair such that
$v(a-b) = \mu(\mathfrak{s}_{\text{max}})$
.-
i. If
$\infty \in S$
, then
$\mathfrak{s}_{\text{max}} = \Phi(a,b,\infty)$
. -
ii. If there exists
$a,b,c \in \mathfrak{s}_{\text{max}}$
with
$v(a-b)=v(a-c)=v(b-c)$
then
$\mathfrak{s}_{\text{max}} = \Phi(a,b,c)$
.
Finally, if
$\mathfrak{s}_{\text{max}}$
has precisely two childs, we need to prove it does not lie in the image. Let
$\mathfrak{s}_1$
and
$\mathfrak{s}_2$
be the maximal subclusters. Any triple (a, b, c) satisfies (without loss of generality) that two elements lie in
$\mathfrak{s}_1$
and the other in
$\mathfrak{s}_2$
or the three of them lie in
$\mathfrak{s}_1$
. In both cases, it is easy to check that
$\Phi(a,b,c) \subset \mathfrak{s}_1$
, hence
$\mathfrak{s}_{\text{max}}$
is not in the image. -


Example 2. The case when
 $\mathfrak{s}_{\text{max}}$
is not in the image of
 $\Phi$
corresponds to a model
 $(\mathscr{X},\mathscr{D})$
with precisely two lines intersecting in a single point. For example, if
 $p>3$
is a prime number, then the curve with equation:
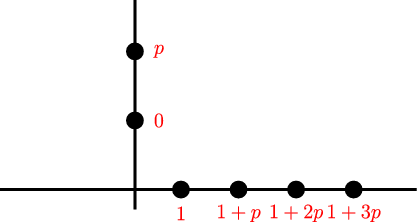
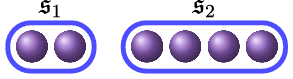
 \begin{equation*}\mathscr{C}\;:\; y^6 = x(x-p)(x-1)(x-1+p)(x-1+2p)(x-1+3p),\end{equation*}
satisfies that
 $\mathfrak{s}_{\text{max}}$
is not in the image of
 $\Phi$
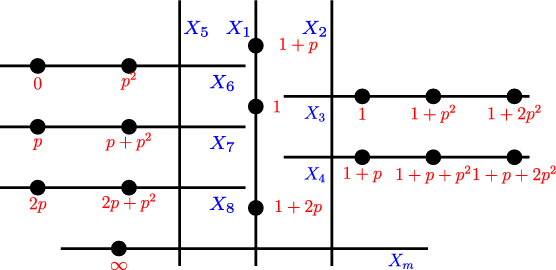
. In Figure 2, we give the special fiber of the model
 $(\mathscr{X},\mathscr{D})$
and in Figure 3 its cluster picture.
Special fiber of
 $\mathscr{X}$
.

Attached clusters.

As stated in Section 2, the connected components of
 $\mathscr{X}\,$
correspond to elements in
 $T/\sim$
; hence to get a complete description of
 $\mathscr{X}$
, we need to understand how the components intersect with each other and how the points of S distribute between the components. Representing elements as clusters gives the natural answer, namely in general two components will intersect precisely when the cluster attached to one of them is a child of the other. More concretely,
Theorem 3.7. The components attached to clusters
 $\mathfrak{s}_1,\mathfrak{s}_2$
in the image of
 $\Phi$
intersect if and only if one of the following holds:
-
(1)
$\mathfrak{s}_1$
is a maximal subcluster of
$\mathfrak{s}_2$
or vice-versa, or -
(2)
$\mathfrak{s}_1 \cap \mathfrak{s}_2 = \emptyset$
and both
$\mathfrak{s}_1, \mathfrak{s}_2$
are maximal clusters in the image of
$\Phi$
.


The second case corresponds precisely to the case explained in Example 3. The statement is implicit in [Reference Dokchitser, Dokchitser, Maistret and Morgan8] (see Section 5 and Theorem 1.10) as well as in [Reference Bouw and Wewers4], but we present a different proof which depends on understanding special points on clusters and how the coordinate functions evaluate at them.
Definition 3.8. Let
 $\mathfrak{s} \in \textrm{Cl}(\mathscr{R})$
. A point of
 $\mathfrak{s}$
is one of the following:
-
a child of
$\mathfrak{s}$
(i.e. maximal subclusters of
$\mathfrak{s}$
), -
a parent of
$\mathfrak{s}$
(i.e. a minimal supercluster of
$\mathfrak{s}$
), -
If
$\infty \in S$
, one point (denoted
$\infty$
) in
$\mathfrak{s}_{\text{max}}$
. -
If
$\mathfrak{s}_{\text{max}} \not \in \textrm{Im}(\Phi)$
one extra point in each maximal cluster of
$\textrm{Im}(\Phi)$
(corresponding to the intersection point of the two components, see Example 3).


Note that we did not ask the clusters to be proper while defining points. In particular, any element of S is a point in some cluster. The component graph of the special fiber
 $\bar{X}$
of
 $\mathscr{X}\,$
is a stably marked tree (see Section 4.2 of [Reference Bouw and Wewers4]) so each cluster contains at least 3 points. Let
 $\mathcal{P}$
be the disjoint union of points in proper clusters
 $\mathfrak{s} \in \textrm{Cl}(\mathscr{R})$
, i.e.
 \begin{equation*}\mathcal{P} = \bigsqcup_{\mathfrak{s} \in \textrm{Cl}(\mathscr{R})} \{\text{points in }\mathfrak{s}\}.\end{equation*}
Note that the set
 $\mathscr{R} \subset \mathcal{P}$
.
Remark 3.9. If
 $\mathfrak{s}$
is a nonmaximal cluster and
 $t=(a,b,c) \in T$
is an ordered triple mapping to
 $\mathfrak{s}$
under
 $\Phi$
, we can assume that its last coordinate c does not belong to
 $\mathfrak{s}$
. Otherwise, changing c by any element not belonging to
 $\mathfrak{s}$
(which exists since
 $\mathfrak{s}$
is non-maximal) gives an equivalent triple.
To simplify proofs, from now on we will assume that if
 $\Phi(a,b,c) = \mathfrak{s}$
, a nonmaximal cluster, then
 $c \not \in \mathfrak{s}$
. Furthermore, if
 $\infty \in S$
, we also assume that
 $c = \infty$
.
Lemma 3.10. Let
 $t \in T$
, and
 $x_1,x_2 \in \mathscr{R}$
be roots. Let
 $\mathfrak{s} = \Phi(t)$
be the associate cluster. Then the coordinate function
 $\varphi_t$
satisfies:
-
(1) if there exists a proper subcluster
$\tilde{\mathfrak{s}} \subsetneq \mathfrak{s}$
such that
$x_1, x_2 \in \tilde{\mathfrak{s}}$
then
$\overline{\varphi_t(x_1)}=\overline{\varphi_t(x_2)}$
. -
(2) if
$x_1, x_2 \in \mathfrak{s}$
but they do not lie in a common maximal subcluster then
$\overline{\varphi_t(x_1)}\neq \overline{\varphi_t(x_2)}$
. -
(3) if
$x_1 \not \in \mathfrak{s}$
then
$\overline{\varphi_t(x_1)}=\infty$
.


Proof. Let
 $t=(a,b,c)$
, and consider first the case when
 $\Phi(t)$
is not the maximal cluster (hence
 $c \not \in \mathfrak{s}$
). By definition,
 \begin{equation} \varphi_t(x_1)-\varphi_t(x_2) = \frac{(b-c)}{(b-a)}\frac{(x_1-x_2)(a-c)}{(x_1-c)(x_2-c)}. \end{equation}
-
(1) Let
$x_1,x_2 \in \tilde{\mathfrak{s}}$
. Recall that the valuation of the difference between one element of
$\mathscr{R}$
in
$\mathfrak{s}$
and one element of
$\mathscr{R}$
outside
$\mathfrak{s}$
is constant, then since
$c \not \in \mathfrak{s}$
,
$v(b-c) = v(c-a)=v(x_1-c)=v(x_2-c)$
. The hypothesis that
$x_1,x_2$
lie in a proper subcluster implies that
$v(x_1-x_2) > v(a-b) = \mu(\Phi(t))$
so the right hand side of (3.3) is divisible by
$\pi$
and hence
$\varphi_t(x_1)\equiv \varphi_t(x_2) \pmod \pi$
. -
(2) If
$x_1$
and
$x_2$
do not lie in a proper subcluster, then
$v(x_1-x_2) = v(a-b)$
, hence the right hand side of (3.3) is a unit, hence
$\varphi_t(x_1) \not \equiv \varphi_t(x_2) \pmod{\pi}$
. -
(3) If
$x_1 \not \in \mathfrak{s}$
,
$\varphi_t(x_1)=\frac{(b-c)}{(b-a)} \frac{(x_1-a)}{(x_1-c)}$
. The nonarquimedean triangle inequality implies that
$v(x_1-c) = \min \{v(x_1-a), v(b-c)\}$
(recall that
$v(a-c) = v(b-c)$
). On the other hand, since (a, b, c) is an ordered triple,
$v(b-a)$
is the cluster’s diameter. The hypothesis
$x_1, c \not \in \mathfrak{s}$
imply that
$v(b-a) > \max\{v(b-c),v(x_1-a)\}$
. Then
$v(x_1-c)v(b-a) > v(x_1-a)v(b-c)$
and consequently
$\overline{\varphi_t(x_1)} = \infty$
.


Assume on the contrary that
 $\Phi(t)$
is the maximal cluster, hence
 $v(b-c)=v(a-b)=v(a-c)$
. Distinguish two cases depending on whether
 $x_1,x_2,c$
belong to a common proper subcluster or not. In the first case,
 $v(x_i-c) > v(x_i-a)$
for
 $i=1,2$
since
 $x_i$
lies in the same subcluster as c. In particular,
 \begin{equation*}v\left(\frac{(b-c)(x_i-a)}{(b-a)(x_i-c)}\right) = v\left(\frac{(b-c)}{(b-a)}\right) + v\left(\frac{(x_i-a)}{(x_i-c)}\right) \le v\left(\frac{(x_i-a)}{(x_i-c)}\right) < 0, \end{equation*}
hence
 $\overline{\varphi_t(x_i)}=\infty$
. In particular, if
 $x_1,x_2$
lie in a common proper subcluster,
 $\overline{\varphi_t(x_1)}= \overline{\varphi_t(x_2)}$
.
In the second case, if
 $x_1$
is not in the same proper subcluster as c,
 $v(x_1-c) \le v(x_1-a)$
hence
 $\overline{\varphi_t(x_1)} \neq \infty$
. If
 $x_1,x_2$
are two roots not in the same proper subcluster as c,
 $v(b-c) =v(c-a)=v(b-a)=v(x_1-c)=v(x_2-c)$
and the same proof as before applies.
3.1. Functions on clusters
If
 $\mathfrak{s} \in \textrm{Cl}(\mathscr{R})$
lies in the image of
 $\Phi$
, define a function
 $\varphi_{\mathfrak{s}}\; : \;\mathcal{P} \to \mathbb{P}^1$
extending the coordinate function
 $\varphi_t$
to
 $\mathcal{P}$
as follows.
Definition 3.11. Let
 $\mathfrak{s} \in \textrm{Cl}(\mathscr{R})$
be in the image of
 $\Phi$
, say
 $\mathfrak{s} = \Phi(t)$
, and let
 $p \in \mathcal{P}$
be a point, so p is a point of some cluster
 $\tilde{\mathfrak{s}} \in \textrm{Cl}(\mathscr{R})$
. In particular, p is either a root (i.e. an element of
 $\mathscr{R})$
or
 $p = \mathfrak{s}'$
a parent/child of
 $\tilde{s}$
. Define
 \begin{equation*} \overline{\varphi_{\mathfrak{s}}}(p) = \begin{cases} \overline{\varphi_t}(\alpha) & \text{ if }p=\alpha \in \mathscr{R}\text{ and }\alpha \in \mathfrak{s},\\ \overline{\varphi_t}(a) & \text{ if } \mathfrak{s}'= \Phi((a,b,c)) \subset \mathfrak{s},\\\infty & \text{ otherwise}.\end{cases} \end{equation*}
Remark 3.12. If
 $\infty \in S$
, the point
 $\infty \in \mathfrak{s}_{\text{max}}$
evaluates to
 $\infty$
at all functions
 $\overline{\varphi_s}$
. This is clear for the function
 $\overline{\varphi_{\mathfrak{s}}}$
when
 $\mathfrak{s}$
is not the maximal cluster, and for the maximal cluster it follows from the assumption
 $c=\infty$
of the ordered triple attached to it.
Lemma 3.13. Let
 $\mathfrak{s} \in \textrm{Cl}(\mathscr{R})$
be an element in the image of
 $\Phi$
.
-
If
$\mathfrak{s}' \in \textrm{Cl}(\mathscr{R})$
is a cluster not contained in
$\mathfrak{s}$
, the map
$\varphi_{\mathfrak{s}}$
takes the same value at all points of
$\mathfrak{s}'$
. -
If
$\mathfrak{s}_1, \mathfrak{s}_2$
are two different childs of
$\mathfrak{s}$
, then
$\varphi_{\mathfrak{s}}$
takes different values at points of
$\mathfrak{s}_1$
and of
$\mathfrak{s}_2$
.


Proof. The statements follow easily from Lemma 3.10.
Suppose that
 $p, q \in \mathcal{P}$
with
 $p \in \mathfrak{s}$
and
 $q \in \mathfrak{s}'$
satisfy one of the following hypothesis:
-
$\mathfrak{s}= \mathfrak{s}'$
and
$p=q$
,
-
$\mathfrak{s}$
is a child/parent of
$\mathfrak{s}'$
,
-
$\mathfrak{s}_{\text{max}}$
is not in the image of
$\Phi$
, in which case we identify the extra points of the two maximal proper clusters of
$\textrm{Im}(\Phi)$
(see Example 3).


Then Lemma 3.13 implies that
 $\overline{\varphi_{\mathfrak{s}}}(p) = \overline{\varphi_{\mathfrak{s}}}(q)$
. In particular, all coordinate functions do not distinguish them (which explains why they are identified in the model
 $\mathscr{X}$
). By definition, the function attached to a cluster
 $\mathfrak{s} = \Phi(t)$
equals the one attached to t hence they share the same properties; for example,
 $\overline{\varphi_{\mathfrak{s}}}$
contracts all components different from t to points (see [Reference Bouw and Wewers4, Proposition 4.2]). We extend the function
 $\overline{\varphi_{\mathfrak{s}}}$
to clusters defining
 \begin{equation} \overline{\varphi_{\mathfrak{s}}}(\mathfrak{s}')= \begin{cases} \infty & \text{ if } s \subset \mathfrak{s}',\\ \overline{\varphi_{\mathfrak{s}}}(p) & \text{ otherwise } \end{cases} \end{equation}
Proposition 3.14. Let
 $X_{1}, X_{2}$
be two components of
 $\mathscr{X}$
. Then they do not intersect if and only if there exists a component
 $X_t$
whose coordinate function
 $\overline{\varphi_t}$
collapses
 $X_1$
and
 $X_2$
to two different points.
Proof. If
 $X_1$
and
 $X_2$
do not intersect, then since
 $\mathscr{X}\,$
is connected, there exists a component
 $X_t$
in the path connecting them which is not equal to
 $X_1$
nor
 $X_2$
. Then
 $\overline{\varphi_t}$
collapses
 $X_1$
to one point in
 $\mathbb{P}^1(\overline{\mathbb{F}_p})$
and
 $X_2$
to a different one.
We can now give a proof of how the components intersect.
Proof of Theorem 3.7. By Proposition 3.14, the clusters
 $\mathfrak{s}_i=\Phi(t_i)$
do not intersect if and only if there exists
 $t_3$
such that
 $\overline{\varphi_{t_3}}$
takes different values at
 $\mathfrak{s}_1$
and
 $\mathfrak{s}_2$
. Distinguish the following cases:
-
Suppose that
$\mathfrak{s}_1 \cap \mathfrak{s}_2 = \emptyset$
and they are maximal clusters in the image of
$\Phi$
(so
$\mathfrak{s}_{\text{max}}$
does not belong to the image of
$\Phi$
). In particular, if
$\mathfrak{s}_3$
is any other subcluster,
$\mathfrak{s}_3 \subset \mathfrak{s}_1$
or
$\mathfrak{s}_3 \subset \mathfrak{s}_2$
by Theorem 3.6. Then from (3.4),
$\overline{\varphi_{\mathfrak{s}_3}}(\mathfrak{s}_1)=\infty$
in the first case and
$\overline{\varphi_{\mathfrak{s}_3}}(\mathfrak{s}_2)=\infty$
in the second one. Then Proposition 3.14 implies that
$\mathfrak{s}_1$
and
$\mathfrak{s}_2$
do intersect. -
Suppose that
$\mathfrak{s}_1 \cap \mathfrak{s}_2 = \emptyset$
and
$\mathfrak{s}_1, \mathfrak{s}_2$
are subclusters of a cluster
$\tilde{s}$
in the image of
$\Phi$
. Without loss of generality, we can assume that
$\tilde{s}$
is the minimal cluster containing both
$\mathfrak{s}_1$
and
$\mathfrak{s}_2$
. Then the cluster
$\tilde{s}$
contains two childs
$\widetilde{\mathfrak{s}_1}$
and
$\widetilde{\mathfrak{s}_2}$
such that
$\mathfrak{s}_i \subset \widetilde{\mathfrak{s}_i}$
for
$i=1,2$
. By Lemma 3.13, the function
$\overline{\varphi_{\tilde{\mathfrak{s}}}}$
takes different values at
$\widetilde{\mathfrak{s}_1}$
and
$\widetilde{\mathfrak{s}_2}$
, and by Lemma 3.10
$\overline{\varphi_{\tilde{\mathfrak{s}}}}(\widetilde{s_i})= \overline{\varphi_{\tilde{\mathfrak{s}}}}(s_i)$
, so
$\overline{\varphi_{\tilde{\mathfrak{s}}}}$
takes different values at
$\mathfrak{s}_1$
and
$\mathfrak{s}_2$
and the two components do not intersect. -
Suppose that
$\mathfrak{s}_1$
is a subcluster of
$\mathfrak{s}_2$
which is not maximal. Then there exists a subcluster
$\mathfrak{s}_3$
such that
$\mathfrak{s}_1 \subsetneq \mathfrak{s}_3 \subsetneq \mathfrak{s}_2$
. Then
$\overline{\varphi_{\mathfrak{s}_3}}$
takes the value
$\infty$
at
$\mathfrak{s}_2$
and sends
$\mathfrak{s}_1$
to an element in k, hence they do not intersect. -
Suppose
$\mathfrak{s}_1$
is a maximal subcluster of
$\mathfrak{s}_2$
. If they do not intersect, then there exists a cluster
$\mathfrak{s}_3$
such that
$\overline{\varphi_{\mathfrak{s}_3}}$
takes different values at
$\mathfrak{s}_1$
and
$\mathfrak{s}_2$
. Then Lemma 3.13 gives the following implications


-
– If
$\mathfrak{s}_1 \subset \mathfrak{s}_2\subset \mathfrak{s}_3$
,
$\overline{\varphi_{\mathfrak{s}_3}}(\mathfrak{s}_1) = \overline{\varphi_{\mathfrak{s}_3}}(\mathfrak{s}_2)$
. -
– If
$\mathfrak{s}_3 \subset \mathfrak{s}_1 \subset \mathfrak{s}_2$
,
$\overline{\varphi_{\mathfrak{s}_3}}(\mathfrak{s}_1) = \overline{\varphi_{\mathfrak{s}_3}}(\mathfrak{s}_2) = \infty$
. -
– If
$\mathfrak{s}_3 \cap \mathfrak{s}_2 = \emptyset$
,
$\overline{\varphi_{\mathfrak{s}_3}}(\mathfrak{s}_1) = \overline{\varphi_{\mathfrak{s}_3}}(\mathfrak{s}_2)$
.


Then
 $\mathfrak{s}_1$
and
 $\mathfrak{s}_2$
must intersect.
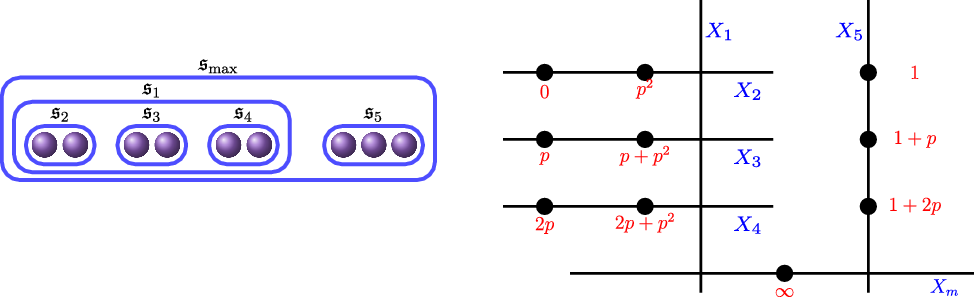
Example 1 (Continued). Let us study the cluster picture of Example 2. The set of proper cluster equals:
 \begin{align*} \mathfrak{s}_1&=\{0, p^2, p, p+p^2,2p,2p+p^2 \},& \mathfrak{s}_2&=\{0, p^2 \}, &\mathfrak{s}_3&= \{p,p+p^2\},\\ \mathfrak{s}_4&= \{2p,2p+p^2\}, & \mathfrak{s}_5&= \{1, 1+p, 1+2p \},& \mathfrak{s}_{\text{max}}&= \mathscr{R}.\end{align*}
Keeping the notation of Example 2, the map
 $\Phi$
sends the triples
 $t_i$
to
 $\mathfrak{s}_i$
for
 $i=1,\dots, 5$
and
 $t_0$
to
 $\mathfrak{s}_{\text{max}}$
. The cluster picture is given in Figure 4, where the roots follow the same order as the one given for
 $\mathscr{R}$
.
Cluster of
 $\mathscr{C}$
.

4. The semistable model
From now on we fix an n-th root of unity
 $\zeta_n \in K_2$
. If
 $d \mid n$
, by
 $\zeta_d$
we denote the d-th root of unity
 $\zeta_n^{n/d}$
. Let
 $\mathscr{Y}\,$
be the normalization of
 $\mathscr{X}\,$
in the function field of
 $Y_{K_2}$
(recall that
 $K_2=K(\sqrt[n]{\pi})$
). By [Reference Bouw and Wewers4, Corollary 3.6], the fact that
 $\mathscr{R} \subset K$
and
 $\sqrt[n]{\pi} \in K_2$
implies that
 $\mathscr{Y}\,$
is a semistable model of Y.
An explicit description of the special fiber
 $\bar{Y}$
of
 $\mathscr{Y}\,$
is the following: let
 $t \in T$
and let
 $\Phi(t) = \mathfrak{s}$
, such that
 $\mathfrak{s} =D(r,d)\cap \mathscr{R}$
, for some
 $r \in \mathscr{R}$
as in Lemma 3.4. Then the cluster
 $\mathfrak{s}$
corresponds to a component of the special fiber of
 $\bar{X}$
. Let
 $x_t \,:\!=\,\phi_t^*(x)$
be the pullback of the standard coordinate x of X. The two variables are related by the formula
 $x = \pi^dx_t+r$
.
Let
 $e_t$
be the valuation of the content of the polynomial
 $f(x_t)$
(in Section 6.1 we will explain how to read the value
 $e_t$
from a weighted cluster) and let
 $f_t(x_t) = f(x_t)\pi^{-e_t}$
. Define the curve:
 \begin{equation} \overline{\mathcal{Y}}_t\;:\; y_t^n = \overline{f_t}(x_t).\end{equation}
The curve
 $\overline{Y_t}$
is then the normalization of
 $\overline{\mathcal{Y}}_t$
. Note that the curve
 $\overline{\mathcal{Y}_t}$
might be reducible, and its components might not even be defined over K (but over an unramified extension of degree at most n). The number of components of
 $\overline{\mathcal{Y}_t}$
might be read from the cluster picture. Concretely, let
 $\tilde{\mathfrak{s}}_1, \ldots, \tilde{\mathfrak{s}}_N$
be the children of
 $\mathfrak{s}$
, let
 $\alpha_i \in \tilde{\mathfrak{s}_i}$
be any root and let
 $a_i = |\tilde{\mathfrak{s}}_i|$
. Each cluster
 $\tilde{\mathfrak{s}}_i$
correspond to a factor of
 $\overline{f_t}(x_t)$
and the number
 $a_i$
gives the multiplicity of the root
 $\alpha_i$
. Define
 \begin{equation*} c_t = \prod_{\beta \in\mathscr{R} \setminus \{\mathfrak{s}\}}\frac{(r-\beta)}{\|(r-\beta)\|_p}. \end{equation*}
Proposition 4.1. Following the previous notation, let
 $d\,:\!=\,gcd(n,a_1, \ldots, a_N)$
. Then the curve
 $\overline{\mathcal{Y}_t}$
has d irreducible components defined over the extension
 $K_2(\sqrt[d]{c_t})$
. In particular, the same holds for
 $\overline{Y_t}$
.
Proof. If
 $\beta \in \mathscr{R}$
is a root not contained in
 $\mathfrak{s}$
then the term
 $x-\beta = \pi^dx_t+r - \beta$
reduces to
 $\frac{(r-\beta)}{\|r-\beta\|_p}$
up to a power of
 $\pi$
(which can be removed from the equation by the assumption
 $\sqrt[d]{\pi} \in K_2$
). Then the reduction of the polynomial
 $f_t(x_t)$
equals
 $\overline{f_t}(x_t)=c_t \prod_{i=1}^N\! (x_t{-}\alpha_i)^{a_i}$
. For
 $\ell = 0,\ldots,d-1$
let
 \begin{equation} \overline{\mathcal{Y}_t^{(\ell)}}\;:\;y_t^{n/d}=\zeta_d^\ell c_t^{1/d}\prod_{i=1}^N (x_t{-}\alpha_i)^{a_i/d}. \end{equation}
Clearly
 \begin{equation} \overline{\mathcal{Y}}_t = \bigsqcup_{\ell=0}^{d-1} \overline{\mathcal{Y}_t^{(\ell)}}. \end{equation}
Furthermore, each curve
 $\overline{\mathcal{Y}_t^{(\ell)}}$
is irreducible. The reason is that since the cover
 $K[x_t,y_t]/(y_t^n-f_t(x_t))$
of K[x] is Galois, the ramification degree at any point is divisible by the number of components. In particular, the number of components divides both n and
 $a_i$
for all i, hence it divides d.
To fully understand the semistable model
 $\mathscr{Y}$
, we only need to describe how different components intersect. If P is a point in
 $\overline{X}_t$
, then the number of points of
 $\varphi_t^{-1}(P)$
in
 $\overline{Y_t}$
equals
 $r_P={\gcd\!(n,v_P(\overline{f_t}))}$
(where
 $v_p(\overline{f_t})$
denotes the order of vanishing of the polynomial
 $\overline{f_t}$
at the point P) and each preimage has ramification degree
 $\frac{n}{\gcd\!(n,v_P(\overline{f_t}))}$
. In particular, each irreducible component of
 $\overline{Y_t}$
gets
 $\frac{r_P}{d}$
different points.
Remark 4.2. If P is not a root of
 $\overline{f_t}$
then the point is automatically unramified, and there are as many points as the degree of the cover. When P is a root of
 $\overline{f_t}$
, the value
 $v_P(\overline{f_t})$
matches precisely
 $|\mathfrak{s}|$
(where
 $\Phi(t) = \mathfrak{s}$
) so it can be read from the cluster picture.
Let
 $P \in \mathscr{R}$
, and to easy notation suppose that
 $P=0$
(this can always be done after a translation). Then the normalization of (4.1) in an open set around 0 is given by the equations
 \begin{equation*} \left\{\begin{aligned} z_t^r &= c_t\prod_{i=2}^N(x_t{-}\alpha_i)^{a_i}\\ z_tx_t^{a_1/r}&=y_t^{n/r}. \end{aligned} \right.\end{equation*}
In particular, the set
 $\varphi_t^{-1}(0)$
consists of the
 $r_P$
points with coordinates
 $(x_t,y_t,z_t)$
given by
 \begin{equation*} \left\{Q_i=\left(0,0,\zeta_{r_P}^i\left(c_t\prod_{i=2}^N({-}\alpha_i)^{a_i}\right)^{1/r}\right)\; : \; 0 \le i \le r-1\right\}. \end{equation*}
Recall that
 $d = \gcd\!(n,a_1,\ldots,a_N)$
, so in particular
 $d \mid r_P = \gcd\!(n,a_1)$
. From the decomposition (4.3) and the irreducible components definition (4.2), it follows that
 $Q_i \in \overline{Y_t^{(\ell)}}$
precisely when
 $i \equiv \ell\! \pmod d$
. In particular,
 $Q_0$
belongs to the zeroth curve,
 $Q_1$
to the first one, and so on.
Let
 $\tilde{\mathfrak{s}}$
be a child of
 $\mathfrak{s}$
(corresponding to
 $\tilde{t} \in T$
); say
 $\tilde{\mathfrak{s}}=\tilde{\mathfrak{s}}_1$
in the above notation and the center is again 0. Let
 $\tilde{c} = c_{\tilde{t}}\prod_{i=2}^N({-}\alpha_i)^{a_i}$
. Then (from (4.1)) the curve
 $\overline{\mathcal{Y}_{\tilde{t}}}$
has a defining equation
 \begin{equation} \overline{\mathcal{Y}_{\tilde{t}}}\; :\; y_{\tilde{t}}^n = \tilde{c} \prod_{i=1}^{\tilde{N}}(x_{\tilde{t}}-\beta_i)^{b_i},\end{equation}
where the product runs over childs
 $\{\tilde{s_i}\}$
of
 $\tilde{\mathfrak{s}}$
, the number
 $b_i$
equals the number of roots in
 $\tilde{s_i}$
, and
 $\beta_i$
is a root in
 $\tilde{s_i}$
. Note that
 $\sum_{i=1}^{\tilde{N}}b_i = a_1$
. The gluing (as described in [Reference Dokchitser, Dokchitser, Maistret and Morgan8] before Remark 3.9) corresponds in our coordinates to identify the infinity point in the chart
 $\tilde{t}$
with the zero point in the chart t. For that purpose, write equation (4.4) as
 \begin{equation} \left(\frac{y_{\tilde{t}}^{n/r}}{x_{\tilde{t}}^{a_1/r}}\right)^r = \tilde{c} \prod_{i=1}^{\tilde{N}}\left(1-\frac{\beta_i}{x_{\tilde{t}}}\right)^{b_i}.\end{equation}
This equation is the key to identify the points
 $Q_i$
in
 $\mathfrak{s}$
with their counterparts in
 $\tilde{\mathfrak{s}}$
as defined in (4.5) (or its irreducible components if it happens to be reducible), providing the intersection points of
 $\mathfrak{s}$
and
 $\tilde{\mathfrak{s}}$
(see the formulas in [Reference Dokchitser, Dokchitser, Maistret and Morgan8, Proposition 5.5]).
Let
 $\tilde{d} = \gcd\!(n,b_1,\ldots,b_{\tilde{N}})$
, then the curve
 $\overline{\mathcal{Y}_{\tilde{t}}}$
consists on
 $\tilde{d}$
components (ordered according to powers of
 $\tilde{d}$
-th roots of unity) and (due to our compatible choice of roots of unity) the point
 $Q_0$
lies at the infinity part of the zeroth component,
 $Q_1$
in the first component and so on. Let us illustrate the situation with some examples.
Example 1 (Continued II). Recall that there are six components (see Figures 1 and 4), namely:
-
$\overline{\mathcal{Y}}_m\;:\; y_m^6 = x_m^6 (x_m - 1)^3$
(with relations
$x_m = x$
,),
-
$ \overline{\mathcal{Y}}_1\;:\; y_1^6 = ({-}1)x_1^2 (x_1 - 1)^2(x_1 - 2)^2$
(with relations
$x_1 = x/p$
,
$y_1 = y/p$
),
-
$\overline{\mathcal{Y}}_2\;:\; y_2^6 = ({-}4)x_2 (x_2 - 1)$
(with relations
$x_2 = x/p^2$
,
$y_2 = y/p^{4/3}$
),
-
$\overline{\mathcal{Y}}_3\;:\; y_3^6 = ({-}4)x_3 (x_3 - 1)$
(with relations
$x_3 = (x-p)/p^2$
,
$y_3 = y/p^{4/3}$
),
-
$\overline{\mathcal{Y}}_4\;:\; y_4^6 = ({-}4)x_4 (x_4 - 1)$
(with relations
$x_4 = (x-2p)/p^2$
,
$y_4 = y/p^{4/3}$
),
-
$\overline{\mathcal{Y}}_5\;:\; y_5^6 = x_5 (x_5 - 1)(x_5 -2)$
(with relations
$x_5 = (x-1)/p$
,
$y_5 = y/p^{1/2}$
).


The curves
 $\overline{\mathcal{Y}}_2, \overline{\mathcal{Y}}_3,\overline{\mathcal{Y}}_4, $
are nonsingular irreducible curves of genus 2, while
 $\overline{\mathcal{Y}}_5$
is a nonsingular curve of genus 4. On the other hand, the curves
 $\overline{\mathcal{Y}}_m$
and
 $\overline{\mathcal{Y}}_1$
are reducible. The curve
 $\overline{\mathcal{Y}}_m$
consists of the union of three (genus 0) curves
 $\overline{\mathcal{Y}_m^{(\ell)}}$
,
 $\ell=0,1,2$
with defining equations
 \begin{equation*} \overline{\mathcal{Y}_m^{(\ell)}}\; :\; y_m^2 = \zeta_3^\ell x_m^2(x_m -1) \; (y_m = y), \end{equation*}
where
 $\zeta_3$
is a third root of unity in
 $\mathbb{F}_p$
. The curve
 $\overline{\mathcal{Y}}_1$
consists of the union of two genus 1 curves
 $\overline{\mathcal{Y}_1^{(\ell)}}$
,
 $\ell=0,1$
with equation
 \begin{equation*} \overline{\mathcal{Y}_1^{(\ell)}}\; :\; y_1^3 =({-}1)^\ell \sqrt{-1} x_1(x_1 -1)(x_1 - 2) \; (y_1 = y/p).\end{equation*}
Note that the components of
 $\overline{\mathcal{Y}_1}$
need not be defined over
 $K_2$
, but at most over an unramified quadratic extension of it (since
 $p\nmid 6$
,
 $K_2(\sqrt{-1})/K_2$
is unramified). The normalization explained in the previous section, in an open neighborhood of 0 (but not of 1) of the curve
 $\overline{\mathcal{Y}_m^{(\ell)}}$
has equation
 \begin{equation*}\begin{cases} z_m^2 = \zeta_3^\ell(x_m -1) \\ z_m x_m = y_m. \end{cases}\end{equation*}
The preimage of 0 in the
 $\ell$
-th component corresponds to the points
 $P_\ell^{\pm}=\left(0,0, \pm \sqrt{-1}\zeta_3^{2\ell}\right)$
. In particular, it intersects
 $\overline{\mathcal{Y}}_1$
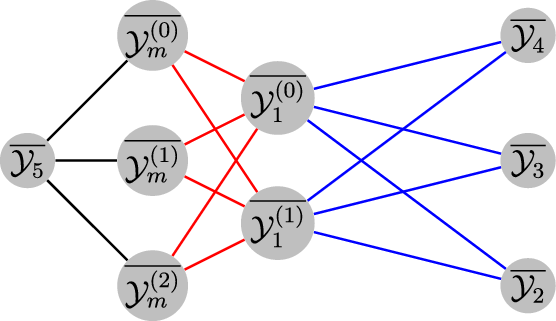
in 2 points. The component graph of the special fiber of
 $\mathscr{Y}\,$
is given in Figure 5.
Special Fiber of
 $\mathscr{Y}$
.

Example 3. Let p be an odd prime congruent to 1 modulo 3 and let
 $\mathscr{C}/\mathbb{Z}_p$
be the curve defined by
 \begin{align}& y^6=x(x-p^2)(x-p)(x-p-p^2)(x-2p)(x-2p-p^2)(x-1)(x-1-p^2)(x-1-2p^2)\\
&\qquad \qquad \qquad \qquad \quad(x-1-p)(x-1-p-p^2)(x-1-p-2p^2)(x-2)(x-2-p)(x-2-2p).\end{align}
It is a curve of genus 34. The set of roots of f(x) equals
 $\mathscr{R}=\{0,p,p^2,p+p^2,2p,2p+p^2,1,1+p,1+$
 $${p^2},1 + 2{p^2},1 + p + {p^2},1 + p + 2{p^2},2,2 + p,2 + 2p\} $$
. There are nine clusters as shown in Figure 6. They give the components:
Cluster picture.

-
$\mathfrak{s}_{\text{max}}$
is the disc with center
$r_m=0$
and diameter
$\mu=0$
. It corresponds to a component
$\overline{\mathcal{Y}_m}\;:\;y_m^6 =x_m^6(x_m-1)^6(x_m-2)^3$
consisting of 3 irreducible components
$\overline{\mathcal{Y}_m^{(\ell)}}\;:\;y_m^2=\zeta_3^\ell x_m^2(x_m-1)^2(x_m-2)$
,
$0 \le \ell \le 2$
of genus 0 (see Proposition 4.3).
-
$\mathfrak{s}_1=\{2,2+p,2+2p\}=D(2,1)\cap \mathscr{R}$
, with variable
$x=px_1+2$
,
$y=p^{1/2}y_1$
and equation
$\overline{\mathcal{Y}_1}\;:\;y_1^6=2^6x_1(x_1-1)(x_1-2)$
. It is an irreducible curve of genus 4.
-
$\mathfrak{s}_2=\{1,\, 1+p,\, 1+p^2,\, 1+2p^2,\, 1+p+p^2,\, 1+p+2p^2\} = D(1,1)\cap \mathscr{R}$
, with variable
$x=px_2+1$
,
$y=py_2$
and equation
$\overline{\mathcal{Y}_2}\;:\;y_2^6=-x_2^3(x_2-1)^3$
. It consists of three irreducible components
$\overline{\mathcal{Y}_2^{(\ell)}}\;:\;y_1^2=-\zeta_3^\ell x_1(x_1-1)$
,
$0 \le \ell \le 2$
of genus 0.
-
$\mathfrak{s}_3=\{1,1+p^2,1+2p^2\} = D(1,2)\cap \mathscr{R}$
, with variable
$x=p^2x_3+1$
,
$y = p^{3/2}y_3$
and equation
$\overline{\mathcal{Y}_3}\;:\;y_3^6=x_3(x_3-1)(x_3-2)$
. It is an irreducible curve of genus 4.
-
$\mathfrak{s}_4=\{1+p,1+p+p^2,1+p+2p^2\} = D(1+p,2)\cap \mathscr{R}$
, with variable
$x=p^2x_4+1+p$
,
$y = p^{3/2}y_4$
and equation
$\overline{\mathcal{Y}_4}\;:\;y_4^6=-x_4(x_4-1)(x_4-2)$
. It is an irreducible curve of genus 4.
-
$\mathfrak{s}_5=\{0,p,p^2,p+p^2,2p,2p+2p^2\} = D(0,1)\cap \mathscr{R}$
, with variable
$x=px_5$
,
$y = py_5$
and equation
$\overline{\mathcal{Y}_5}\;:\;y_5^6=-8x_5^2(x_5-1)^2(x_5-2)^2$
. It consists of two irreducible components
$\overline{\mathcal{Y}_5^{(\ell)}}\;:\;y_5^3=$
$({-}1)^\ell 2\sqrt{-2}x_5(x_5-1)(x_5-2)$
,
$\ell=0, 1$
of genus 1.
-
$\mathfrak{s}_6=\{0,p^2\} = D(0,2)\cap \mathscr{R}$
, with variable
$x=p^2x_6$
,
$y = p^{4/3}y_6$
and equation
$\overline{\mathcal{Y}_6}\;:\;y_6^6=-32x_6(x_6-1)$
. It is an irreducible curve of genus 2.
-
$\mathfrak{s}_7=\{p,p+p^2\} = D(p,2)\cap \mathscr{R}$
, with variable
$x=p^2x_7+p$
,
$y = p^{4/3}y_7$
and equation
$\overline{\mathcal{Y}_7}\;:\;y_7^6=-8x_7(x_7-1)$
. It is an irreducible curve of genus 2.
-
$\mathfrak{s}_8=\{2p,2p+p^2\} = D(2p,2)\cap \mathscr{R}$
, with variable
$x=p^2x_8+2p$
,
$y = p^{4/3}y_8$
and equation
$\overline{\mathcal{Y}_8}\;:\;y_8^6=-32x_8(x_8-1)$
. It is an irreducible curve of genus 2.


The special fiber of
 $\mathscr{X}\,$
and
 $\mathscr{Y}\,$
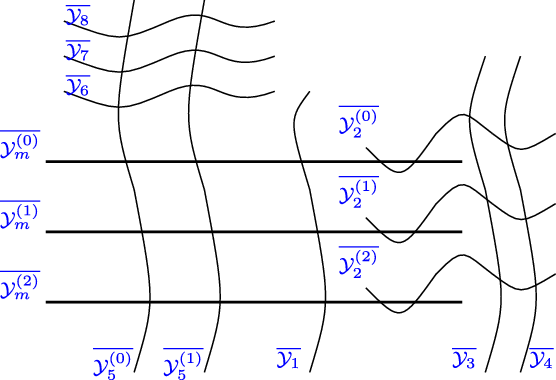
are given in Figures 7 and 8, respectively.
Special Fiber of
 $\mathscr{X}$
.

Special Fiber of
 $\mathscr{Y}$
.

4.1. Genus of
$\overline{Y_t}$

Keeping the previous notations, let
 $\overline{Y_t}$
be a component of the special fiber of
 $\mathscr{Y}\,$
(we do not assume that it is irreducible), above a component X of
 $\mathscr{X}$
, corresponding to a cluster
 $\mathfrak{s}$
. The genus of each irreducible component of
 $\overline{Y_t}$
can be read from the cluster picture.
Proposition 4.3. Let
 $\widetilde{\mathfrak{s}}_1, \ldots,\widetilde{\mathfrak{s}}_N$
be the children of
 $\mathfrak{s}$
, let
 $a_i = |\widetilde{\mathfrak{s}}_i|$
and let
 $d\,:\!=\,gcd\!(n,a_1, \ldots, a_N)$
. Then irreducible components of
 $\overline{Y_t}$
have genus
 \begin{align*}\frac {1}{2d} \left( n(N - 2) - \sum_{i = 1}^{N} \gcd\!(n,{a}_i) \right) + 1 + \begin{cases} 0 & { if\ } n \mid \sum_{i=1}^{N} {a}_i \\ \frac{n}{2d} - \frac{\gcd\!(n,\sum_{i=1}^{N} {a}_i)}{2d} & { if\ } n\nmid \sum_{i=1}^{N} {a}_i\end{cases}\end{align*}
Proof. Since the genus of a curve equals that of its normalization, we can look at the components of
 $\overline{\mathcal{Y}_t}$
. By Proposition 4.1, we know that the components are given by an equation of the form
 $\overline{\mathcal{Y}_t^{\ell}}\; :\; y_t^{n/d} = \zeta_d^\ell c^{1/d} \prod_{i=1}^N\! (x_t{-}\alpha_i)^{a_i/d}$
.
If
 $\pi\; : \;X \to X'$
is a general degree D map between two nonsingular curves, the Riemann–Hurwitz formula (see for example [Reference Hartshorne11, Corollary 2.4]) relates the genus of X (denoted g(X)) with the genus of X
 $'$
(denoted g(X
 $'$
)) via the formula
 \begin{equation*}2g(X)-2 = D(2g(X')-2) + \sum_P (e_P-1),\end{equation*}
where
 $e_P$
denotes the ramification degree of the map at P. Taking
 $X = \overline{\mathcal{Y}_t^\ell}$
and
 $X'=\mathbb{P}^1$
,
 $g(X')=0$
,
 $D=\frac{n}{d}$
and
-
$e_P = 1$
for all points
$P \neq \alpha_i$
and
$P \neq \infty$
,
-
as mentioned before, each point
$\alpha_i$
has ramification degree
$\frac{n}{\gcd\!(n,a_i)}$
and there are
$\frac{\gcd\!(n,a_i)}{d}$
points above it. -
If
$n \mid \sum_{i=1}^N a_i = \deg\!(\overline{f_t(x_t)})$
,
$\infty$
is not ramified. Otherwise, it is a ramified point, with ramification degree
$\frac{n}{\gcd\!(n,\deg\!(\overline{f_t(x_t)}))}$
and
$\frac{\gcd\!(n,\deg\!(\overline{f_t(x_t)}))}{d}$
points.


Then the Riemann–Hurwitz formula implies that the genus of
 $\overline{\mathcal{Y}_t^{(\ell)}}$
equals
 \begin{equation*} \frac {1}{2} \left( \frac{n}{d}(N - 2) - \sum_{i = 1}^{N} \frac{\gcd\!(n,{a}_i)}{d} \right) + 1 + \begin{cases} 0 & \textrm{ if } n \mid \sum_{i=1}^N a_i, \\ \frac{n}{2d} - \frac{\gcd\!(n,\sum_{i=1}^N a_i)}{2d} & \textrm{ if } n\nmid \sum_{i=1}^N a_i.\end{cases} \end{equation*}
5. The Galois representation of
$\mathscr{C}\,$
over
$K_2$


Let
 $\Upsilon = (V,E)$
denote the dual graph of the special fiber of
 $\overline{Y}$
(also referred as the graph of components in [Reference Bouw and Wewers4]); it is an undirected graph whose vertices V are the irreducible components of
 $\overline{Y}$
. Given two irreducible components
 $\overline{\mathcal{Y}_1}$
and
 $\overline{\mathcal{Y}_2}$
, the set E contains one edge between them for each intersection point of
 $\overline{\mathcal{Y}_1}$
with
 $\overline{\mathcal{Y}_2}$
. Under our hypothesis, the action of
 $\textrm{Gal}(\overline{k}/k)$
on the set
 $\overline{X}$
is trivial, but its action on the set of irreducible components of
 $\overline{Y_t}$
(and on
 $\Upsilon$
) might not be.
Let
 $\ell$
be a prime number, with
 $\ell \neq p$
. The hypothesis
 $\ell \neq p$
implies that the wild inertia subgroup acts trivially on the
 $\ell$
-adic étale cohomology. Furthermore, the restriction to the inertia subgroup
 $I_p$
factors through the quotient corresponding to the maximal pro-
 $\ell$
quotient (as explained in [Reference Grothendieck10, Corollaire 3.5.2]), which is canonically isomorphic to
 $\mathbb{Z}_\ell(1)$
. Let
 $\sigma\;:\; I_p \to \mathbb{Z}_\ell$
be the
 $\ell$
-adic tame character. Recall the definition of the following well-known representation.
Definition 5.1. The special (or Steinberg) 2-dimensional representation (denoted
 $\textrm{Sp}_2$
) is the
 $\ell$
-adic representation of
 $\textrm{Gal}(\overline{K}/K)$
given on
 $h \in I_p$
by
 \begin{equation*}\textrm{Sp}_2(h) = \begin{pmatrix} 1 &&& \sigma(h)\\[4pt] 0 &&& 1\end{pmatrix},\end{equation*}
and whose value at a Frobenius
 $\tau_K$
equals
 \begin{equation*} \textrm{Sp}_2(\tau_K) = \begin{pmatrix} 1 &&& 0\\[4pt] 0 &&& q\end{pmatrix},\end{equation*}
where
 $q = \# k$
.
This is precisely the representation that appears while considering an elliptic curve with a prime of multiplicative reduction (thanks to the theory of Tate curves, as explained in [Reference Silverman14] Chapter V, Section 5).
Then [Reference Dokchitser, Dokchitser and Morgan9, Corollary 1.6] (see also [Reference Grothendieck10, IX, Section 12]) it follows that as
 $\mathbb{Q}_\ell[G_K]$
-modules

The direct sum decomposition comes from the study of the Picard group
 $\textrm{Pic}^0(Y)$
. It contains an abelian part and a toric one (see for example [Reference Bosch, Lütkebohmert and Raynaud3], Example 8, p. 246). The rank of the toric part equals the rank of
 $\text{H}^1(\Upsilon,\mathbb{Z})$
, and its Galois representation consists of Jordan blocks of size 2 (see [Reference Grothendieck10, Proposition 3.5], p. 350). The action of
 $\textrm{Gal}(\overline{K}/K)$
on
 $Y(\overline{K})$
extends to a semilinear action on the geometric points of
 $\overline{Y}$
(see [Reference Dokchitser, Dokchitser, Maistret and Morgan8, equation (2.18)], [Reference Dokchitser, Dokchitser and Morgan9, Corollary 1.6] and p. 13 of [Reference Coates, Fukaya, Kato and Sujatha5]).
The Galois module structure of the first summand on the right hand side of (5.1) is the easy one, since the action of the inertia subgroup
 $I_p$
of
 $G_K$
on

is trivial. Recall that the quotient
 $G_K/I_p$
is topologically generated by a Frobenius automorphism, and its characteristic polynomial is determined by a point count computation. Then we are led to understand the action of
 $G_K$
on the last summand.
The decomposition (5.1) in terms of the representation of the Tate module of
 $\mathscr{C}\,$
translates into an isomorphism of
 $G_K$
-modules
 \begin{equation*} V_{\ell}(\textrm{Pic}^0(Y)) \simeq \left(\left(\text{H}^1(\Upsilon,\mathbb{Z})\otimes_{\mathbb{Z}}\mathbb{Q}_\ell\right) \otimes \textrm{Sp}_2\right) \oplus \bigoplus_{\tilde{Y} \in V} V_\ell(\textrm{Pic}^0(\tilde{Y})),\end{equation*}
where inertia acts trivially on
 $\text{H}^1(\Upsilon,\mathbb{Z})$
.
Proposition 5.2. There exists
 $|E| - |V| + 1$
unramified characters
 $\{\chi_i\}$
of
 $G_K$
such that
 \begin{equation} V_{\ell}(\textrm{Pic}^0(Y)) \simeq \sum_{i=1}^{|E| - |V| + 1}\left(\textrm{Sp}_2\otimes \chi_i\right) \oplus \bigoplus_{\tilde{Y} \in V} V_\ell(\textrm{Pic}^0(\tilde{Y})). \end{equation}
Proof. The rank of
 $\textrm{H}^1(\Upsilon,\mathbb{Z})$
equals
 $|E| - |V| + 1$
(because the graph is connected). Since inertia acts trivially on
 $\text{H}^1(\Upsilon,\mathbb{Z})$
, the
 $G_K$
action on it is uniquely determined by the action of a Frobenius element. But the action of Frobenius at
 $\text{H}^1(\Upsilon,\mathbb{Z})$
is given by a permutation matrix, corresponding to its action on the different irreducible components.
Remark 5.3. As already mentioned, the action of a Frobenius element at
 $V_\ell(\textrm{Pic}^0(\tilde{Y}))$
can be obtained via counting the number of points of
 $\overline{Y_t}$
over different extensions of k, providing an explicit description of
 $V_{\ell}(\textrm{Pic}^0(Y))$
as a
 $G_K$
-module.
Theorem 5.4. The rank of
 $\textrm{H}^1(\Upsilon,\mathbb{Z})$
equals
 \begin{equation*} \sum_{\tilde{\mathfrak{s}}}\gcd\!(n,|\tilde{\mathfrak{s}}|)-\sum_{\mathfrak{s}}\gcd\!(n,|\tilde{\mathfrak{s}}_1|,\ldots,|\tilde{\mathfrak{s}}_N|) + 1, \end{equation*}
where the first sum runs over all proper clusters except the maximal one, the second sum runs over all proper clusters, and the elements
 $\tilde{\mathfrak{s}}_1,\ldots,\tilde{\mathfrak{s}}_N$
denote the children of
 $\mathfrak{s}$
(which might not be proper).
Proof. Recall that the rank of
 $\textrm{H}^1(\Upsilon,\mathbb{Z})$
equals
 $|E| - |V| + 1$
. The value
 $|V|$
(the number of irreducible components) equals the second term by Proposition 4.1. The number of intersection points follows from the discussion after the same proposition, that states that
 $\#\varphi_t^{-1}(P)= gcd(n, v_P(f_t))$
. Since
 $v_P(f_t) = |\tilde{\mathfrak{s}}|$
the result follows.
Example 1. (Continued III). The graph of components
 $\Upsilon$
(which can be read from Figure 5) is given in Figure 9. Using the previous theorem, looking at the cluster description of Figure 4, it follows that
 $\textrm{H}^ 1(\Upsilon,\mathbb{Z})$
has rank 7 (which can be easily verified from the graph picture since the graph of components
 $\Upsilon$
contains 9 vertices and 15 edges). An important feature of Theorem 5.4 is that we do not need to know the graph of components! (the cluster picture is enough). In particular, the image of inertia (of the Galois representation) consists of 7 copies of the Steinberg representation
 $\textrm{Sp}_2$
(sending a generator of the inertia subgroup to the matrix
 $\left(\begin{smallmatrix} 1 & 1\\0 & 1\end{smallmatrix} \right)$
) and the identity elsewhere.
The component graph
 $\Upsilon$
.

Recall by (5.1) that the Galois representation of
 $\mathscr{C}\,$
has two parts, one coming from the components and one coming from the graph of components. Let
 $\sigma$
denotes the Frobenius automorphism of
 $\textrm{Gal}(K_2^{\text{ur}}/K_2)$
. If we want to understand its action on the graph of components, we need to consider two different cases: if
 $\sqrt{-1} \in K_2$
, then all components as well as the intersection points are defined over
 $K_2$
. In particular, its action is trivial (and the
 $2 \times 2$
blocks correspond precisely to the classical Steinberg representation). However, if
 $\sqrt{-1} \not \in K_2$
, then Frobenius interchanges the two components
 $\overline{\mathcal{Y}_1^{(0)}}$
and
 $\overline{\mathcal{Y}_1^{(1)}}$
, so we must compute its eigenvectors. A basis for the graph cohomology are the cycles:
-
$e_1=\{\overline{\mathcal{Y}_m^{(0)}},\overline{\mathcal{Y}_1^{(0)}},\overline{\mathcal{Y}_4},\overline{\mathcal{Y}_1^{(1)}}\}$
,
-
$e_2=\{\overline{\mathcal{Y}_m^{(0)}},\overline{\mathcal{Y}_1^{(0)}},\overline{\mathcal{Y}_3},\overline{\mathcal{Y}_1^{(1)}}\}$
,
-
$e_3=\{\overline{\mathcal{Y}_m^{(0)}},\overline{\mathcal{Y}_1^{(0)}},\overline{\mathcal{Y}_2},\overline{\mathcal{Y}_1^{(1)}}\}$
,
-
$e_4=\{\overline{\mathcal{Y}_m^{(0)}},\overline{\mathcal{Y}_1^{(0)}},\overline{\mathcal{Y}_m^{(1)}},\overline{\mathcal{Y}_5}\}$
,
-
$e_5=\{\overline{\mathcal{Y}_m^{(0)}},\overline{\mathcal{Y}_1^{(1)}},\overline{\mathcal{Y}_m^{(1)}},\overline{\mathcal{Y}_5}\}$
,
-
$e_6=\{\overline{\mathcal{Y}_m^{(0)}},\overline{\mathcal{Y}_1^{(0)}},\overline{\mathcal{Y}_m^{(2)}},\overline{\mathcal{Y}_5}\}$
,
-
$e_7=\{\overline{\mathcal{Y}_m^{(0)}},\overline{\mathcal{Y}_1^{(1)}},\overline{\mathcal{Y}_m^{(2)}},\overline{\mathcal{Y}_5}\}$
.


Clearly
 $\sigma$
fixes
 $e_1, e_2, e_3$
, while it interchanges
 $e_4 \leftrightarrow e_5$
and
 $e_6 \leftrightarrow e_7$
. In particular, a basis of eigenvectors for
 $\sigma$
is given by
 $\{e_1,e_2,e_3,e_4+e_5,e_6+e_7,e_4-e_5,e_6-e_7\}$
, where
 $\sigma$
acts trivially on the first five elements, and it acts as multiplication by
 $-1$
on the last two ones. In particular, the action of
 $\sigma$
on the last two eigenvectors matches the action of the character
 $\chi_{-1}$
(corresponding to the unramified quadratic extension
 $K_2(\sqrt{-1})/K_2$
). Then
 \begin{equation*} \left(\text{H}^1(\Upsilon,\mathbb{Z})\otimes_{\mathbb{Z}}\mathbb{Q}_\ell\right) \otimes \textrm{Sp}_2 = \textrm{Sp}_2 ^5 \oplus (\textrm{Sp}_2 \otimes \chi_{-1})^2. \end{equation*}
Note that the sum of the genera of the components equals 12, and
 $7+12=19$
which is the genus of
 $\mathscr{C}\,$
(as it should be).
Example 3 (Continued). From the cluster picture (see Figure 6) and Theorem 5.4, we get that
 $\textrm{H}^ 1(\Upsilon,\mathbb{Z})$
has rank 14, hence the image of inertia equals 14 Jordan blocks of size
 $2 \times 2$
. The component graph
 $\Upsilon$
contains 14 vertices and 27 edges (which can be read from Figure 8 and Figure 10). The sum of the genera of the components equals 20 and
 $20+14=34$
which is the genus of
 $\mathscr{C}$
.
The component graph
 $\Upsilon$
for Example 3.

A similar analysis as the one made in the previous example can be used to determine the graph component representation. For the components
 $\overline{\mathcal{Y}_m^{(i)}}$
and
 $\overline{\mathcal{Y}_5^{(j)}}$
to be defined over K, we need
 $\sqrt{-2}$
to be an element of
 $K_2$
. Start supposing this is the case. The group
 $G_{K_2}$
fixes the vertices of the graph, but might not fix the edges (corresponding to the intersection points). The intersection of
 $\overline{\mathcal{Y}_m^{(i)}}$
with
 $\overline{\mathcal{Y}_5^{(j)}}$
consists of two points with coordinates in
 $K_2(\sqrt{-2\zeta_3^i})$
, which is fixed by
 $G_{K_2}$
under our hypothesis. However, the intersection of
 $\overline{\mathcal{Y}_m^{(i)}}$
with
 $\overline{\mathcal{Y}_2^{(i)}}$
corresponds to two points with coordinates in
 $K_2(\sqrt{-\zeta_3^i})$
.
If
 $\sqrt{-1}$
also belongs to
 $K_2$
, the Galois representation attached to
 $\mathscr{C}\,$
decomposes as a direct sum of representations of dimensions
 $8 + 8 + 8 + 2 + 2 + 4 + 4 + 4$
(corresponding to the curves
 $\overline{\mathcal{Y}_1}$
,
 $\overline{\mathcal{Y}_3}$
,
 $\overline{\mathcal{Y}_4}$
,
 $\overline{\mathcal{Y}_5^ {(0)}}$
,
 $\overline{\mathcal{Y}_5^ {(1)}}$
,
 $\overline{\mathcal{Y}_6}$
,
 $\overline{\mathcal{Y}_7}$
and
 $\overline{\mathcal{Y}_8}$
, respectively) and 14 blocks where the action of Frobenius is trivial and a generator of inertia acts by
 $\left( \begin{smallmatrix} 1 & 1 \\ 0 & 1 \end{smallmatrix} \right)$
(corresponding to the Steinberg representation).
If
 $\sqrt{-1} \not \in K_2$
, let
 $\sigma \in \textrm{Gal}(\overline{K_2}/K_2)$
be an element sending
 $\sqrt{-1}$
to
 $-\sqrt{-1}$
. Then
 $\sigma$
permutes the two edges joining the vertices
 $\overline{\mathcal{Y}_m^{(i)}}$
and
 $\overline{\mathcal{Y}_2^{(i)}}$
(the blue ones in Figure 10). Note that the difference of these two lines is a cycle, where
 $\sigma$
acts by
 $-1$
. If C is any cycle in
 $H^1(\Upsilon,\mathbb{Z})$
, then either C does not contain any edge joining
 $\overline{\mathcal{Y}_m^{(i)}}$
and
 $\overline{\mathcal{Y}_2^{(i)}}$
(in which case it is fixed by
 $\sigma$
), or otherwise it contains such an edge. Consider the integral decomposition
 \begin{equation*} C = \frac{C + \sigma(C)}{2} + \frac{C-\sigma(C)}{2}. \end{equation*}
The first term is invariant under
 $\sigma$
, while the second term lies in the span by the three blue loops. This implies that the lattice where
 $\sigma$
acts trivially has rank 11, while the one where it acts by
 $-1$
has rank 3. In particular,
 \begin{equation*} \left(\text{H}^1(\Upsilon,\mathbb{Z})\otimes_{\mathbb{Z}}\mathbb{Q}_\ell\right) \otimes \textrm{Sp}_2 = \textrm{Sp}_2 ^{11} \oplus (\textrm{Sp}_2 \otimes \chi_{-1})^3. \end{equation*}
Recall that
 $\chi_{-1}$
is an unramified character (since
 $p \nmid 6$
).
If
 $\sqrt{-2} \not \in K_2$
, let
 $\sigma \in \textrm{Gal}(\overline{K_2}/K_2)$
be an element sending
 $\sqrt{-2}$
to
 $-\sqrt{-2}$
. Then
 $\sigma$
permutes the two components
 $\overline{\mathcal{Y}_5^ {(0)}}$
and
 $\overline{\mathcal{Y}_5^ {(1)}}$
(and their respective intersection points), which induces another involution on the components’ graph. Consider two different cases: if
 $\sqrt{-1} \in K_2$
, then
 $\sigma$
is the unique element acting (via an involution) on the graph. If C is any cycle, then
 $C - \sigma(C)$
involve only black and red paths. Such a graph contains 8 vertices and 12 edges, so its first cohomology has rank 5. In particular, the action of
 $\sigma$
is trivial on a rank 9 lattice, and
 \begin{equation*}\left(\text{H}^1(\Upsilon,\mathbb{Z})\otimes_{\mathbb{Z}}\mathbb{Q}_\ell\right) \otimes \textrm{Sp}_2 = \textrm{Sp}_2 ^{9} \oplus (\textrm{Sp}_2\otimes \chi_{-2})^5. \end{equation*}
At last, if
 $\sqrt{-1} \not \in K_2$
, the Galois group
 $\textrm{Gal}(K_2(\sqrt{-1},\sqrt{2})/K_2)$
acts on the graph, hence we can split the graph in terms if the representations of such a group, corresponding to the characters
 $\chi_{-1}$
,
 $\chi_{-2}$
and
 $\chi_2$
(where
 $\chi_{j}$
denotes the character whose kernel fixes the field
 $K_2(\sqrt{j})$
). From the previous descriptions, it follows that
 \begin{equation} \left(\text{H}^1(\Upsilon,\mathbb{Z})\otimes_{\mathbb{Z}}\mathbb{Q}_\ell\right) \otimes \textrm{Sp}_2 = \textrm{Sp}_2 ^{6} \oplus (\textrm{Sp}_2\otimes \chi_{-2})^5\oplus (\textrm{Sp}_2\otimes \chi_{-1})^3. \end{equation}
Remark 5.5. We want to emphasize that when restricting the Galois representation to
 $K_2$
, the image of inertia depends only on the components graph, which can easily be read from the cluster picture. The same is true over K if we use the weighted clusters that will be introduced in the next section.
6. The Galois representation of
$\mathscr{C}\,$
over K

The purpose of this section is to show how the previous results can be extended to give a description of the action of
 $G_K$
on the étale cohomology of
 $\mathscr{C}\,$
(still under the assuming that all roots of f(x) belong to K and that
 $p \nmid n$
).
Let
 $K_2 = K(\sqrt[n]{\pi})$
. The action of
 $G_{K_2}$
on
 $\mathscr{C}\,$
was described in Chapter 5, so we are led to understand the action of
 $\textrm{Gal}(K_2/K)$
on the special fiber of Y. Note that the extension
 $K_2/K$
is abelian, so it is reasonable to expect that some ramified characters should appear in our Galois representation. From a geometric perspective, the characters should correspond to some sort of “twisting” operation. This is indeed the case, as explained in Section 6.3.
To understand the twisting (and how it affects our Galois representation), one first needs to decompose the Galois representation attached to our curve
 $\mathscr{C}\,$
into its “new” parts coming from the different quotients of it. For each
 $d \mid n$
, the curve
 \begin{equation*}\mathscr{C}_d\;:\;y^d =\,f(x),\end{equation*}
is a quotient of our curve (as described in Section 6.2), so its Galois representation is a constituent of that of
 $\mathscr{C}$
. The “new” part corresponds to the complement of all the old ones. The key result (given in Proposition 6.6) is a description of the twisting operation on each new part of the representation attached to
 $\mathscr{C}$
.
A natural problem is how to encode the twisting operation into the cluster picture. This can be done via the so called weighted clusters introduced in [Reference Dokchitser, Dokchitser, Maistret and Morgan8]. A weighted cluster is a cluster (as defined before) that also contains information on the radii of the discs (and their difference). The knowledge of the radii was already needed in the description of the irreducible components of
 $\overline{Y_t}$
given in the proof of Proposition 4.1. In particular, the equations for
 $\overline{Y_t}$
involve working also with non-monic polynomials f(x). Moving from a monic polynomial to a nonmonic one is precisely what a twist does.
6.1. Weighted clusters
Definition 6.1. Let
 $\mathfrak{s}$
be a proper cluster (i.e.
 $\mathfrak{s} \neq \mathcal{R}$
). Define its relative diameter (that will be denoted
 $d_{\mathfrak{s}}$
) by
 \begin{equation}\notag d_{\mathfrak{s}} = \mu_{\mathfrak{s}} - \mu_{P(\mathfrak{s})},\end{equation}
where
 $P(\mathfrak{s})$
denotes the parent of
 $\mathfrak{s}$
.
Following [Reference Dokchitser, Dokchitser, Maistret and Morgan8], a weighted cluster is a cluster picture that also encodes the diameter of the different clusters as follows: in a maximal cluster include a subscript denoting its diameter; for all other clusters include its relative diameter as a subscript.
Example 1. Recall that Table 1 gives the diameters
 $\mu_{\mathfrak{s}_{\text{max}}} = 0$
,
 $\mu_{\mathfrak{s}_1} = \mu_{\mathfrak{s}_5} = 1$
,
 $\mu_{\mathfrak{s}_2}=\mu_{\mathfrak{s}_3} = \mu_{\mathfrak{s}_4}=2$
. Then their relative diameter equal
 \begin{align*}&d_{\mathfrak{s}_1} = \mu_{\mathfrak{s}_1}-\mu_{\mathfrak{s}_{\text{max}}} = 1, \; d_{\mathfrak{s}_5} = \mu_{\mathfrak{s}_5} - \mu_{\mathfrak{s}_{\text{max}}}=1,\\& d_{\mathfrak{s}_2}= \mu_{\mathfrak{s}_2}-\mu_{\mathfrak{s}_1} = 1, d_{\mathfrak{s}_3} = \mu_{\mathfrak{s}_3}-\mu_{\mathfrak{s}_1} = 1, \; d_{\mathfrak{s}_4} = \mu_{\mathfrak{s}_4}-\mu_{\mathfrak{s}_1} = 1.\end{align*}
Its weighted cluster is given by

Given
 $\mathfrak{s}_1, \mathfrak{s}_2$
two clusters (or roots), let
 $\mathfrak{s}_1 \wedge \mathfrak{s}_2$
denote the smallest cluster that contains both of them. For instance, in the previous example
 $0 \wedge 1 = \mathcal{R}$
,
 $\mathfrak{s}_2 \wedge \mathfrak{s}_3 = \mathfrak{s}_1$
and
 $\mathfrak{s}_2 \wedge p+p^2 = \mathfrak{s}_1$
. Keep the notation of the previous sections, and let
 $e_t$
be the valuation of the content of the polynomial
 $f(x_t)$
(in particular
 $e_t = v(c_t)$
).
Proposition 6.2. If
 $t \in T$
corresponds to a component of the special fiber of
 $\overline{X}$
associated to a cluster
 $\mathfrak{s}$
, the content valuation of the polynomial
 $f(x_t)$
equals
 \begin{equation}\notag e_t = \sum_{r \in \mathscr{R}} \mu_{r \wedge \mathfrak{s}}.\end{equation}
Proof. Recall that if t corresponds to a cluster
 $\mathfrak{s}= D(\alpha, \mu_{\mathfrak{s}})$
then
 $x = \pi^{\mu_{\mathfrak{s}}}x_t + \alpha$
where
 $\alpha \in \mathfrak{s}$
and
 \begin{align*}f(x_t) = \prod_{r \in \mathscr{R}} (\pi^{\mu_{\mathfrak{s}}}x_t + \alpha - r).\end{align*}
Each factor
 $(\pi^{\mu_{\mathfrak{s}}}x_t + \alpha - r)$
has content valuation
 $\min\lbrace \mu_{\mathfrak{s}}, v(\alpha - r) \rbrace$
contributing to the content valuation
 $c_t$
of
 $f(x_t)$
. Consider the following two cases:
-
If
$r \in \mathfrak{s}$
then
$\min\lbrace \mu_{\mathfrak{s}}, v(\alpha - r) \rbrace = \mu_{\mathfrak{s}} = \mu_{\mathfrak{s} \wedge r}$
. -
Otherwise,
$\min\lbrace \mu_{\mathfrak{s}}, v(\alpha - r) \rbrace = v(\alpha -r) = \mu_{\mathfrak{s} \wedge r}$
as well.


Then the formula follows.
6.2. Decomposing the representation of
$\mathscr{C}$

A good reference for the present section is [Reference Kani12]. Let G denote the group
 $\mu_n$
of n-th roots of unity, whose group algebra equals
 \begin{equation} \mathbb{Q}[G] = \mathbb{Q}[t]/(t^n-1)\simeq \prod_{d \mid n}\mathbb{Q}[t]/\phi_d(t),\end{equation}
where
 $\phi_d(t)$
denotes the d-th cyclotomic polynomial (whose complex roots are the primitive d-th roots of unity). Fix
 $\zeta_n$
a primitive n-th root of unity (which belongs to K). The group G acts on
 $\mathscr{C}\,$
via
 $t\cdot(x,y) = (x,\zeta_n y)$
. This action extends to an action of
 $\mathbb{Q}[G]$
in
 $\textrm{Aut}^0(\textrm{Jac}(\mathscr{C}\,)) \,:\!=\, \textrm{Aut}(\textrm{Jac}(\mathscr{C}\,))\otimes_{\mathbb{Z}} \mathbb{Q}$
. Let
 $V_\ell(\textrm{Jac}(\mathscr{C}\,))$
denotes the
 $\mathbb{Q}_\ell$
Tate module
 $T_\ell(\textrm{Jac}(\mathscr{C}\,))\otimes_{\mathbb{Z}_\ell}\mathbb{Q}_\ell$
. The natural injective morphism
 $\textrm{End}(\textrm{Jac}(\mathscr{C}\,))\otimes \mathbb{Q}_\ell \hookrightarrow \textrm{End}(V_\ell(\textrm{Jac}(\mathscr{C}\,))$
gives an action of
 $\mathbb{Q}_\ell[G]$
on
 $V_\ell(\textrm{Jac}(\mathscr{C}\,))$
.
If H is a subgroup of G (corresponding necessarily to the group of d-th roots of unity for some
 $d \mid n$
), we have a natural surjective map
 $\pi_H\; : \;\mathscr{C} \to \mathscr{C}/H\,:\!=\,\mathscr{C}_H$
. In particular, if
 $H = H_{n/d}$
(corresponding to
 $\mu_{n/d}$
), denote the quotient curve
 $\mathscr{C}/H$
by
 $\mathscr{C}_d$
, with equation:
 \begin{equation} \mathscr{C}_d\;:\; y^{d}=\,f(x).\end{equation}
The quotient map is given explicitly by
 $\pi_d(x,y) = (x,y^{n/d})$
(an
 $n/d$
to 1 map). This induces two morphisms between
 $\textrm{Jac}(\mathscr{C}\,)$
and
 $\textrm{Jac}(\mathscr{C}_d)$
namely the push-forward
 \begin{equation*}\pi_*\;:\;\textrm{Jac}(\mathscr{C}\,) \to \textrm{Jac}(\mathscr{C}_d),\end{equation*}
and the pullback
 \begin{equation*} \pi_d^*\;:\;\textrm{Jac}(\mathscr{C}_d) \to \textrm{Jac}(\mathscr{C}\,).\end{equation*}
The kernel of
 $\pi_d^*$
is contained in the
 $n/d$
-torsion of
 $\textrm{Jac}(\mathscr{C}_d)$
. Let
 $A_d$
denote the connected component of
 $\ker\!(\pi_*)$
. For any prime
 $\ell$
, we get an injective morphism on the
 $\mathbb{Q}_\ell$
-Tate modules
 $\pi^*_\ell\;:\;V_\ell(\textrm{Jac}(\mathscr{C}_d)) \to V_\ell(\textrm{Jac}(\mathscr{C}\,))$
and
 \begin{equation*}V_\ell(\textrm{Jac}(\mathscr{C}\,))= V_\ell(A_d) \oplus \pi^*_\ell(V_\ell(\textrm{Jac}(\mathscr{C}_d))). \end{equation*}
The group
 $\mu_{d}$
acts on
 $\mathscr{C}_d$
. For any
 $\alpha \in \mathbb{Q}[\mu_{d}]$
let
 $\pi^*(\alpha) = \frac{d}{n}(\pi_d^* \circ \alpha \circ \pi_*)$
. Then
 $\pi^*(\alpha)|_{V_\ell(A_d)} = 0$
and
 $\pi^*(\alpha)|_{\pi^*_\ell(V_\ell(\textrm{Jac}(\mathscr{C}_d)))} = \alpha$
(see the proof of Proposition 2 in [Reference Kani12]).
In particular, the Galois representation attached to the curve
 $y^n=\,f(x)$
contains for each
 $d \mid n$
what might be called a d-new part coming from the curve
 $y^d=\,f(x)$
and
 \begin{equation} V_\ell(\textrm{Jac}(\mathscr{C}\,)) = \bigoplus_{d \mid n} V_\ell(\textrm{Jac}(\mathscr{C}_{d}))^{d\text{-new}}. \end{equation}
Furthermore, following the decomposition (6.1), the action of the group algebra
 $\mathbb{Q}_\ell[t]/\phi_d(t)$
on
 $V_\ell(\textrm{Jac}(\mathscr{C}\,))$
is nontrivial precisely in the subspace corresponding to
 $V_\ell(\textrm{Jac}(\mathscr{C}_d))^{d\text{-new}}$
.
Example. Suppose that
 $n = p \cdot q$
with p, q distinct prime numbers. Then
 \begin{equation*}V_\ell(\textrm{Jac}(\mathscr{C}\,)) = V_\ell(\textrm{Jac}(\mathscr{C}\,))^{pq\text{-new}} \oplus V_\ell(\textrm{Jac}(\mathscr{C}_p)) \oplus V_\ell(\textrm{Jac}(\mathscr{C}_q)),\end{equation*}
where
 $V_\ell(\textrm{Jac}(\mathscr{C}\,))^{pq\text{-new}}=V_\ell(A_p) \cap V_\ell(A_q)$
. The group algebra
 $\mathbb{Q}[t]/\phi_{pq}(t)$
acts nontrivially on the first summand,
 $\mathbb{Q}[t]/\phi_p(t)$
on the second and
 $\mathbb{Q}[t]/\phi_q(t)$
on the third one.
An explicit description of
 $V_\ell(\textrm{Jac}(\mathscr{C}\,))^{n\text{-new}}$
can be given as virtual representations using the inclusion–exclusion principle.


6.3. Twisting
Let
 $c \in K$
be a nonzero element,
 $f(x) \in K[x]$
and consider the following two curves:
 \begin{equation*} \mathscr{C}\;:\; y^n =\,f(x), \end{equation*}
and
 \begin{equation*}\mathscr{C}\,':\; y^n =c\cdot f(x). \end{equation*}
It is clear that they become isomorphic over the (abelian) extension
 $K(\sqrt[n]{c})$
, so they are what can be called a “twist” of each other. By class field theory, the extension
 $K(\sqrt[n]{c})/K$
comes from a Hecke character (that corresponds to the twisting character).
Problem: what is the relation between the Galois representations of
 $\mathscr{C}\,$
and that of
 $\mathscr{C}\,'$
?
An answer to this problem for example allows to remove the assumption made in the first section of f(x) being monic. As mentioned in the introduction of the present section, the irreducible components of our semistable model involve equations where the defining polynomial is not monic (Proposition 4.1) and we need to twists by a d-th root of
 $c_t$
.
The problem is probably known to experts (as happens for example in the case of an elliptic curve twisted by a quadratic character, or an elliptic curve with CM by
 $\mathbb{Z}[\zeta_3]$
while twisted by a cubic or sextic character) but we did not find a good reference to its solution in the literature, so we briefly present it here.
Since both curves become isomorphic over the extension
 $K[\sqrt[n]{c}]$
, their representations must be related by some twist. More concretely, if we base extend
 $\mathscr{C}\,$
to
 $L=K[\sqrt[n]{c}]$
(let
 $\mathscr{C}_L$
denote such curve) and we do the same to
 $\mathscr{C}\,'$
then both curves become isomorphic, so their Galois representations are isomorphic as well. Recall that the representation attached to
 $\textrm{Jac}(\mathscr{C}\,)$
and
 $\textrm{Res}_{K}(\textrm{Jac}(\mathscr{C}_L))$
are related via
 \begin{equation} V_\ell(\textrm{Res}_{K}(\textrm{Jac}(\mathscr{C}_L))) = \bigoplus_{\chi} V_\ell(\textrm{Jac}(\mathscr{C}\,))\otimes \chi,\end{equation}
where
 $\chi$
ranges over the characters of the (abelian) group
 $\textrm{Gal}(L/K)$
. In particular, one is tempted to believe that the representations attached to
 $\mathscr{C}\,$
and
 $\mathscr{C}\,'$
differ by a twist.
This picture however is a little misleading, as it is not true that
 $V_\ell(\textrm{Jac}(\mathscr{C}\,'))$
equals
 $V_\ell(\textrm{Jac}(\mathscr{C}\,)) \otimes \chi$
(for any character
 $\chi$
) in general; for example, the latter does not even have the right determinant! What happens is that
 $V_\ell(\textrm{Jac}(\mathscr{C}\,))$
(respectively
 $V_\ell(\textrm{Jac}(\mathscr{C}\,'))$
) has a decomposition (as explained in Section 6.1) of the form:
 \begin{equation*} V_\ell(\textrm{Jac}(\mathscr{C}\,)) = \bigoplus_{d \mid n}V_\ell(\textrm{Jac}(\mathscr{C}_d))^{d\text{-new}}.\end{equation*}
Recall that
 $\mathbb{Q}_\ell[t]/\phi_d(t)$
acts on
 $V_\ell(\textrm{Jac}(\mathscr{C}_d))^{d\text{-new}}$
, hence the latter admits a decomposition in terms of the action of the d-th roots of unity. For that purpose, let
 $\mathscr{O}_\ell$
be the minimal extension of
 $\mathbb{Z}_\ell$
containing the d-th roots of unity, and let
 $F_\ell$
be its field of fractions.
Lemma 6.4. There exists a decomposition
 \begin{equation} V_\ell(\textrm{Jac}(\mathscr{C}_d))^{d\text{-new}}\otimes_{\mathbb{Z}_\ell}F_\ell = \mathop{\bigoplus_{i=1}^{d}}_{\gcd\!(i,d)=1}V_\ell^{(i)}(\textrm{Jac}(\mathscr{C}_d))^{d\text{-new}}\otimes_{\mathbb{Z}_\ell} F_\ell,\end{equation}
as
 $\mathbb{Q}_\ell[\textrm{Gal}_{K}]$
-modules, where t acts on
 $V_\ell^{(i)}(\textrm{Jac}(\mathscr{C}_d))^{d\text{-new}}\otimes_{\mathbb{Z}_\ell}F_\ell$
like
 $\zeta_d^i$
.
Proof. For every value of i,
 $1 \le i \le d$
prime to d, the map
 $t - \zeta_p^i$
is an endomorphism of
 $V_\ell(\textrm{Jac}(\mathscr{C}_d))^{d\text{-new}}\otimes_{\mathbb{Z}_\ell}F_\ell$
, and
 $V_\ell^{(i)}(\textrm{Jac}(\mathscr{C}_d))^{d\text{-new}}\otimes_{\mathbb{Z}_\ell} F_\ell$
equals its kernel. Since the polynomials
 $t-\zeta_d^i$
and
 $t-\zeta_d^j$
are relatively prime (if
 $i \neq j$
), the kernels do not have intersection (and we get a direct sum). The fact that
 \begin{equation*} \mathop{\prod_{i=1}^{d}}_{\gcd\!(i,d)=1}(t-\zeta_d^i) = \phi_d(t) = 0, \end{equation*}
implies that for each j prime to d, the map
 $P_j = \frac{\phi_d(x)}{(x-\zeta_d^j)}(t)$
vanishes at
 $V_\ell^{(i)}(\textrm{Jac}(\mathscr{C}_d))^{d\text{-new}}\otimes_{\mathbb{Z}_\ell} F_\ell$
for all
 $i \neq j$
, and
 $P_j$
at
 $V_\ell^{(j)}(\textrm{Jac}(\mathscr{C}_d))^{d\text{-new}}\otimes_{\mathbb{Z}_\ell} F_\ell$
acts like multiplication by the non-zero element
 $\phi_d'(\zeta_d^j)$
. Since the polynomials
 $\left\{\frac{\phi_d(x)}{(x-\zeta_d^j)}\right \}$
are relative prime, 1 can be written as a linear combination of them, hence the images of the maps
 $P_j$
span the whole vector space
 $V_\ell^{(i)}(\textrm{Jac}(\mathscr{C}_d))^{d\text{-new}}\otimes_{\mathbb{Z}_\ell}F_\ell$
.
Remark 6.5. The previous decomposition holds for
 $V_\ell(\textrm{Jac}(\mathscr{C}_d))^{d\text{-new}}\otimes_{\mathbb{Z}_\ell}\mathscr{O}_\ell$
if
 $\ell \nmid d$
. The reason is that if
 $\ell \nmid d$
 \begin{equation*}\mathscr{O}_\ell[t]/\varphi(t) = \mathop{\bigoplus_{i=1}^{d}}_{\gcd\!(i,d)=1}\mathscr{O}_\ell \cdot \zeta_d^i.\end{equation*}
Fix
 $\zeta_n$
an n-th root of unity in K. Such a choice determines an element (abusing notation)
 $\zeta_n\in \textrm{End}(\textrm{Jac}(\mathscr{C}\,))$
and an element
 $\zeta_n$
(abusing notation again) in
 $V_\ell(\textrm{Jac}(\mathscr{C}\,))$
(its image under the map
 $\textrm{End}(\textrm{Jac}(\mathscr{C}\,))\otimes \mathbb{Z}_\ell\hookrightarrow \textrm{End}(T_\ell(\textrm{Jac}(\mathscr{C}\,)))$
).
Proposition 6.6. Let
 $L=K[\sqrt[n]{c}]$
, let
 $r=[L:K]$
, and let
 $V_\ell^{(i)}(\textrm{Jac}(\mathscr{C}_d))^{d\text{-new}}\otimes_{\mathbb{Z}_\ell}F_\ell$
denote one subspace of the decomposition (6.5). Let
 $\sigma \in \textrm{Gal}(L/K)$
be the generator sending
 $\sqrt[n]{c}$
to
 $\zeta_n^{n/r} \sqrt[n]{c}$
and let
 $\chi:\textrm{Gal}(L/K) \to \overline{\mathbb{Q}_\ell}$
denote the character sending
 $\sigma$
to
 $\zeta_n^{n/r}$
. Then for all
 $1 \le i \le n$
, prime to n we have
 \begin{equation*} V_\ell^{(i)}(\textrm{Jac}(\mathscr{C}_d))^{d\text{-new}}\otimes_{\mathbb{Z}_\ell}F_\ell \simeq (V_\ell^{(i)}(\textrm{Jac}(\mathscr{C}_d'))^{d\text{-new}}\otimes_{\mathbb{Z}_\ell}F_\ell) \otimes \chi^i. \end{equation*}
Proof. Let
 $\varphi\;:\;\mathscr{C} \to \mathscr{C}\,'$
be the map
 $\varphi(x,y) = (x,\sqrt[n]{c}\, y)$
and let
 $\tilde{\sigma} \in \textrm{Gal}_{K}$
be such that its restriction to
 $K[\sqrt[n]{c}]$
equals
 $\sigma$
. We claim that
 \begin{equation} \tilde{\sigma}\circ \varphi = \zeta_n^{n/r} \cdot \varphi \circ \tilde{\sigma}. \end{equation}
If we compute both maps at a point (x, y), the left hand side equals
 \begin{equation*} (\tilde{\sigma}(x),\tilde{\sigma}(\sqrt[n]{c})\cdot\tilde{\sigma}(y))=(\tilde{\sigma}(x),\zeta_n^{n/r}\sqrt[n]{c} \cdot \tilde{\sigma}(y)), \end{equation*}
which clearly equals the right hand side hence the claim. The result follows easily from (6.6) recalling that on
 $V_\ell^{(i)}(\textrm{Jac}(\mathscr{C}_d)^{d\text{-new}})\otimes_{\mathbb{Z}_\ell}F_\ell$
the element t acts by
 $(\zeta_n^{n/r})^i$
.
Remark 6.7. The previous description is consistent with (6.4), since
 \begin{align*}V_\ell(\textrm{Res}_{K}(\textrm{Jac}(\mathscr{C}_L)))^{d\text{-new}} & = \bigoplus_{\psi} V_\ell(\textrm{Jac}(\mathscr{C}\,))^{d\text{-new}}\otimes \psi = \bigoplus_{\psi} \left(\mathop{\bigoplus_{i=1}^{d}}_{\gcd\!(i,d)=1}V_\ell^{(i)}(\textrm{Jac}(\mathscr{C}_d))^{d\text{-new}}\otimes \psi\right)\\ & = \bigoplus_{\psi} \left(\mathop{\bigoplus_{i=1}^{d}}_{\gcd\!(i,d)=1}V_\ell^{(i)}(\textrm{Jac}(\mathscr{C}_d'))^{d\text{-new}}\otimes \chi^i \psi\right) = V_\ell(\textrm{Res}_{K}(\textrm{Jac}(\mathscr{C}_L')))^{d\text{-new}},\end{align*}
where the last equality follows from the fact that while
 $\psi$
varies over all characters of the group
 $\textrm{Gal}(L/K)$
, the product
 $\chi^i \psi$
also varies over all such characters.
The Galois representation of the semistable model included already twists (of the Steinberg representation), but they were unramified ones (see for example the Galois representation of Example 2, equation (5.3)). Unramified twists affect the value of Frobenius, but do not change the image of inertia.
To compute the effect of twisting on a component of positive genus of the semistable model by an unramified character, it is probably more effective to compute the number of points of the twisted curve (using the method described in [Reference Sutherland15]) rather than assuming the polynomial f(x) is monic and then computing the twist as explained before. Ramified twists on the contrary affect the image of inertia and their action cannot be computed via counting points over K (however, in [Reference Dokchitser and Dokchitser7] a method to compute the action of ramified twists is given in terms of counting the number of points over different extensions of the base field). The use of weighted cluster is very handful to distinguish whether the twist by
 $c_t$
appearing on the components of Proposition 4.1 are ramified or not.
Proposition 6.8. Let t be a component of X corresponding to a cluster
 $\mathfrak{s}$
. Then the components of
 $\mathcal{Y}_t^{(\ell)}$
are ramified twists of a nonsingular superelliptic curve precisely when
 $d \nmid e_t$
.
Proof. The extension is unramified if and only if d divides the valuation of
 $c_t$
. But
 $e_t$
is by definition the valuation of
 $c_t$
.
In particular, Proposition 6.2 allows to check whether this condition is verified or not for a component from the weighted cluster picture. Note that for each
 $d \mid n$
, if
 $d \nmid e_t$
then the image of inertia in the abelian piece of the d-new part is given by
 $r_t$
-copies of
 \begin{equation*} \mathop{\bigoplus_{i=1}^{d}}_{\gcd\!(i,d)=1}\chi^i, \end{equation*}
where
 $\chi$
is the ramified character corresponding to the extension
 $K(\sqrt[d]{\pi^{e_t}})/K$
and
 $r_t = \frac{2g(y_t^d=f_t(x_t))}{\phi(d)}$
.
Example 1. Consider once again the first example (of degree 6), given by the equation
 \begin{equation*} \mathscr{C}\;: \; y^6 \!= x(x-p^2)(x-p)(x-p-p^2)(x-2p)(x-2p-p^2)(x-1)(x-1-p)(x-1-2p) \end{equation*}
Its weighted cluster picture equals

Proposition 6.2 gives that:
 $e_{\mathfrak{s}_{\text{max}}}=0$
,
 $e_{\mathfrak{s}_1}=6$
,
 $e_{\mathfrak{s}_2}=e_{\mathfrak{s}_3}=e_{\mathfrak{s}_4}=8$
and
 $e_{\mathfrak{s}_5}=3$
. This implies that no ramified twist is involved on
 $\overline{Y_1^{(l)}}$
(its components are genus 1-curves), while the curves
 $\overline{Y_2}$
,
 $\overline{Y_3}$
and
 $\overline{Y_4}$
(all of them of genus 2) involve a ramified twist
 $\chi$
corresponding to the extension
 $\mathbb{Q}_p(\sqrt[3]{p})/\mathbb{Q}_p$
. Such curves have a 2-new part (of genus 0), a 3-new part (of genus 1) giving the representation of inertia
 $\chi \oplus \chi^2$
and a 6-new part (also of genus 1) giving the same representation of inertia.
Regarding the component
 $\overline{Y_5}$
(of genus 4), let
 $\psi$
be the character attached to the representation
 $\mathbb{Q}_p(\sqrt{p})/\mathbb{Q}_p$
. The curve has a 2-new part of genus 1, giving the representation
 $\psi \oplus \psi$
(since
 $2 \nmid e_{\mathfrak{s}_5}$
); has a 3-new part (also of genus 1) which does not involve any twist (as
 $3 \mid 3$
) hence inertia acts trivially in this 2-dimensional part; and a 6-new part (of dimension 4) where inertia acts via the quadratic character
 $\psi$
.
To understand the toric part, we need to understand the action of
 $\textrm{Gal}(\mathbb{Q}_p(\sqrt[3]{p})/\mathbb{Q}_p)$
on the component graph. The way to compute this action is well explained in [Reference Dokchitser, Dokchitser and Morgan9] (see Examples 1.9 and 1.11). Concretely, it is given by what they call the “lift-act-reduce” procedure. Let
 $\sigma \in \textrm{Gal}(\overline{\mathbb{Q}_p}/\mathbb{Q}_p)$
and
 $(\bar{x},\bar{y})$
a point on
 $\overline{Y_m}$
. Any lift corresponds to a point
 $(\tilde{x},\tilde{y})$
(on the curve
 $\mathscr{C}$
), hence the reduction of
 $(\sigma(\tilde{x}),\sigma(\tilde{y}))$
corresponds to the point
 $(\sigma(\bar{x}),\sigma(\bar{y}))$
.
If we apply such a procedure to our example, it follows easily that such an action fixes the components
 $\overline{Y_m^{(i)}}$
as well as its intersection points. The same happens for the component
 $\overline{Y_1}$
, as the change of variables is defined over
 $\mathbb{Q}_p$
. However, while looking at the component
 $\overline{Y_2}$
the situation is quite different.
Let
 $\sigma \in \textrm{Gal}(\mathbb{Q}_p(\sqrt[3]{p})/\mathbb{Q}_p)$
be the automorphism determined by
 $\sigma(\sqrt[3]{p}) = \zeta_3 \sqrt[3]{p}$
. If
 $(\overline{x_2},\overline{y_2})$
is an element of
 $\overline{Y_2}$
, and
 $P=(\widetilde{x_2},\widetilde{y_2})$
is any lift, then P corresponds to the point in
 $\mathscr{C}\,$
with coordinates
 $(p^2\widetilde{x_2},p^{4/3}\widetilde{y_2})$
, which maps under
 $\sigma$
to the point
 $(p^2 \widetilde{x_2},\zeta_3 p^{4/3}\widetilde{y_2})$
, corresponding to the point
 $(\widetilde{x_2},\zeta_3\widetilde{y_2})$
on
 $Y_2$
, which reduces to
 $(\overline{x_2},\zeta_3\overline{y_2}) = \zeta_3 \cdot(\overline{x_2},\overline{y_2})$
. In particular,
 $\textrm{Gal}(\mathbb{Q}_p(\sqrt[3]{p})/\mathbb{Q}_p)$
acts via the cubic character
 $\chi$
sending
 $\sigma$
to
 $\zeta_3$
.
A similar computation shows that
 $\textrm{Gal}(\mathbb{Q}_p(\sqrt[3]{p})/\mathbb{Q}_p)$
acts also via the same character
 $\chi$
on the components
 $\overline{Y_3}$
and
 $\overline{Y_4}$
, but trivially on the irreducible components of
 $\overline{Y_1}$
and on
 $\overline{Y_5}$
. Note however that the action is trivial on the components graph (as it fixes all components and their intersection points). In particular, the image of inertia in the toric part is the same over
 $\mathbb{Q}_p$
than over
 $\mathbb{Q}_p(\sqrt[3]{p})$
.
Acknowledgments
The cluster pictures were done using the macros of [Reference Dokchitser, Dokchitser, Maistret and Morgan8]. We thank Tim Dokchitser for allowing us to use this package. We also thank Vladimir Dokchitser and David Roberts for some useful conversations regarding the present article. At last, but no least, we thank the anonymous referee for his/her suggestions that improved the quality of the present article. AP was partially supported by FonCyT BID-PICT 2018-02073 and by the Portuguese Foundation for Science and Technology (FCT) within project UIDB/04106/2020 (CIDMA).
Conflicts of interest
The authors declare that there is no conflict of interest.