Dietary management of phenylketonuria (PKU) has traditionally focused on strict control of circulating phenylalanine (Phe) concentrations to prevent neurotoxicity. Consequently, the development of low-phenylalanine dairy products has largely centred on reducing Phe content while preserving sensory acceptability. Increasing clinical evidence indicates that individuals with PKU frequently experience gastrointestinal (GI) disturbances, altered gut microbiota composition and emerging renal complications, suggesting that the safety and functionality of specialized protein substitutes should be evaluated within a broader metabolic context (Mancilla et al., Reference Mancilla, Mann, Zhang and Allen2021; Van Wegberg et al., Reference Van Wegberg, MacDonald, Ahring, Bélanger-quintana, Beblo, Blau, Bosch, Burlina, Campistol, Coşkun and Feillet2025).
Hyperoxaluria is a condition characterized by abnormally high urinary oxalate levels, whereby elevated oxalate concentrations promote calcium oxalate (CaOx) crystallization, the principal constituent of more than 75% of kidney stones (Karr et al., Reference Karr, Guptha, Bell and Thenell2024; Knight et al., Reference Knight, Assimos, Callahan and Holmes2011). Aromatic amino acids, particularly phenylalanine, have been implicated in oxalate generation. Individuals with PKU have been reported to exhibit urinary oxalate excretion approximately twice that of healthy individuals, and renal complications, including hypercalciuria (23%) and reduced glomerular filtration rate (19%), have been documented in adolescent and adult cohorts (Hennermann et al., Reference Hennermann, Roloff, Gellermann, Vollmer, Windt, Vetter, Plöckinger, Mönch and Querfeld2013; Prepok et al., Reference Prepok, Schnabel, Sumánszki, Barta, Tislér and Reismann2024). Beyond PKU, hyperoxaluria is also prevalent in inflammatory bowel disease (IBD), diabetes and recurrent urolithiasis. In IBD, renal calculi occur in up to 25–30% of patients, particularly following intestinal surgery, owing to malabsorption, dehydration and metabolic disturbances that increase lithogenic risk (Abdulrhman et al., Reference Abdulrhman, Alsweed, Alotaibi, Aldakhil, Alahmadi, Albishri and Alhmed2023; Dimke et al., Reference Dimke, Winther-jensen, Allin, Lund and Jess2021; Siener et al., Reference Siener, Ernsten, Welchowski and Hesse2024). Collectively, these observations highlight a shared metabolic vulnerability that remains insufficiently addressed by current functional food design.
To date, most reported low-phenylalanine Yoghurt formulations have remained intrinsically dairy-based. For instance, the formulation described by Goldar et al. (Reference Goldar, Givianrad and Shams2016) incorporated glycomacropeptide (GMP) alongside milk proteins (primarily casein), milk permeate, inulin, maize starch and transglutaminase to improve texture while partially reducing phenylalanine content. Although these strategies achieved moderate reductions in Phe, they continued to rely on casein and whey fractions as the primary structural components. Furthermore, milk permeate, which comprises approximately 70–85% lactose, together with added dairy fat or non-dairy creamers (often containing hydrogenated or palm oils, glucose syrups, sodium caseinate, phosphates, emulsifiers and stabilizers), retained many of the compositional and buffering characteristics of conventional dairy matrices (Goldar et al., Reference Goldar, Givianrad and Shams2016).
Consequently, these approaches represent compositional modifications rather than a structural redesign of the protein network. Their reliance on lactose-rich and highly processed ingredients may limit GI tolerance in sensitive populations and does not address broader metabolic concerns, such as renal lithogenic risk. Furthermore, enzyme-mediated cross-linking reinforces conventional dairy architecture rather than establishing a fundamentally different, metabolically tailored matrix. Collectively, the existing literature reflects incremental modifications of dairy systems rather than the development of a simplified, low-salt, lactose-free and physiologically targeted platform specifically designed for individuals requiring strict phenylalanine control and improved renal compatibility (Evans et al., Reference Evans, Singh, Ahring, Ashmore, Daly, Ford, Gama, Giżewska, Hill, Ilgaz and Jackson2026; Pena et al., Reference Pena, Pinto, de Almeida, de Sousa Barbosa, Ramos, Rocha, Guimas, Ribeiro, Martins, Bandeira and Dias2021).
GMP, a bioactive peptide derived from κ-casein during cheese manufacture, offers a distinct alternative. Naturally low in phenylalanine and devoid of aromatic amino acids in its intact form, GMP has demonstrated favourable GI tolerance and potential prebiotic properties. Its sialylated and phosphorylated residues can chelate (a type of bonding) calcium with nascent CaOx crystals, suggesting a plausible mechanistic role in modulating crystallization dynamics (Majidinia et al., Reference Majidinia, Kalbasi-Ashtari and Mirsaeedghazi2022, Reference Majidinia, Anbalagan, Kalbasi-Ashtari, Wai, Ranganathan, Panneerselvam, Chinnappan and Mani2026a). Coconut water (CW), which is inherently low in phenylalanine (≤25 mg/100 g) and rich in potassium, citrate precursors and antioxidant compounds, is associated with diuretic and citraturic effects and may reduce lithogenic risk. Nevertheless, CW has not been systematically incorporated into a fermented low-phenylalanine matrix designed to address both metabolic and renal considerations (Patel et al., Reference Patel, Jiang, Asplin, Granja, Capretz, Osann, Okhunov, Landman and Clayman2018; Wei et al., Reference Wei, Zhao, Meng, Xia, Pan, Li and Zhang2022).
The objectives of this study were to develop and characterize a lactose-free, low-phenylalanine Yoghurt-like product formulated from CW and casein GMP; evaluate the physicochemical properties, antioxidant activity, lactic acid bacteria (LAB) viability, sensory acceptability, storage stability and phenylalanine content of different formulations; and assess the ability of the optimized formulation to inhibit CaOx crystal nucleation, growth and aggregation in vitro, as indicators of potential anti-urolithiasis activity. It was hypothesized that increasing GMP concentration within a CW-based fermented matrix would improve physicochemical stability, antioxidant capacity and microbial viability while maintaining low-phenylalanine content. Furthermore, it was our expectation that optimized formulation could exhibit measurable inhibition of CaOx crystallization in vitro, suggesting potential functional benefits relevant to the prevention of urolithiasis.
Materials and methods
Raw materials
Pure CW, containing 0% fat, 0.1% protein, 5.3% carbohydrates, 0.05% salts and 199 mg/100 ml potassium, was purchased from the Coco Malee® brand (Thailand). Foods with protein content ≤0.5% and very low phenylalanine levels (≤25 mg/100 g), commonly regarded as ‘exchange-free’, are permitted without restriction within PKU dietary management protocols (Gama et al., Reference Gama, Adam, Adams, Allen, Ashmore and MacDonald2025).
GMP (SPGMP, Lacprodan®), comprising approximately 81% GMP with 5.5% moisture content, was obtained from Arla Foods Ingredients (Viby, Denmark). Modified corn starch (E1422, Tate & Lyle®, Netherlands), serving as a functional thickening and stabilizing agent, was used as received. Iota (ι)-carrageenan (food-grade hydrocolloid) was obtained from Chempora Co. (Shanghai, China). Organic stevia powder was supplied by Love Earth Company (Malaysia). The Yoghurt starter culture, consisting of a 1:1 (w/w) ratio of Streptococcus thermophilus and Lactobacillus delbrueckii subsp. bulgaricus, was obtained from Chr. Hansen Company (Denmark).
Preparation methods, physicochemical analysis and sensory evaluation
Starter culture preparation
Lyophilized form of starter cultures containing S. thermophilus and L. delbrueckii subsp. bulgaricus was used. For stock preparation, 100 mg of freeze-dried culture was aseptically inoculated into 100 ml of sterile de Man, Rogosa and Sharpe (MRS) broth and incubated at 37°C for 24 h under aerobic conditions. Activated cultures were cryopreserved at −45°C in MRS broth supplemented with 40% (v/v) sterile glycerol until further use (Sah et al., Reference Sah, Vasiljevic, McKechnie and Donkor2016). Prior to Yoghurt manufacture, cultures were reactivated in the CW matrix to ensure adaptation to the non-dairy substrate. Briefly, 1 ml of thawed stock culture was inoculated into 100 g of autoclaved CW containing 5% (w/w) sucrose and incubated at 43°C for 18 h. The activated culture was used immediately for fermentation (Pachekrepapol et al., Reference Pachekrepapol, Kokhuenkhan and Ongsawat2021).
Formulation followed by fermentation
Four CW–GMP Yoghurt formulations (F-1 to F-4) were prepared as shown in Table 1. Dried ingredients (GMP, modified cornstarch, sucrose, stevia, iota-carrageenan, vanilla) were first blended and gradually dispersed into CW under mechanical agitation (500 rpm) to ensure uniform hydration. The selected levels of GMP and starch were based on previous studies and preliminary formulation optimization to achieve desirable physicochemical and sensory properties in the final product.
Materials and their levels (w/w%) used in different formulations

Table 1 Long description
Materials are listed as weight by weight percent for four formulations labeled F 1 through F 4, with columns for Coconut Water with an asterisk, Starch with an asterisk, GMP, Inulin, sugar, Stevia, Unsalted butter, Iota stabilizer, Vanila, and Total. For F 1, Coconut Water is 89.65, Starch 1.5, GMP 2.5, Inulin 2.5, sugar 2, Stevia 0.03, Unsalted butter 1, Iota stabilizer 0.15, Vanila 0.2, and Total 100. For F 2, Coconut Water is 89.15 and Starch 2, with GMP 2.5, Inulin 2.5, sugar 2, Stevia 0.03, Unsalted butter 1, Iota stabilizer 0.15, Vanila 0.2, and Total 100. For F 3, Coconut Water is 89.15 and Starch 1.5, with GMP 3, Inulin 2.5, sugar 2, Stevia 0.03, Unsalted butter 1, Iota stabilizer 0.15, Vanila 0.2, and Total 100. For F 4, Coconut Water is 88.65 and Starch 2, with GMP 3, Inulin 2.5, sugar 2, Stevia 0.03, Unsalted butter 1, Iota stabilizer 0.15, Vanila 0.2, and Total 100. Inulin, sugar, Stevia, Unsalted butter, Iota stabilizer, and Vanila have the same values in all four formulas, while Coconut Water, Starch, and GMP vary.
Notes: aThe summation of coconut water and starch masses was equal for the four formulas.
Unsalted butter was added at 1% (w/w), and the mixture was preheated to 60°C to facilitate fat dispersion. Homogenization was performed at 180 bars using a two-stage homogenizer. The mixture was then heated at 90°C for 3 min and cooled to 43°C.
Starter culture (1%, w/w) was inoculated into the cooled mixture and incubated at 43°C until its pH reached 4.6. The fermentation time varied among formulations, with F1 and F2 requiring approximately 8 h, while F3 and F4 reached the target pH within approximately 6 h, indicating formulation-dependent differences in acidification kinetics. Fermentation was terminated by immediate cooling to 4°C (Pachekrepapol et al., Reference Pachekrepapol, Kokhuenkhan and Ongsawat2021; Yaakob et al., Reference Yaakob, Ahmed, Daud, Malek and Rahman2012).
Physicochemical analyses
Proximate composition
Protein content was determined by the Kjeldahl method according to AOAC Official Method 991.20 (AOAC 2016). Fat content was determined using AOAC Official Method 989.05 (AOAC 2016). Moisture content was measured using an infrared moisture analyser (Sartorius, Germany) following AOAC Official Method 925.10 (AOAC 2016). Carbohydrate content was calculated by the procedure recommended in standard proximate analysis, as described by AOAC Official Method 2020.07 (2016), Latimer (Reference Latimer2016) and Pachekrepapol et al. (Reference Pachekrepapol, Kokhuenkhan and Ongsawat2021).
PH measurement
PH was measured by a calibrated digital pH meter (CyberScan PC 300, Eutech Instruments, USA) at 25°C. Calibration was performed using standard buffer solutions (pH 4.0 and 7.0) (Pachekrepapol et al., Reference Pachekrepapol, Kokhuenkhan and Ongsawat2021).
Individual antioxidant activity of raw materials (DPPH assay)
The antioxidant potential of GMP, CW and ascorbic acid (used as a control) was evaluated using the 1,1-diphenyl-2-picrylhydrazyl (DPPH) free radical scavenging assay, following a standard protocol with minor adjustments to accommodate the experimental matrix. CW was first centrifuged at 12,000 × g for 10 min to remove particulates and obtain a clear juice. A fresh DPPH solution was prepared at a final concentration of 12.5 µM in methanol. Then, in a 96-well half-area microplate, 45 µl of the DPPH solution was mixed with 15 µl of each sample solution (GMP, CW and ascorbic acid) at concentrations ranging from 5.0 to 20.0 mg/ml. The mixtures were incubated at ∼25°C in the dark for 30 min to allow the reaction to proceed while preventing photodegradation of the DPPH radical. After incubation, the decrease in absorbance was measured at 520 nm using a multimode microplate reader. Radical scavenging activity was expressed as the percentage of DPPH inhibition relative to the control (methanol + DPPH without sample). This assay provides a reliable estimate of the electron-donating capacity of antioxidants in the tested formulations (Lammi et al., Reference Lammi, Bollati, Fiori, Li, Fanzaga, D’adduzio, Tosi, Burlina, Zuccotti and Verduci2023; Singh et al., Reference Singh, Pandey, Agnihotri, Singh and Pandey2017).
Syneresis determination
Syneresis refers to the separation of liquid (whey) from the Yoghurt gel due to contraction during storage. CW–GMP Yoghurt samples were prepared in 50 ml conical polypropylene centrifuge tubes and stored at 4°C. Syneresis was determined gravimetrically by centrifuging the samples at 640 × g for 10 min at 4°C using a Hettich™ Universal 320 centrifuge (Germany) and Karnjanapratum et al. (Reference Karnjanapratum, Surya, Senphan, Yarnpakdee, Pongsetkul and Petsong2025) method. Then the resulting supernatant (free whey) was carefully decanted and weighed. The degree of syneresis was expressed as the percentage of the supernatant relative to the initial total weight of the Yoghurt-like product, calculated according to Equation (1):
 \begin{equation}Syneresis = \left( {\frac{{{{weight{\text{ }}of{\text{ }}supernatant}}}}{{total{\text{ }}weight{\text{ }}of{\text{ }}sample}}} \right) \times 100\end{equation}
This measurement serves as a reliable indicator of the physical stability and water-holding capacity of the gel matrix during cold storage, reflecting both the quality and potential consumer acceptability of plant-based dairy alternatives (Pachekrepapol et al., Reference Pachekrepapol, Kokhuenkhan and Ongsawat2021).
Viability of LAB
The viability of LAB in CW–GMP Yoghurt was evaluated using the pour-plate method on MRS agar, following established protocols. Serial decimal dilutions of the samples were prepared in sterile saline, and 1 ml aliquots from each dilution were inoculated onto MRS agar plates. The inoculated plates were incubated anaerobically at 37°C for 48 h to allow optimal LAB growth. After incubation, colonies exhibiting typical LAB morphology were counted, and the results were expressed in the form of log CFU/ml in the Yoghurt-like product as recommended by Nemati et al. (Reference Nemati and Mozafarpour2024).
Performing FRAP assay
The ferric reducing antioxidant power (FRAP) of CW–GMP Yoghurt was assessed by a modified method described by Aloğlu et al. (Reference Aloğlu and Öner2011). Briefly, 10 g of each Yoghurt sample was mixed with 2.5 ml of distilled water, and the pH was adjusted to 4.0 using 0.1 M hydrochloric acid (HCl). The mixture was incubated at 45°C for 10 min and centrifuged at 5000 × g for 10 min at 4°C. The supernatant was collected and filtered through a 0.45 µm membrane filter. The resulting extract was stored at 4°C and analysed within 6 h. The FRAP reagent was freshly prepared by mixing 300 mM acetate buffer (pH 3.6), 10 mM 2,4,6-tripyridyl-s-triazine (TPTZ) dissolved in 40 mM HCl and 20 mM FeCl₃ · 6 H₂O at a ratio of 10:1:1 (v/v/v). Subsequently, 100 µl of CW–GMP Yoghurt extract was added to 3.0 ml of FRAP reagent and incubated at 37°C for 30 min in the dark. The absorbance was measured at 593 nm against a reagent blank using a UV–Vis spectrophotometer. A standard calibration curve was constructed using ferric sulphate (0.2–2.0 mM), and antioxidant capacity was calculated from the linear regression equation. Results were expressed as µmol Fe2⁺ equivalents/g of Yoghurt:
 \begin{equation}{\text{mM}}{\text{ }}F{e^2}^ + {\text{equivalents}} = (0.6891 \times \delta {\text{Absorbance}}) + 0.2577\end{equation}
 \begin{align}\delta {\text{Absorbance}}{\text{ }} &= {\text{ Absorbance}}{\text{ }}\left( {{\text{sample}}{\text{ }}{\text{solution}}} \right){\text{ }}\\ \nonumber
&\quad-{\text{ }}{\text{Absorbance}}{\text{ }}\left( {{\text{FRAP}}{\text{ }}{\text{reagent}}} \right)\end{align}
The final values were adjusted according to the dilution factor. One Fe2⁺ equivalent/l represents the concentration of Fe2⁺ that produces an absorbance change identical to the sample (Baniasadi et al., Reference Baniasadi, Azizkhani, Saris and Tooryan2022).
Phenylalanine (Phe) determination by HPLC
Since the F-4 formulation had better physicochemical results than the other three formulations, phenylalanine (Phe) quantification was measured for the F-4 formula by using reverse-phase high-performance liquid chromatography (RP-HPLC) following acid hydrolysis and derivatization. For each sample (including a standard reference solution of pure phenylalanine), acid hydrolysis was carried out by adding 8 ml of 6 M HCl and incubating at 110°C for 24 h, as described by Doultani et al. (Reference Doultani, KN and MR2003). After hydrolysis, the hydrolysate was treated with 8% trichloroacetic acid and 2.5% sodium sulphate (Na₂SO₄), followed by centrifugation at 5000 × g for 60 min to remove residues.
Chromatographic separation was achieved using a dual mobile phase system. While Phase A consisted of 10 mM disodium hydrogen phosphate (Na₂HPO₄) and 10 mM sodium tetraborate (Na₂B₄O₇) at pH 8.2, Phase B was a mixture of acetonitrile, methanol and water in a 45:45:10 (v/v/v) ratio. Derivatization was performed online through sequential injections of 20 μl each of borate buffer, o-phthalaldehyde (OPA), fluorenylmethyl chloroformate (FMOC) and the sample solution.
Fluorescence detection of Phe was enabled via OPA/FMOC-mediated derivatization, allowing sensitive and selective identification of amino acid residues. The RP-HPLC system, equipped with a fluorescence detector, facilitated analyte separation and quantification. Prior to injection, samples were purified using a volatile solvent to remove potential interfering substances and then dried under vacuum centrifugation, following the procedures described by Majidinia et al. (Reference Majidinia, Kalbasi-Ashtari and Mirsaeedghazi2022) and Wahl and Holzgrabe (Reference Wahl and Holzgrabe2016).
Preparation of sample for in vitro anti-urolithiasis assays (nucleation, growth and aggregation)
For in vitro assays (including nucleation, growth and aggregation processes), 10 g of (F-4) GMP–CW Yoghurt was homogenized with 10 ml of distilled water. The mixture was gently vortexed or stirred for 2–5 min at 20°C to ensure uniform dispersion. The pH of the sample was adjusted to 7.0 using 0.1 M NaOH to provide assay conditions. Subsequently, it was centrifuged at 5000 × g for 10 min at 4°C to remove insoluble particulates. The resulting supernatant was carefully collected and used for all experimental analyses and corresponding controls (Raj et al., Reference Raj, Rajan, Ramasamy, Goldy, Ariyamuthu, Sudhagar, Gandhi, Shoba and Gurusamy2024).
Nucleation assay
The nucleation assay was performed for the F-4 formula using a modified spectrophotometric method adapted from Bawari et al. (Reference Bawaria, AN and Tewarib2018) to evaluate the inhibitory effect of the sample on crystal CaOx formation. The reaction was conducted in a buffer (pH 6.5) containing 50 mM Tris and 150 mM NaCl. Calcium chloride (CaCl₂) and sodium oxalate (Na₂C₂O₄) solutions were prepared at 5 and 7.5 mM concentrations, respectively.
Test mixtures consisted of 1 ml CaCl₂ solution, 1 ml GMP–CW Yoghurt at varying concentrations (0.1, 0.2, 0.4, 0.6, 0.8 and 1.0 mg/ml, adjusted to 1 ml with distilled water if needed) and 1 ml Na₂C₂O₄ solution. Mixtures were incubated at 37°C for 30 min. The nucleation rate was determined by monitoring turbidity, indicative of CaOx crystal formation, using a UV–visible spectrophotometer (U2900, Thomas Edison, Singapore) at 620 nm. Optical density (OD) was measured at 0 and 30 min. A negative control (without Yoghurt) and a standard positive control (Cystone) were included in the assay (Raj et al., Reference Raj, Rajan, Ramasamy, Goldy, Ariyamuthu, Sudhagar, Gandhi, Shoba and Gurusamy2024).
Relative inhibitory activity (%) = (C n − S n)/C n × 100
where C n and S n represent the rate of free oxalate reduction in the absence and presence of GMP–CW Yoghurt, respectively.
Growth assay
The Bawari et al.’s (2016) method with slight modifications was conducted to evaluate the inhibitory effects of the (F-4) GMP–CW Yoghurt on CaOx crystal growth. Briefly, the reaction mixture consisted of 1.5 ml of 90 mM NaCl solution buffered with 10 mM Tris-HCl (pH 7.4), 1 ml of 4 mM calcium chloride (CaCl₂) and 1 ml of 4 mM sodium oxalate (Na₂C₂O₄). To this mixture, 30 μl of CaOx crystal slurry (prepared by suspending CaOx monohydrate crystals at 1.5 mg/ml in 50 mM sodium acetate buffer [pH 5.7]) was added.
Crystal formation was monitored by measuring the decrease in oxalate concentration, reflected as a reduction in absorbance at 214 nm, over 600 s using a UV–visible spectrophotometer (U2900, Thomas Edison, Singapore). The effects of GMP–CW functional food were evaluated by adding 1 ml of Yoghurt at varying concentrations (0.1, 0.2, 0.4, 0.6, 0.8 and 1.0 mg/ml) to the reaction mixture (Raj et al., Reference Raj, Rajan, Ramasamy, Goldy, Ariyamuthu, Sudhagar, Gandhi, Shoba and Gurusamy2024). A control without functional food and a standard drug (e.g., Cystone) were included for comparison. The percentage inhibition of crystal growth was calculated using the following formula:
Relative inhibitory activity (%) = (C g − S g)/C g × 100
where C g and S g are the rates of oxalate reduction in the absence and presence of GMP–CW Yoghurt, respectively (Raj et al., Reference Raj, Rajan, Ramasamy, Goldy, Ariyamuthu, Sudhagar, Gandhi, Shoba and Gurusamy2024).
Aggregation assay
The inhibitory effects of the (F-4) GMP–CW Yoghurt on CaOx crystal aggregation was evaluated using a slightly modified protocol based on Bawari et al. (2016). CaOx crystals were prepared by mixing equal volumes of 50 mmol/l calcium chloride (CaCl₂) and sodium oxalate (Na₂C₂O₄) solutions. The mixture was heated in a water bath at 60°C for 1 h and then incubated overnight at 37°C to ensure complete crystallization. The resulting crystals were dried and suspended in a buffer containing 0.05 mol/l Tris-HCl and 0.15 mol/l NaCl (pH 6.5), yielding a final concentration of 0.8 mg/ml.
For this assay, 3 ml of the CaOx crystal suspension was mixed with 1 ml of GMP–CW Yoghurt and diluted to various concentrations (0.1, 0.2, 0.4, 0.6, 0.8 and 1.0 mg/ml) as necessary. The mixtures were briefly vortexed and incubated at 37°C for 30 min. After incubation, the extent of crystal aggregation was determined by measuring the OD at 620 nm using a UV–visible spectrophotometer (U2900, Thomas Edison, Singapore) (Raj et al., Reference Raj, Rajan, Ramasamy, Goldy, Ariyamuthu, Sudhagar, Gandhi, Shoba and Gurusamy2024). The percentage inhibition of crystal aggregation was calculated using the following formula:
Relative inhibitory activity (%) = (C a − S a)/C a × 100
where C a and S a are the OD of crystal suspension in the presence and absence of GMP–CW Yoghurt, respectively (Raj et al., Reference Raj, Rajan, Ramasamy, Goldy, Ariyamuthu, Sudhagar, Gandhi, Shoba and Gurusamy2024).
Sensory evaluation of GMP–CW Yoghurt
The sensory criteria, including colour, aroma/flavour, taste, texture and overall acceptability of GMP–CW Yoghurt (F-4), were systematically assessed. The experimental protocol of this study was reviewed and approved by the relevant university authorities and implemented in accordance with institutional regulations and approved procedures. Prior to participation, all panellists gave informed consent, and a preliminary orientation session was held to explain the sensory evaluation process and assessment criteria. Sensory assessment was conducted by a panel of 20 trained assessors who were trained and familiarized with the sensory characteristics of conventional low-fat Yoghurt prior to evaluation. The prepared samples were coded and presented in a randomized order to minimize potential bias. For this test, a 5-point hedonic scale with scores of 1–5 corresponding to ‘very poor’, ‘poor’, ‘moderate’, ‘good’ and ‘excellent’ was compared with typical low-fat Yoghurt. The panel evaluated colour, aroma/flavour, taste, texture and overall acceptability with established sensory analysis methodologies (Rodrigues et al., Reference Rodrigues, Dias and Teixeira2024).
Statistical analysis
All formulations were stored at 4°C for 14 days. All physicochemical measurements were conducted in triplicate for each batch. Randomized analyses were conducted on days 1, 7 and 14 of storage. Then one-way analysis of variance was performed using GraphPad® Prism version 9.4 (USA). Differences were considered statistically significant at P < 0.05.
Results and discussion
Antioxidant properties of GMP, CW and ascorbic acid (as control) solutions
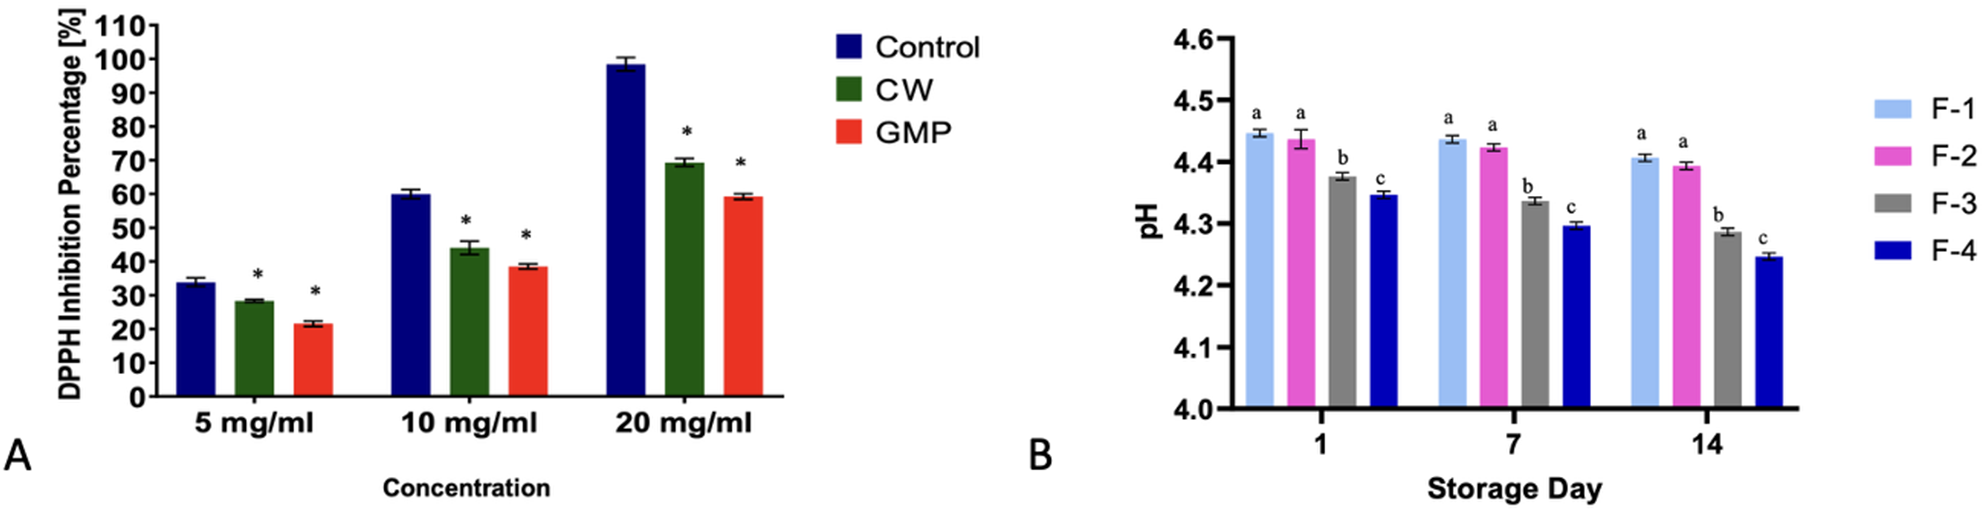
The DPPH assay (Fig. 1A) revealed a clear concentration-dependent increase in radical scavenging activity for ascorbic acid, CW and GMP over the range 5–20 mg/ml. As expected, ascorbic acid exhibited the highest inhibition. Among the test ingredients, CW demonstrated significantly greater antioxidant capacity than GMP at all concentrations tested.
(A) Changes in DPPH inhibition (%) for three aqueous solutions of ascorbic acid (control), CW and GMP, each one made with 5, 10 and 20 mg/ml concentrations after 14 days at 4°C. The star (*) signs show that the CW solutions had significantly (P < 0.05) higher inhibition power for scavenging free radicals than GMP treatments. (B) Changes in pH of four formulations of GMP–CW Yoghurt during 1, 7 and 14 days of storage at 4°C. Values are presented as mean (±SEM), and different superscript letters (a–d) within the same day indicate significant differences (P < 0.05; Tukey’s test).

Figure 1 Long description
A grouped bar chart with the horizontal axis label, concentration, with categories 5 milligram per milliliter, 10 milligram per milliliter and 20 milligram per milliliter. The vertical axis label is DPPH inhibition percent, with a range from 0 to 110. A legend lists Control, CW and GMP. At 5 milligram per milliliter, the bars are approximately 35 for Control, 30 for CW and 25 for GMP. At 10 milligram per milliliter, the bars are approximately 55 for Control, 45 for CW and 40 for GMP. At 20 milligram per milliliter, the bars are approximately 100 for Control, 70 for CW and 60 for GMP. The image B showing a grouped bar chart with the horizontal axis label, Storage Day, with categories 1, 7 and 14. The vertical axis label is pH, with a range from 4.0 to 4.6. A legend lists F-1, F-2, F-3 and F-4. At day 1, the bars are approximately 4.50 for F-1, 4.45 for F-2, 4.48 for F-3 and 4.35 for F-4. At day 7, the bars are approximately 4.45 for F-1, 4.40 for F-2, 4.43 for F-3 and 4.30 for F-4. At day 14, the bars are approximately 4.40 for F-1, 4.35 for F-2, 4.38 for F-3 and 4.25 for F-4. The image C showing a grouped bar chart with the horizontal axis label, Storage Day, with categories 1, 7 and 14. The vertical axis label is Syneresis, W W percent, with a range from 0 to 12. A legend lists F-1, F-2, F-3 and F-4. At day 1, the bars are approximately 10.5 for F-1, 11.0 for F-2, 8.5 for F-3 and 8.0 for F-4. At day 7, the bars are approximately 9.0 for F-1, 9.5 for F-2, 8.5 for F-3 and 8.0 for F-4. At day 14, the bars are approximately 8.0 for F-1, 8.5 for F-2, 7.5 for F-3 and 7.8 for F-4. The image D showing a grouped bar chart with the horizontal axis label, Storage Day, with categories 1, 7 and 14. The vertical axis label is TPC, milligram GAE per gram, with a range from 20 to 27. A legend lists F-1, F-2, F-3 and F-4. At day 1, the bars are approximately 25.0 for F-1, 25.0 for F-2, 26.5 for F-3 and 27.0 for F-4. At day 7, the bars are approximately 22.0 for F-1, 23.0 for F-2, 26.0 for F-3 and 26.5 for F-4. At day 14, the bars are approximately 21.0 for F-1, 21.5 for F-2, 24.0 for F-3 and 25.0 for F-4.
At 20 mg/ml, CW achieved 69.32 ± 1.17% inhibition, consistent with previously reported ranges (46–82%) for coconuts of varying maturity, supporting the robustness and reproducibility of its antioxidant profile. This activity is attributable to its natural content of vitamin C and phenolic constituents, which act as effective hydrogen donors and redox modulators (Shayanthavi et al., Reference Shayanthavi, Kapilan and Wickramasinghe2024).
Although GMP is less potent than CW, it exhibited substantial radical scavenging activity, reaching up to 59% at 20 mg/ml. This result agrees with researchers’ findings (Lammi et al., Reference Lammi, Bollati, Fiori, Li, Fanzaga, D’adduzio, Tosi, Burlina, Zuccotti and Verduci2023). Its antioxidant function is linked to specific amino acid residues and bioactive peptide sequences capable of stabilizing free radicals and chelating pro-oxidant metal ions. Emerging evidence further suggests that GMP-derived peptides may contribute to oxidative stress attenuation through modulation of lipid peroxidation and endogenous antioxidant defences (Lammi et al., Reference Lammi, Bollati, Fiori, Li, Fanzaga, D’adduzio, Tosi, Burlina, Zuccotti and Verduci2023; Majidinia et al., Reference Majidinia, Majidinia and Kalbasi-Ashtari2026b).
While both CW and GMP were less active than the pure ascorbic acid (reference compound), their inhibition levels exceeding 50% indicate biologically meaningful antioxidant capacity. The combined presence of phytochemical and peptide-based redox mechanisms highlights the complementary functionality of the CW–GMP combination in Yoghurt and supports its integration into metabolically targeted functional foods designed for clinical nutrition applications (Majidinia et al., Reference Majidinia, Alabdali, Panneerselvam, Ranganathan, Chinnappan and Mani2025; Matemu et al., Reference Matemu, Nakamura and Katayama2021).
Nutritional components, pH and texture of CW–GMP Yoghurt during cold storage
According to Table 2, the proximate composition of the CW–GMP Yoghurt formulations (F-1 to F-4) differed significantly (P < 0.05) from the commercial low-fat Yoghurt. Across the four formulations, dry matter decreased from 14.93% to 13.14%, whereas moisture increased from 85.07% to 86.86%. Correspondingly, the measured protein, fat and carbohydrate contents showed a decreasing trend from F-1 to F-4.
Proximate composition analysis of different coconut milk-based Yoghurt-like formulas on day 1 (24 h after fermentation at 4°C, data represent triplicate determinations)*

Table 2 Long description
Proximate composition is reported for yoghurt samples F-1 through F-4, plus low-fat yoghurt and dairy based low phe yoghurt, using columns for dry matter percent, humidity percent, protein percent, fat percent, and carbohydrate percent. For F-1, values are 14.93 plus or minus 0.08 dry matter, 85.07 plus or minus 0.02 humidity, 3.61 plus or minus 0.05 protein, 0.91 plus or minus 0.01 fat, and 6.34 plus or minus 0.03 carbohydrate, each marked with superscript a. For F-2, values are 14.34 plus or minus 0.03 dry matter, 85.66 plus or minus 0.03 humidity, 3.12 plus or minus 0.03 protein, 0.94 plus or minus 0.01 fat, and 6.15 plus or minus 0.01 carbohydrate, with superscript b. For F-3, values are 13.67 plus or minus 0.06 dry matter, 86.33 plus or minus 0.06 humidity, 2.63 plus or minus 0.05 protein, 0.88 plus or minus 0.02 fat, and 5.52 plus or minus 0.02 carbohydrate, with superscript c. For F-4, values are 13.14 plus or minus 0.04 dry matter, 86.86 plus or minus 0.01 humidity, 2.34 plus or minus 0.05 protein, 0.80 plus or minus 0.01 fat, and 5.12 plus or minus 0.02 carbohydrate, with superscript d. Low-fat yoghurt lists 12.05 dry matter, 87.95 humidity, 4.11 protein, 1.47 fat, and 6.47 carbohydrate, and dairy based low phe yoghurt lists 17 dry matter, 83 humidity, 2.99 protein, 3.27 fat, and 6.15 carbohydrate.
Notes: *Values are presented as mean (±SEM), and different superscript letters (a–d) within the same column indicate significant differences (P < 0.05; Tukey’s test).
**Commercial composition of plain low-fat Yoghurt obtained from Dannon (https://www.dannon.com).
Interestingly, F-1 and F-2 exhibited significantly higher protein and dry matter contents than F-3 and F-4, despite the latter formulations containing a higher GMP concentration (3% versus 2.5%) before fermentation. Since protein recovery and nitrogen partitioning during fermentation were not evaluated in the present study, the mechanisms underlying this observation cannot be conclusively determined. However, the higher moisture content of F-3 and F-4 suggests that compositional dilution associated with greater water retention within the gel matrix may have contributed to the lower protein concentration (wet-weight basis). Similar observations have been reported in fermented protein systems, where differences in water-holding capacity can influence the apparent concentrations of proximate components without necessarily reflecting changes in the absolute amount of protein present (Ran et al., Reference Ran, Pang, Li, Zhao, Zhang, Li and Yang2024).
The lower moisture content observed in F-1 and F-2 indicates reduced water retention within the fermented matrix. In acid-induced protein gels, weaker hydration and water-binding properties can result in a greater proportion of total solids per unit mass of product, thereby increasing the measured concentrations of protein and other nutrients on a wet-weight basis. Conversely, the higher moisture content of F-3 and F-4 suggests improved water incorporation and retention within the gel network.
Among the tested formulations, F-4 displayed compositional characteristics most comparable to those of commercial low-fat Yoghurt. Its moisture content (86.86%) closely approached that of the commercial product (87.95%), indicating the formation of a hydrated and stable gel matrix. Although F-4 exhibited lower protein concentration than F-1 and F-2, its overall balance of moisture and solids suggests that matrix organization and water-holding capacity played important roles in determining the final product characteristics.
Comparison with the dairy-based low-phenylalanine Yoghurt reported by Goldar et al. (Reference Goldar, Givianrad and Shams2016) further highlights these differences. That formulation contained a higher dry matter (17%), lower moisture (83%) and greater fat content (3.27%), together with starch, inulin, non-dairy creamer, permeate, butter and transglutaminase as structural modifiers. The higher solids content in that product was therefore largely attributable to ingredient fortification and textural enhancers rather than fermentation-induced gel formation alone.
Collectively, these findings indicate that the compositional characteristics of CW–GMP Yoghurt were strongly influenced by water retention and matrix organization during fermentation. Unlike conventional low-phenylalanine Yoghurt formulations that rely on multiple stabilizers and fat replacers, the present formulations achieved Yoghurt-like properties primarily through the interaction of GMP, CW and lactic acid fermentation. Among the formulations evaluated, F-4 provided the closest compositional resemblance to commercial low-fat Yoghurt while maintaining reduced fat content and a lower-phenylalanine profile.
pH evolution and post-fermentation acidification
All CW–GMP formulations exhibited a progressive decline in pH during 14 days at 4°C, reflecting sustained but controlled post-fermentation activity (Fig. 1B). Statistical analysis showed that formulations F-3 and F-4 had significantly lower pH values (P < 0.05) compared with F-1 and F-2. This finding indicates enhanced LAB activity in the presence of GMP, supporting its functional role as a fermentation enhancer (Bierzuńska et al., Reference Bierzuńska, Cais-Sokolińska and Yiğit2019). The higher protein content in F-3 and F-4 not only improved the nutritional environment for microbial growth but also promoted the formation of a more cohesive gel network with superior water-holding capacity. The retained moisture within the Yoghurt-like matrix likely acted as a favourable medium for sustaining microbial metabolic activity throughout storage (Arab et al., Reference Arab, Yousefi, Khanniri, Azari, Ghasemzadeh-mohammadi and Mollakhalili-meybodi2023). The greater moisture loss observed during fermentation in F-3 and F-4 likely limited the availability of an aqueous medium necessary for sustained LAB activity, resulting in reduced lactic acid production and a more moderate decline in pH (Ran et al., Reference Ran, Pang, Li, Zhao, Zhang, Li and Yang2024). These observations highlight the dual role of protein not only as a nutritional component but also as a critical structural determinant influencing physicochemical stability and microbial dynamics in Yoghurt analogues (Mahomud et al., Reference Mahomud, Katsuno, Zhang and Nishizu2017).
Acidification proceeded more gradually than in conventional dairy Yoghurt, consistent with plant-based Yoghurt analogues (Harper et al., Reference Harper, Dobson, Morris and Moggré2022). This moderate pH reduction is largely attributable to the absence of lactose, the primary substrate for L. delbrueckii subsp. bulgaricus in conventional Yoghurt processing. In lactose-containing matrices, continued lactose metabolism drives post-acidification; in contrast, its absence in CW inherently limits lactic acid production, preventing excessive pH decline during storage.
The residual acidification observed in the CW–GMP Yoghurt was supported by naturally occurring simple sugars (glucose, fructose and sucrose), which are fermentable but less efficient substrates for classical Yoghurt starters. Similar slow but steady pH reductions have been reported in fermented coconut-based systems, where restricted carbohydrate availability constrains acidification kinetics (Han et al., Reference Han, Ewe, Kuan and Yeo2022; Qadi et al., Reference Qadi, Mediani, Benchoula, Wong, Misnan and Sani2023). Minor acetic acid formation during incubation and storage, as described in coconut-derived Yoghurt analogues (Daszkiewicz et al., Reference Daszkiewicz, Michalak and Śmiecińska2024), may further contribute to the gradual decrease in pH and indicate ongoing metabolic activity.
GMP appeared to reinforce microbial stability. Beyond functioning as a phenylalanine-free protein source, it supplies readily utilizable peptides and branched-chain amino acids, supporting LAB viability and metabolic persistence. Its glycosylated fractions may additionally exert prebiotic-like effects, enhancing survival under refrigerated conditions (Arab et al., Reference Arab, Yousefi, Khanniri, Azari, Ghasemzadeh-mohammadi and Mollakhalili-meybodi2023; Limbad et al., Reference Limbad, Gutierrez Maddox, Hamid, Kantono and Higgins2024).
Collectively, these findings demonstrate that in lactose-free Yoghurt analogues, controlled acidification can be achieved through alternative fermentable sugars and peptide-derived nitrogen sources. Such moderated post-fermentation activity is technologically advantageous, minimizing over-acidification while preserving microbial viability and structural stability during storage.
Syneresis evaluation of CW–GMP Yoghurt
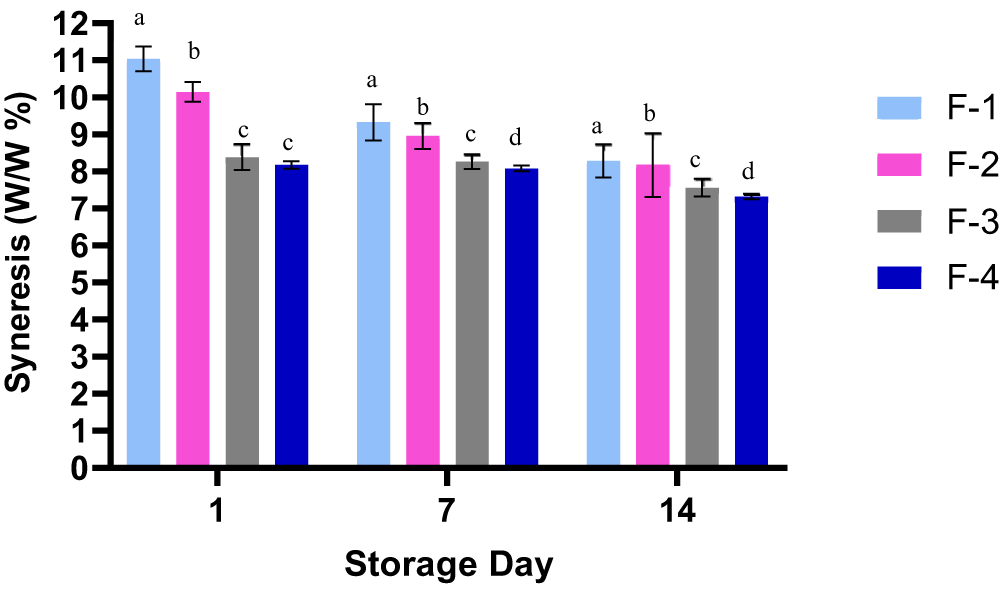
Syneresis is a key indicator of gel integrity, reflecting the ability of a fermented matrix to retain immobilized water during storage. As shown in Fig. 2, all CW–GMP formulations exhibited a progressive decline in syneresis during 14 days of 4°C storage. This reduction in serum separation suggests improved water retention within the fermented matrix over time and may reflect continued structural rearrangement of the gel network during storage (Arab et al., Reference Arab, Yousefi, Khanniri, Azari, Ghasemzadeh-mohammadi and Mollakhalili-meybodi2023; Estévez et al., Reference Estévez, Mejia, Figuerola and Escobar2010).
Changes in syneresis of different GMP–CW Yoghurt dessert formulas during storage on 1, 7 and 14 days at 4°C. Values are presented as mean (±SEM), and different superscript letters (a–d) within the same day indicate significant differences (P < 0.05; Tukey’s test).

Figure 2 Long description
The grouped bar graph has the x axis label, Storage Day, with categories 1, 7 and 14. The y axis label is, Syneresis left parenthesis W over W percent right parenthesis, with a range from 0 to 12. A legend lists four series: F minus 1, F minus 2, F minus 3 and F minus 4. At storage day 1, four bars are shown with error bars and letter annotations above the bars. F minus 1 is about 11 with letter a. F minus 2 is about 10 with letter b. F minus 3 is about 8.5 with letter c. F minus 4 is about 8.2 with letter c. At storage day 7, four bars are shown with error bars and letter annotations above the bars. F minus 1 is about 9.3 with letter a. F minus 2 is about 8.9 with letter b. F minus 3 is about 8.3 with letter c. F minus 4 is about 8.1 with letter d. At storage day 14, four bars are shown with error bars and letter annotations above the bars. F minus 1 is about 8.3 with letter a. F minus 2 is about 8.2 with letter b. F minus 3 is about 7.6 with letter c. F minus 4 is about 7.4 with letter d.
Formulations F-3 and F-4 exhibited significantly lower syneresis after 14 days (7.56 ± 0.24% and 7.32 ± 0.07%, respectively) than F-1 and F-2, indicating superior water-holding capacity. The lower syneresis observed in these formulations may be associated with their higher GMP content and the resulting increase in total solids. Previous studies have reported that increased protein concentration and total solids can reduce water mobility and improve moisture retention in fermented gel systems by promoting a denser matrix structure (Pachekrepapol et al., Reference Pachekrepapol, Kokhuenkhan and Ongsawat2021; Rafiq et al., Reference Rafiq, Zahoor, Sagheer, Khalid, Ur Rahman and Liaqat2019; Wong et al., Reference Wong, Wicklund, Bridges, Whaley and Koh2020). However, the specific molecular interactions responsible for the improved water retention were not investigated in the present study.
It is also possible that interactions among GMP, cornstarch and ι-carrageenan contributed to the observed reduction in syneresis. Previous research has suggested that protein–polysaccharide associations may enhance water retention and gel stability in non-dairy fermented products. In particular, the carbohydrate-containing structure of GMP has been proposed to influence hydration behaviour and network formation in complex food matrices (Majidinia et al., Reference Majidinia, Kalbasi-Ashtari and Mirsaeedghazi2022). Nevertheless, such mechanisms were not directly evaluated in the current study and therefore should be regarded as potential explanations rather than confirmed effects.
A similar relationship between increased solids content and reduced syneresis was reported for low-phenylalanine dairy Yoghurt by Goldar et al. (Reference Goldar, Givianrad and Shams2016), where cornstarch and inulin supplementation were considered important contributors to water retention and structural stability. In contrast, the present CW–GMP Yoghurt formulations achieved comparable reductions in syneresis without using extensive dairy-derived structural components. Collectively, these findings suggest that higher total solids and improved water retention were associated with enhanced storage stability in the CW–GMP Yoghurt formulations. However, the precise structural mechanisms deserve further investigation using dedicated rheological and microstructural analyses.
Viability of LAB
LAB viability is a critical indicator of the functional integrity of Yoghurt-like systems. Throughout 14 days of 4°C storage, all CW–GMP formulations maintained stable populations of approximately 7 log CFU/g, remaining within the recommended viability range of 6–8 log CFU/g required to confer probiotic benefits (Table 3) (Pachekrepapol et al., Reference Pachekrepapol, Kokhuenkhan and Ongsawat2021; Zahrani et al., Reference Zahrani and Shori2023).
Viability of probiotic bacteria (LAB) of GMP-CW yogurt was evaluated on 1, 7, and 14 days at 4°C. (data represents the average of three replicate determinations for each formula and day of storage)

Table 3 Long description
Viability values are listed for four formulas, F 1 through F 4, across three rows labeled Day 1, Day 2, and Day 3, with each cell reported as a mean with plus or minus SEM and a superscript letter. On Day 1, F 1 is 7.65 plus or minus 0.04 with superscript a, F 2 is 7.67 plus or minus 0.01 with superscript a, F 3 is 7.90 plus or minus 0.02 with superscript b, and F 4 is 7.91 plus or minus 0.04 with superscript b. On Day 2, F 1 is 7.58 plus or minus 0.032 with superscript a, F 2 is 7.62 plus or minus 0.02 with superscript a, F 3 is 7.85 plus or minus 0.02 with superscript b, and F 4 is 7.89 plus or minus 0.02 with superscript b. On Day 3, F 1 is 7.53 plus or minus 0.08 with superscript a, F 2 is 7.59 plus or minus 0.01 with superscript a, F 3 is 7.84 plus or minus 0.04 with superscript b, and F 4 is 7.85 plus or minus 0.05 with superscript b. From Day 1 to Day 3, each formula shows a small decrease in the reported mean value. Superscripts are a for F 1 and F 2 and b for F 3 and F 4 on each day.
Notes: *Values are presented as mean (±SEM), and different superscript letters (a–d) within the same row indicate significant differences (P < 0.05; Tukey’s test). Different superscripts (a and b) in different rows were significantly different (P <0.05), Tucky test.
This sustained viability demonstrates that the CW–GMP matrix provides a supportive microenvironment for bacterial survival under refrigerated conditions. Notably, formulations F-3 and F-4 exhibited significantly higher counts than F-1 and F-2, underscoring the positive contribution of increased GMP incorporation (Qu et al., Reference Qu, Park and Dallas2023; Shakerian et al., Reference Shakerian, Razavi, Ziai, Khodaiyan, Yarmand and Moayedi2015).
Beyond its role as a protein source, GMP supplies bioactive peptides and sialylated oligosaccharide residues that may serve as fermentable substrates and metabolic modulators. In contrast to some starch-rich coconut-based Yoghurt formulations, where restricted water availability and nutrient diffusion may negatively affect LAB survival during storage, the present GMP–CW Yoghurt maintained microbial stability throughout the storage period. The relatively high moisture content of the formulation, together with the availability of fermentable carbohydrates from CW and accessible nitrogen from GMP, may have provided favourable conditions for LAB persistence and viability (Milesi et al., Reference Milesi, Bergamini and Hynes2011; Rackerby et al., Reference Rackerby, HNM, Haymowicz, Dallas and Park2024).
Given that clinical evidence in previous study which supports the role of Yoghurts enriched with Bifidobacterium and Lactobacillus strains and prebiotic components in alleviating IBS Irritable Bowel Syndrome and PKU-related GI symptoms (Chen et al., Reference Chen, Yuan, Xie, Wang, Feng, Xiao and Zheng2023; Liao et al., Reference Liao, Su and Zhang2022; Qu et al., Reference Qu, Park and Dallas2023), the maintained viability observed in this study may strengthen the functional relevance of the CW–GMP formulation. Collectively, these findings position the system as a technologically stable, LAB-rich, fermented matrix with potential application in specialized nutritional strategies.
Total antioxidant capacity (FRAP) during storage
The FRAP of the GMP–CW Yoghurt analogues decreased moderately during 14 days of refrigerated storage, reflecting the progressive loss of reducing capacity commonly observed in fermented food systems. This decline may be attributed to oxidative degradation of phenolic constituents and structural modifications of bioactive peptides during storage. In protein-enriched fermented matrices, proteolytic activity can initially generate antioxidant peptides with electron-donating properties; however, prolonged storage may further degrade these peptides or alter their structure, resulting in reduced ferric ion reducing capacity (Çalişkanlar et al., Reference Çalişkanlar, Saygili, Karagözlü and Karagözlü2024).
Despite this general decline, formulations containing higher concentrations of GMP (F-3 and F-4) consistently exhibited significantly (P < 0.05) greater FRAP values than F-1 and F-2 throughout storage, maintaining values above 26 mM Fe2⁺ equivalents after day 14 cold storage. The enhanced antioxidant activity of F-3 and F-4 can be directly attributed to their higher GMP content, which provides a greater reservoir of bioactive peptide sequences and sialylated glycans with reducing and radical-scavenging properties. During fermentation, proteolytic enzymes from LAB can release antioxidant peptides from GMP, increasing the availability of amino acid residues capable of donating electrons and neutralizing reactive oxygen species. Furthermore, the higher protein content of these formulations may contribute additional reducing groups that enhance ferric ion reduction.
These findings are consistent with previous studies reporting that increasing concentrations of milk-derived bioactive proteins and peptides enhance antioxidant activity in fermented dairy products through the release of redox-active peptide fractions during fermentation and storage (Aloğlu et al., Reference Aloğlu and Öner2011; Taha et al., Reference Taha, El Abd, De Gobba, Abdel-hamid, Khalil and Hassan2017). Therefore, the superior FRAP values observed in F-3 and F-4 suggest that GMP concentration is a key determinant of antioxidant capacity in the present formulations, contributing to greater oxidative stability and preservation of bioactive functionality throughout refrigerated storage.
Overall, GMP enrichment improved the antioxidant resilience of CW-based Yoghurt analogues by attenuating the decline in reducing power during storage. These results indicate that formulations with higher GMP levels may better retain their functional properties over time, supporting their potential application as stable antioxidant-rich functional foods.
Phenylalanine composition of GMP–CW Yoghurt
The optimized formulation was selected based on its physicochemical properties, highest antioxidant activity, LAB viability and lowest syneresis. Because all formulations differed marginally in GMP (the primary source of residual phenylalanine) and starch concentrations, the phenylalanine contents of the other formulations were expected to be like or lower than F-4. Accordingly, analysis of the optimized formulation F-4 was considered sufficient to confirm achievement of the targeted low-phenylalanine profile.
The HPLC chromatogram (Fig. 3) verified that the F-4 CW–GMP formulation contained 84.03 ppm phenylalanine, equivalent to 8.403 mg/100 g Yoghurt. This concentration is markedly lower than that reported for conventional low-fat dairy Yoghurt (∼286 mg/100 g), reflecting the absence of casein as a dominant phenylalanine source and confirming the effectiveness of the CW–GMP matrix in minimizing aromatic amino acid load.
(A) The peaks of phenylalanine obtained from F-4 (the best formula for GMP–CW Yoghurt). (B) The retention times of Phe in Yoghurt sample were completely equal to its standard solution (24.731 retention times).

From a dietary management perspective, a 500 g serving would deliver approximately 42 mg phenylalanine, representing ∼14% of a 300 mg/day allowance for young children with PKU and ∼5% of an 800 mg/day allowance for adults. These values indicate that the product can be integrated into structured PKU meal plans with substantial portion flexibility while maintaining metabolic control, a critical factor in preventing neurotoxicity and long-term cognitive impairment associated with elevated phenylalanine levels (Ney et al., Reference Ney, Gleason, Van Calcar, MacLeod, Nelson, Etzel, Rice and Wolff2009; Van Wegberg et al., Reference Van Wegberg, MacDonald, Ahring, Bélanger-quintana, Beblo, Blau, Bosch, Burlina, Campistol, Coşkun and Feillet2025; Zaki et al., Reference Zaki, El-wakeel, Ebeid, Ez Elarab, Moustafa, Abdulazim, Karara and Elghawaby2016).
Previous attempts to reduce phenylalanine in Yoghurt systems, such as those reported by Goldar et al. (Reference Goldar, Givianrad and Shams2016), relied on a combination of GMP with ultrafiltered milk permeate, achieving reductions (24.09–27.64 mg/100 g) but remaining intrinsically dependent on milk protein fractions (Goldar et al., Reference Goldar, Givianrad and Shams2016). In contrast, the present approach establishes a non-dairy CW matrix structured primarily with GMP, reducing phenylalanine to 8.403 mg/100 g without enzymatic cross-linking or residual casein contributions. Beyond compositional modification, this strategy integrates low-phenylalanine design with demonstrated antioxidant and anti-urolithiasis functionality, representing a substantive advancement in the development of metabolically tailored Yoghurt analogues for therapeutic nutrition.
Anti-urolithiasis assay results using nucleation, growth and aggregation of GMP–CW Yoghurt (F-4)
The nucleation, growth and aggregation assays (Fig. 4A–C) demonstrated a clear dose-dependent inhibitory effect of the GMP–CW Yoghurt on CaOx crystallization. Across all concentrations tested, the formulation significantly reduced crystal formation; the 1 mg/ml concentration consistently produced the greatest inhibition, reaching 30.87% (nucleation), 33.24% (growth) and 36.85% (aggregation).
Crystallized CaOx inhibition (%) made by GMP–CW Yoghurt in comparison with the Cystone compound in the (A) nucleation, (B) growth and (C) aggregation assays. Data represent triplicate determinations, and values are presented as mean (±SEM).

Figure 4 Long description
Three grouped bar graphs comparing the inhibition percentages of Cystone and F-4 across different assays. The horizontal axis for all graphs is labeled concentration in milligram per milliliter, with values 1, 0.8, 0.6, 0.4, 0.2 and 0.1. The vertical axis is labeled inhibition percentage, ranging from 0 to 100 percent. In the nucleation inhibition assay, Cystone shows the highest inhibition at 1 milligram per milliliter, approximately 90 percent and the lowest at 0.1 milligram per milliliter, around 20 percent. F-4 shows lower inhibition, with approximately 50 percent at 1 milligram per milliliter and 10 percent at 0.1 milligram per milliliter. In the growth inhibition assay, Cystone again shows higher inhibition, peaking at about 85 percent at 1 milligram per milliliter and decreasing to 15 percent at 0.1 milligram per milliliter. F-4 ranges from 45 percent at 1 milligram per milliliter to 5 percent at 0.1 milligram per milliliter. In the aggregation inhibition assay, Cystone′s inhibition is highest at 1 milligram per milliliter, approximately 80 percent and lowest at 0.1 milligram per milliliter, around 10 percent. F-4 shows about 40 percent inhibition at 1 milligram per milliliter and 5 percent at 0.1 milligram per milliliter. Overall, Cystone consistently shows higher inhibition than F-4 across all assays, with the largest differences observed at higher concentrations. The legend differentiates Cystone and F-4.
As expected, the reference anti-urolithiasis formulation Cystone showed substantially stronger activity, with inhibition rates of 84.96%, 86.70% and 89.79% in the respective assays. This difference aligns with our a priori hypothesis: as a functional food matrix rather than a concentrated pharmacological preparation, the GMP–CW Yoghurt would exhibit moderate yet biologically meaningful anti-crystallization capacity, approximating one-third to one-fourth of the potency of a standardized therapeutic agent.
Importantly, this moderate inhibition may represent a translational advantage. Unlike pharmacological interventions intended for acute management, a functional formulation with milder but consistent activity may be suitable for long-term dietary incorporation and support recurrence prevention while minimizing safety and tolerability concerns. In this context, the observed anti-nucleation, anti-growth and anti-aggregation effects are mechanistically relevant, as these stages are central to CaOx stone pathogenesis (Karr et al., Reference Karr, Guptha, Bell and Thenell2024; Pinipay et al., Reference Pinipay, Rokkam, Botcha and Tamanam2026).
Cystone was selected as a positive control due to its well-documented anti-crystallization and renoprotective properties in in vitro CaOx models, providing a recognized benchmark for biological relevance. Notably, to our knowledge, the GMP–CW Yoghurt represents the first functional food system reported to directly interfere with CaOx nucleation, growth and aggregation, suggesting a promising adjunctive nutritional strategy for urolithiasis prevention (Pawar et al., Reference Pawar and Vyawahare2015).
The observed inhibition of CaOx nucleation, growth and aggregation (>30%) may be attributed to the combined properties of GMP and CW, although the specific mechanisms were not directly investigated in the present study. Previous studies have suggested that mild acidic conditions and the presence of naturally occurring inhibitors may influence CaOx crystallization processes (Fishman et al., Reference Fishman, Green, Lynch, Choudhury, Eshghi and Konno2013; Patel et al., Reference Patel, Jiang, Asplin, Granja, Capretz, Osann, Okhunov, Landman and Clayman2018).
CW contains several constituents, including citrate, magnesium and potassium, which have been associated with reduced stone formation. Citrate has been reported to bind calcium ions and reduce CaOx supersaturation. On the other hand, magnesium may decrease crystal formation through interactions with oxalate and by promoting the formation of more soluble complexes (Kumar et al., Reference Kumar, Geetha and Kumar2022; Patel et al., Reference Patel, Jiang, Asplin, Granja, Capretz, Osann, Okhunov, Landman and Clayman2018). These properties may have contributed to the inhibitory effects observed in the present study.
In addition, both CW and GMP have demonstrated antioxidant properties in previous studies. Since oxidative stress has been implicated in renal epithelial injury and crystal retention, these antioxidant activities may provide an additional indirect benefit in the context of urolithiasis prevention. However, no cellular or in vivo assessments were performed in the present study, and such mechanisms remain speculative. Overall, the results suggest that the CW–GMP formulation has potential anti-urolithiasis activity in vitro, but further studies are needed to confirm the underlying mechanisms and their physiological relevance.
Sensory analysis of GMP–CW Yoghurt
Table 4 presents the sensory evaluation results for the optimized F-4 GMP–CW Yoghurt formulation.
Overall sensory scores of 20 panellists for important properties of F-4 GMP–CW Yoghurt*

Table 4 Long description
Organoleptic properties are reported with a Mean and a Standard Deviation for colour, texture, taste, and overall acceptability. Colour has a mean of 4.05 with a standard deviation of plus or minus 0.68. Texture has a mean of 4.25 with a standard deviation of plus or minus 0.69. Taste has a mean of 4.65 with a standard deviation of plus or minus 0.58. Overall acceptability has a mean of 4.20 with a standard deviation of plus or minus 0.82.
Note: The attached Supplementary Materials show detailed results of this sensory evaluation.
Among the evaluated attributes, taste received the highest mean score (4.65 ± SD), indicating strong palatability and a well-balanced flavour profile. The reduced sweetness associated with higher GMP incorporation did not negatively affect consumer acceptance and may have contributed to favourable sensory perception. Texture also achieved a high score (4.25 ± SD), reflecting the desirable consistency of the product. This finding is consistent with the low syneresis observed in the F-4 formulation, as reducing whey separation is generally associated with improved textural quality and consumer acceptance of Yoghurt.
Colour received a slightly lower score (4.05 ± SD) compared with taste and texture but remained within the acceptable range, indicating that the appearance of the product was well accepted by the panellists. The overall acceptability score of 4.20 ± SD demonstrated a high level of consumer acceptance, reflecting the combined positive perception of flavour, texture and appearance.
Collectively, these findings indicate that the F-4 GMP–CW Yoghurt possesses beneficial sensory characteristics and good consumer acceptability, supporting its potential as a functional food product for specific dietary applications (Rodrigues et al., Reference Rodrigues, Dias and Teixeira2024).
Conclusion and future perspective
This study presents a structurally lactose-free fermented Yoghurt in which CW and GMP were purposefully combined to produce a low-phenylalanine, reduced-sugar dessert suitable for individuals with metabolic disorders.
The optimized formulation (F4) achieved a balanced compositional profile (2.34% protein, 0.8% fat, 5.12% carbohydrate) with high physicochemical stability comparable to low-fat Yoghurt. Controlled post-acidification, low syneresis (∼7.3%), sustained LAB viability (∼7.8 log CFU/g) and robust antioxidant capacity (>26 mM Fe2⁺ equivalents during early storage) collectively demonstrate that the CW–GMP matrix maintained both structural stability and bioactive properties during refrigerated storage.
Importantly, the phenylalanine content was limited to 8.403 mg/100 g, remaining below the clinically recommended safe range for individuals with PKU. In addition, the formulation consistently inhibited CaOx nucleation, growth and aggregation by more than 30% in vitro study. Although the mechanisms underlying these effects were not directly investigated in the present study, they may be associated with the combined physicochemical properties of GMP, the mineral composition of CW, the mildly acidic matrix and the antioxidant activity of the formulation, as suggested by previous studies. Overall, these findings support the potential of this fermented product as a multifunctional food and provide a basis for future studies investigating its mechanisms of action and in vivo efficacy.
Supplementary material
The supplementary material for this article can be found at https://doi.org/10.1017/S0022029926102568.
Acknowledgements
The authors express their sincere appreciation to Mr Reza Majidinia, Founder of Tarnobaft Neghsheh Jahan Company (Tehran, Iran), for his generous technical support of this research. The authors also gratefully acknowledge Mr Mostafa Bashash, Director of the PBDG Research Institute (Tehran, Iran), for his valuable cooperation in the HPLC and microbial analyses of the samples.
Declaration of interest
The authors declare that they have no conflict of interest regarding the publication of this article.