

Exploring Cahokia's Southwest Margins
Cahokia (11S34), Native North America's largest urban center north of Mexico, sits in the American Bottom floodplain of what is now southern Illinois (Baires and Baltus Reference Baires and Baltus2017; Baires et al. Reference Baires, Baltus and Malouchos2017; Kelly and Brown Reference Kelly, Brown, Creekmore and Fisher2014; Pauketat Reference Pauketat2004; Pauketat et al. Reference Pauketat, Fortier, Alt and Emerson2013). Home to some 200 earthen mounds (which extend to the west to include those located in the city's two additional boroughs of East St. Louis and St. Louis), human-made borrow pits, plaza spaces, causeways, and neighborhoods, Cahokia coalesced around AD 1050, ushering in a new era of urbanism characterizing what would become the Mississippian Midwest. It reached its largest population and densest occupation by the mid-twelfth century AD. It has been assumed that people started to move away from Cahokia during the late fourteenth century, triggering a depopulation of the area and a partial abandonment of Downtown Cahokia (see Baltus Reference Baltus2014; Pauketat Reference Pauketat1998). This time frame is marked by a well-established chronological sequence built on amassed radiocarbon dates and a detailed ceramic chronology that coincides with changes in structure size and shape over time (see Collins Reference Collins1990; Emerson et al. Reference Emerson, Koldehoff and Brennan2018; Holley Reference Holley1989).
In this article we present new magnetometry data from two minimally surveyed areas located in what Melvin Fowler (Reference Fowler1997:Figure 6.27) designated as Section Seven, or the southwest corner of the Cahokia precinct. Magnetometry surveys are a particularly useful tool for detecting subsurface features in the American Bottom, and methods are well established for the region (Baires et al. Reference Baires, Baltus and Malouchos2017; Barrier and Horsley Reference Barrier and Horsley2014; Betzenhauser Reference Betzenhauser2011; Buchanan Reference Buchanan2015; Friberg et al. Reference Friberg, Wilson, Bardolph, Wilson, Flood, Hipskind, Pike and Esarey2021; Hargrave Reference Hargrave2011; Stauffer et al. Reference Stauffer, Grooms, Hu, Mersmann, Kidder and Henry2023). The survey areas include the Rouch Mound Group area and the area west of Rattlesnake Mound Group. Rouch Mound Group is located 1.3 km from the “Downtown Core,” which included Monks Mound, the Grand Plaza and associated mounds, the Rattlesnake Causeway, and Mound 72. The area located west of the Rattlesnake Group, which we refer to as “Rattlesnake West,” is located 1.7 km away, substantially removed from the day-to-day activities of Cahokia's Downtown (Figure 1; Fowler Reference Fowler1997; Pauketat Reference Pauketat1998; Stauffer et al. Reference Stauffer, Grooms, Hu, Mersmann, Kidder and Henry2023; see also Holley et al. Reference Holley, Dalan and Watters1992). Neighborhood occupational history is little understood from Fowler's Section Seven of the site. With the exception of survey and test excavation conducted by George Holley and colleagues (Reference Holley, Dalan and Watters1992), no fieldwork (excavation or survey) has taken place in either locale, leaving archaeologists with a limited understanding of habitation trends over time.
Geophysical Survey areas of Rouch Mound Group and Rattlesnake West located on the western boundaries of Cahokia Mounds State Historic Site, Collinsville, Illinois.

Due to modern disturbances like tree lines and the CMX railroad tracks that isolate the southern part of the site from the north, it is difficult to determine what would have been visible to the inhabitants who occupied these areas in the past. It is likely that Monks Mound and associated mounds were recognizable on the horizon, as were marker posts and plumes of smoke from community hearth fires. However, it is unclear how the inhabitants of this portion of the site would have participated in the “goings on” in Downtown Cahokia (Pauketat Reference Pauketat1998; Stauffer et al. Reference Stauffer, Grooms, Hu, Mersmann, Kidder and Henry2023). Part of the reason that these two areas were targeted for geophysical survey is because of their distance from the central core and their proximity to peripheral mound groups such as Rouch and Rattlesnake. The Rouch Mound Group consists of Mounds 69, 70, and 71, as documented and mapped by Patrick (see Fowler Reference Fowler1997:137–141). Mound 69 is a small circular mound nearly gone from the landscape today; Mound 70 is a large platform mound that, in 1876, was recorded as being 12.2 m high; and Mound 71 is a small circular mound barely identifiable in aerial photographs. All three were subject to cultivation, with Mound 70 serving as a platform for a farmhouse and other smaller associated buildings. The mounds were eventually purchased by the state of Illinois for inclusion in the Cahokia Mounds State Historic Site boundaries (Fowler Reference Fowler1997:141).
Similarly, the Rattlesnake Mound Group occupies the southernmost part of the Cahokia State Historic Site and includes the large ridgetop Rattlesnake Mound and a series of small circular mounds identified on recent lidar imaging conducted by the Illinois State Archaeological Survey (Baires Reference Baires2017; Pauketat Reference Pauketat2020). Rattlesnake Mound and its associated circular mounds are also the nexus of the Rattlesnake Causeway, which orients the city to its five-degree offset grid (Baires Reference Baires2014, Reference Baires2017; Pauketat Reference Pauketat, Sullivan and Mainfort2010; Romain Reference Romain2021). Pauketat and colleagues (Reference Pauketat, McCullough, Alt, Kruchten, Wilson, Farkas, Bandy, Malouchos and Buchanan2023) argue that most of the circular mounds at Cahokia were likely flat-topped to support circular architecture like sweat lodges. The Rattlesnake West survey area is isolated from the Downtown Core and buffered on its western edge by a privately owned and cultivated field and to the south by Forest Boulevard. Rattlesnake West was also cultivated into the early 2000s (Historic Aerials Reference Historic2023). During our survey conducted during the summer of 2023, Rattlesnake West showed signs of being used by hunters; a hunting blind was placed near the boundary between the privately owned and state-protected land, and evidence of four-wheeler tracks were apparent in the freshly mowed brush; our geophysical survey also revealed a large quantity of “scattershot” in the northeast section of the survey area. The CMX railroad tracks are directly to the north, cutting off direct access to this parcel from Cahokia Mounds State Historic Site trails. Access to Rattlesnake West is via a town turnoff monitored by Washington Park town maintenance employees.
Following Holley and colleagues (Reference Holley, Dalan and Watters1992), we recognize that it is difficult to determine whether a habitation area or mound group was truly “isolated” at Cahokia. The Cahokia precinct was densely populated between the Lohmann and Stirling phases with estimates of some 10,000–16,000 people (Pauketat and Lopinot Reference Pauketat, Lopinot, Pauketat and Emerson1997; see also Emerson Reference Emerson, Emerson, Koldehoff and Brennan2018) living in the city core. Yet, one cannot ignore the seemingly peripheral location of both the Rouch Group and Rattlesnake West as determined by the topography itself. Rouch is isolated from the Downtown Core by a “slough feature and topographic lows separating it from areas of higher elevation” (Holley et al. Reference Holley, Dalan and Watters1992:36), whereas Rattlesnake West is similarly buffered by a north–south running drainage to the north (along which the Rouch Group is situated) and a braided drainage to the east. Perhaps these areas, seasonally inundated with water, provided a natural barrier between these locations and the central parts of the city. The presence of mounds in the Rouch Group may indicate a “localization of activities” for this part of the city where the pairing of two circular and one platform mound likely served as an anchor for households there (Holley et al. Reference Holley, Dalan and Watters1992:36). Rattlesnake West is not immediately anchored by mounds, but the Rattlesnake Mound complex, located some 600 m to the east, is visible on the horizon, and the Rouch Mound Group is just over 300 m to the north. As one of the largest and earliest constructed mounds at the city (Baires Reference Baires2017), Rattlesnake Mound would likely have been visible to the inhabitants of Rattlesnake West throughout the occupation of this area, thereby connecting this “peripheral” community to Cahokia via the Rattlesnake Causeway (Mersmann and Stauffer Reference Mersmann, Stauffer, Stauffer, Giles and Lambert2022).
Cahokia's unique architectural grammar encompasses small and large square structures; rectilinear buildings; T- and L-shaped buildings; small, circular sweat lodges; and large circular rotundas (Alt Reference Alt and Pauketat2001, Reference Alt2018; Baires et al. Reference Baires, Baltus and Malouchos2017; Betzenhauser and Pauketat Reference Betzenhauser and Pauketat2019). One well-recognized hallmark of Cahokia's neighborhoods is the temporally specific reorganization of the courtyard-oriented Terminal Late Woodland (TLW) buildings to the Cahokia grid around AD 1050; this grid formed a somewhat rigid orientation pattern that aligned to the city's five-degree offset. In the Cahokia precinct, neighborhoods began to reorganize into mound and plaza groups or were replaced by public architecture about AD 1100 (Collins Reference Collins1990; Pauketat Reference Pauketat2005, Reference Alt2018; see also Kelly and Brown Reference Kelly, Brown, Creekmore and Fisher2014). Neighborhood organization in the East St. Louis precinct followed a slightly different trajectory, with a grid-like pattern of cardinally oriented structures throughout the twelfth century and a final shift to a local courtyard focus during the thirteenth century, perhaps reflecting an inward approach to create more close-knit communities as that particular precinct was largely depopulated (Betzenhauser and Pauketat Reference Betzenhauser and Pauketat2019). Thirteenth-century neighborhoods in the Cahokia precinct were variably abandoned or reorganized, with a potential return to cardinal orientations early in the Moorehead phase (Baltus Reference Baltus2014).
In addition to correlating to temporal changes at Cahokia, this architectural diversity contributed to the “elemental characteristics of districts—thought to include both civic-ceremonial or ritual-residential zones and neighborhoods—within the central Cahokian precincts” (Betzenhauser and Pauketat Reference Betzenhauser and Pauketat2019:134; see also Pauketat Reference Pauketat, Emerson, Koldehoff and Brennan2018). For example, mound and plaza groups likely were home to politically and religiously oriented neighborhoods as the building types associated with them typically fell within what Emerson (Reference Emerson1997) identified as Cahokia's “architecture of power.” Outside of these mound-and-plaza groups, in the more peripheral locations like those discussed earlier, neighborhoods may or may not have been associated with any particular monumental mound construction but still may contain one or two politically or religiously important buildings. Without a mound complex to anchor these communities, perhaps these “special” buildings served a similar purpose as the mounds and plazas (Betzenhauser and Pauketat Reference Betzenhauser and Pauketat2019). The extent to which these peripheral neighborhoods adhered to a Cahokian way of being, as manifested in their architectural diversity, may help us more fully delineate the ways persons participated in physically and ideologically building and maintaining Cahokia. What kinds of things and relationships did community members bring with them to Cahokia, and how did they shape and structure each residential neighborhood? That question guided our research as we attempted to discern neighborhood makeup based on the types of buildings and their orientation, as identified using noninvasive geophysical techniques. The types of buildings present in a neighborhood embody community relationships by which inhabitants participate in daily activities as structured by their built landscape.
Geophysical Methods
In July 2015, Elizabeth Watts Malouchos and Leslie Drane conducted a magnetometry survey of the Rouch Mound Group area with a Bartington Grad 601-2 Dual Fluxgate Gradiometer provided by Indiana University. Data were collected from eight 30 × 30 m grids, which covered an area of 7,200 m2. Walking the grids in a zigzag pattern, readings were collected at 0.125 m intervals along 0.5 m traverses. Data processing was done with TerraSurveyor using several steps. First the data were “clipped” to five standard deviations from the mean (between 16.84 and −18.39 nanoteslas [nT]). Second, the data were “de-striped,” which removed major instrument- and operator-caused data defects. Third, the data were “de-staggered,” which corrected data calculation errors caused by the operator moving inconsistently across the survey area. Fourth, a low-pass Gaussian filter was applied to the data, which reduced noise by essentially removing low-frequency components in the survey area. Finally, the data were “de-spiked” to remove spikes caused by historic metal anomalies in the survey area.
In the summer of 2023, Skousen conducted the magnetometry survey of the Rattlesnake West area. The methods were generally similar to those used in the Rouch survey. Data were collected with a Bartington Grad 601-2 Dual Fluxgate Gradiometer provided by the Illinois State Archaeological Survey (ISAS). Before the survey was conducted, the area was mowed by Cahokia Mounds Historical Site groundskeepers to ensure the area could be surveyed with minimal obstacles. Data were collected from 86 20 × 20 m grids, which covered an area of 34,400 m2. Skousen walked the grids in a zigzag pattern, and readings were collected along 0.5 m traverses at 0.125 m intervals. Data were downloaded and processed using TerraSurveyor with similar steps as described earlier: the data were “clipped” to five standard deviations from the mean (between 6.41 and −6.77 nT), de-striped, and de-staggered. Unlike the Rouch data, the Rattlesnake West data were not filtered or de-spiked. However, there was an abundance of high nT readings, all of which likely represented historic metal with extremely strong magnetic signatures, including an entire survey block on the north edge of the survey area near the railroad tracks, a strong bipolar anomaly representing the base of a windmill, and likely scattershot scattered near the west edge of the area. Therefore, we deleted the highest readings in the Rattlesnake West data—in general, any pixel with an original reading over ±10 nT—to accentuate the more subtle readings that likely represented architectural features. Deleting these higher readings pixel by pixel was ideal because it allowed for a more “surgical” removal of historic clutter; applying a blanket de-spiking or a filter would have removed higher readings associated with potential TLW or Mississippian anomalies in other parts of the survey area. Overall, the selective deletion of these higher values made subtle architectural anomalies slightly more visible.
After processing, magnetic anomalies were classified into either monopolar positive, dipolar simple, or dipolar complex categories (Burks Reference Burks2004). We did not mark potential anomalies with fuzzy outlines or those that could be possible “noise” in the data. Additionally, clearly stronger, more distinct anomalies were located throughout the data. Some of the smaller anomalies—for example, the scattering of small but strong dipoles in the northwest portion of the survey area—are undoubtedly pieces of historic metal fragments or scattershot (related to the nearby hunting blind mentioned earlier). Although historic metal fragments are apparent in both survey areas, the largest, strongest anomalies are in the Rattlesnake West survey area; for instance, several extremely strong anomalies are situated on the north edge of the survey area and are likely associated with modern railroad tracks. One distinct dipolar anomaly near the center of the survey area is likely the buried base of a windmill or small tower that was since dismantled. There are also natural features in the Rattlesnake West area that were historically modified, including a shallow north–south running drainage in the north-central part of the survey area that shows evidence of channelization at the northern end. We skipped survey blocks that overlapped the base of this drainage because we assumed that TLW or Mississippian features would likely not exist here. Other natural features, apparently the remnants of a braided drainage system, are evident in the eastern part of the survey area. The presence of these historic and natural anomalies is problematic because the potential architectural anomalies—the focus of this analysis—are relatively faint, and they are masked by the strength of the historic and natural anomalies, as well as the overall background noise of the survey area.
Despite these anomalies and noise, TLW and Mississippian subsurface features are visible in both the Rouch and Rattlesnake West survey areas (Figures 2 and 3). Some of the small, circular monopolar and dipolar anomalies probably represent pits, hearths, and earth ovens; because these are not the subject of the current analysis, they are unmarked. Numerous potential architectural features were identified in the data based on their magnetic signature, rectilinear shape, and overall size (Baires et al. Reference Baires, Baltus and Malouchos2017); they are much like architectural features identified in other magnetometry surveys conducted at Mississippian sites in the Midwest and Southeast, including Cahokia (Baires et al. Reference Baires, Baltus and Malouchos2017; Barrier and Horsley Reference Barrier and Horsley2014; Betzenhauser Reference Betzenhauser2011; Buchanan Reference Buchanan2015; Davis et al. Reference Davis, Walker and Blitz2015; Friberg et al. Reference Friberg, Wilson, Bardolph, Wilson, Flood, Hipskind, Pike and Esarey2021; Hargrave Reference Hargrave2011; Horsley et al. Reference Horsley, Wright and Barrier2014; King et al. Reference King, Walker and Reilly2021; Miller et al. Reference Miller, McCullough and Skousen2019; Watts Reference Watts2020; Watts Malouchos et al. Reference Malouchos, Elizabeth, Schurr and Herrmann2021). Some of the darker, more distinct rectilinear anomalies are probably structure basins, and fainter outlines of rectilinear shapes may be architectural features like wall trenches. Some rectilinear shapes clearly overlap others, which is not surprising given that structure superpositioning is well documented at Cahokia and surrounding complexes (Brennan Reference Brennan2018; Collins Reference Collins1990; Pauketat Reference Pauketat1998, Reference Pauketat2013). Circular anomalies, likely circular buildings (sweat lodges and rotundas) that are common in the Cahokia region, are visible in both areas. We were conservative in identifying potential structures because of the faintness of the architectural signatures, the strength of the disturbances and historic metal, and the overall background noise of the survey areas; it is possible that many more structures exist that were not marked.
Geophysical Results, Rouch Mound Group Area, Cahokia Mounds State Historic Site.

Geophysical Results, Rattlesnake West Area, Cahokia Mounds State Historic Site.

Structure metrics were measured from the outer edge or limit of the basin or architecture, whichever was visible in the magnetometry data, although it is worth noting that more anomalies that may represent structure basins are apparent in the Rouch data. Because floor lengths and widths of excavated Mississippian buildings in the Cahokia region are generally measured from the center or interior line of opposing wall trenches (Brennan Reference Brennan2018; Collins Reference Collins1990; Pauketat Reference Pauketat1998, Reference Pauketat2013), our method of measuring structure floors from geophysical data typically provides larger floor areas: the extent of a structure's basin is larger than the floor area when measured from actual architectural elements. Additionally, it is not always possible to determine whether the outline of a potential structure in geophysical data is the basin fill or wall trenches. The length-to-width ratios are not as affected by this issue, because those ratios of basins and structure floors generally correspond to each other (Watts Reference Watts2020); the measurement of area, in contrast, is potentially affected and has been accounted for in the statistical analysis described later. Finally, we calcuated the estimated density of structures by dividing the number of potential structures by the area surveyed, converting the unit of measurement to hectares first to provide comparability with other regional data (Brennan and Betzenhauser Reference Brennan, Betzenhauser and Brennan2018).
Statistical Methods
Our methods largely followed those outlined in Baires and colleagues (Reference Baires, Baltus and Malouchos2017). We compiled data on area and length–width (LW) ratios of structures from well-reported excavations from Tracts 15A and 15B; ICT-II at Cahokia; and the North Side, South Side, and New Mississippi River Bridge excavations at East St. Louis (Betzenhauser Reference Betzenhauser2018; Brennan Reference Brennan2018; Collins Reference Collins1990; Fortier Reference Fortier2007; Pauketat Reference Pauketat1998, Reference Pauketat2005, Reference Pauketat2013). We also argue that the BBB Motor and Sponemann sites have been artificially dissected from Cahokia proper (separated by modern development); therefore, we include that data as part of Cahokia (Emerson and Jackson Reference Emerson and Jackson1984; Fortier et al. Reference Fortier, Maher and Williams1991; Jackson et al. Reference Jackson, Fortier and Williams1992). From this dataset, we removed structures not identified by component or ambiguous in their identification to a single component—that is, reported as Lohmann/Stirling or Stirling/Moorehead—as well as structures missing their length or width measurements. We also removed structures with areas greater than 100 m2 because they likely denote oversized public buildings. In addition to potentially skewing the data due to their large size, we excluded certain public buildings like circular buildings, rotundas, and shrines that tended to have anachronistic architectural features (Alt and Pauketat Reference Alt and Pauketat2017). We likewise removed Mississippian (Lohmann through the Moorehead phase) structures with areas less than 10 m2 because these were likely nondomestic storage structures (Pauketat et al. Reference Pauketat, Fortier, Alt and Emerson2013).
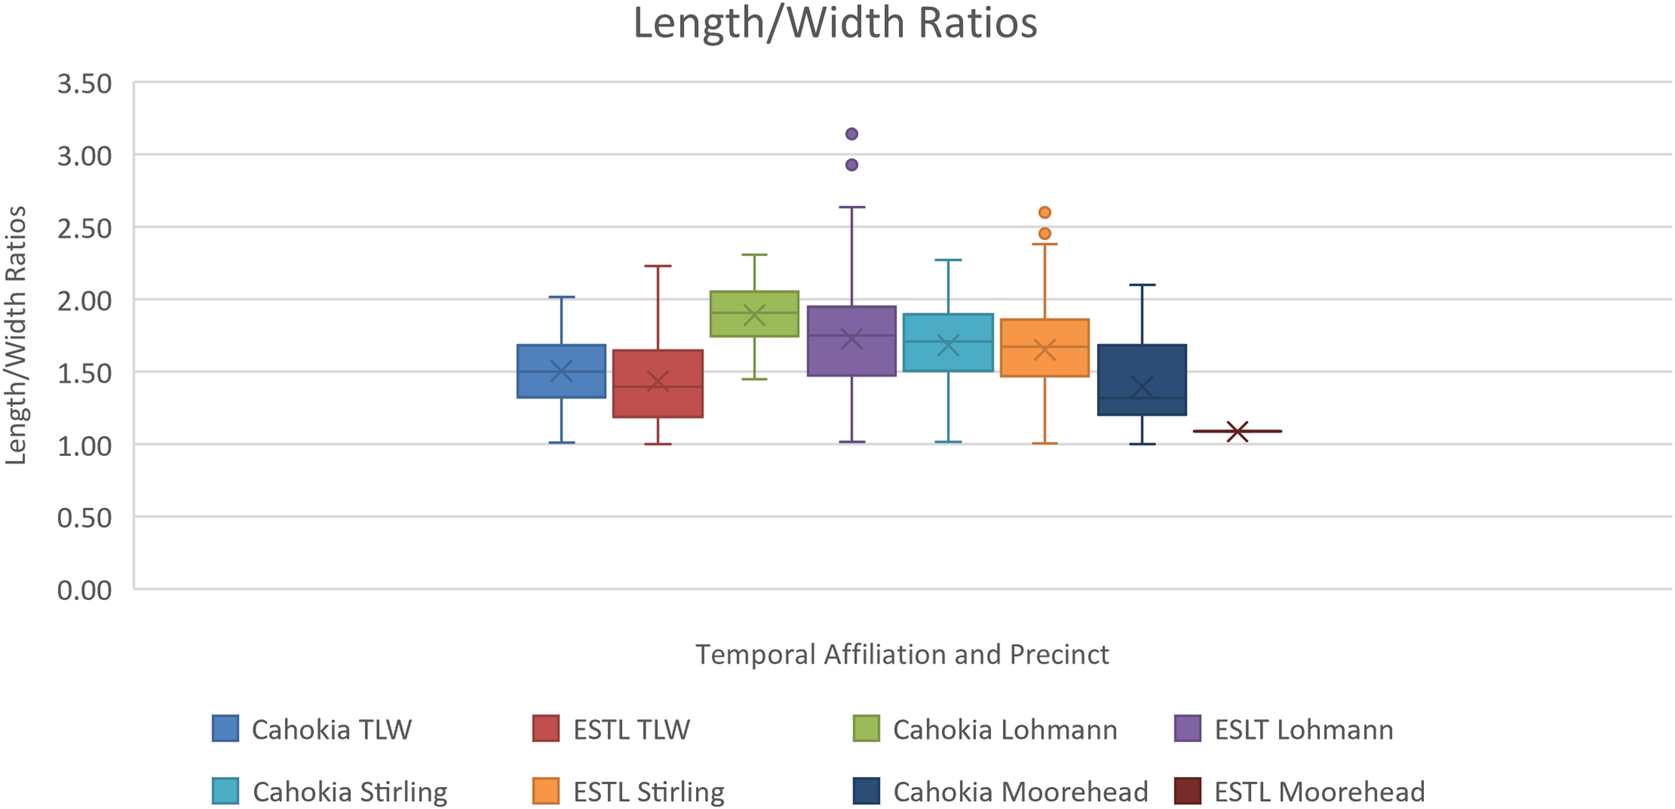
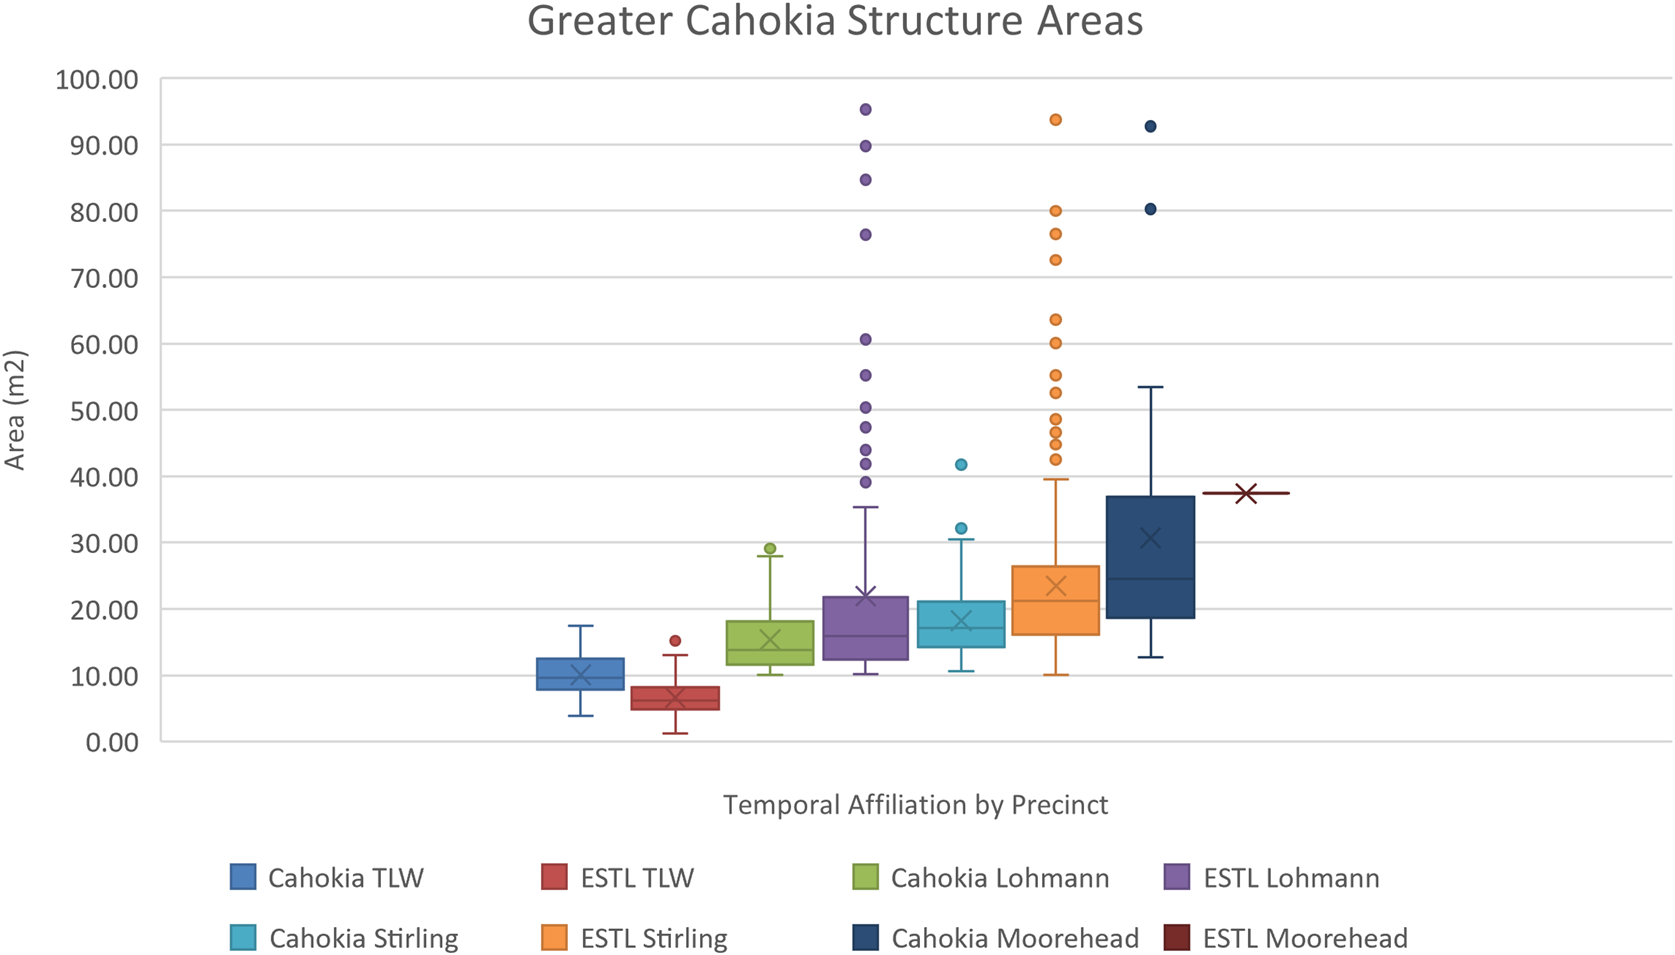
Box plots were created in Excel for both area and LW ratios for each temporal phase to identify and remove additional outliers in the dataset. To explore potential variation between precincts, box plots were also created for each time period by precinct (Figures 4 and 5). Independent t-tests comparing the mean length and mean width of structures between Cahokia and ESTL were run for each phase of occupation.
Greater Cahokia Length and Width Ratios of reported structures from excavations at Tracts 15A and 15B, ICT-II at Cahokia Mounds State Historic Site and the North Side, South Side, and New Mississippi River Bridge excavations at the East St. Louis Mound Group by temporal affiliation.

Greater Cahokia Structure Areas of reported structures from excavations at Tracts 15A and 15B, ICT-II at Cahokia Mounds State Historic Site and the North Side, South Side, and New Mississippi River Bridge excavations at the East St. Louis Mound Group by temporal affiliation.

To account for the scalar difference between area and LW ratios, we used the logarithm of area in our subsequent cluster and regression analyses. We ran a k-means cluster analysis in SPSS with the entire dataset (using both Cahokia and ESTL data), with maximum iterations set to 15 and convergence criterion of 0.01 for four clusters. This was mapped against the clusters of structures by their assigned temporal affiliation. Because of the variability between precincts discussed later, the cluster analysis was run again with just the Cahokia data (ESTL removed), providing results similar to those reported in Baires and colleagues (Reference Baires, Baltus and Malouchos2017).
Given the differences between Cahokia and ESTL described in the results section, we determined it would be most appropriate to use only the Cahokia data in creating the regression equations. We plotted regression charts comparing structures by temporal affiliation, where y = LW ratios and x = LogArea (Supplemental Figure 1). Using the resulting regression equations, we calculated the expected LW ratio (y’) in Excel for the new datasets: Rouch and Rattlesnake West. Subtracting y’ from the measured LW ratio (y) provided the residuals used to model potential temporal affiliation.
Finally, we took into consideration the potential for error introduced by measuring the length and width of potential structures from the magnetometry data, which reflects the size of the magnetic anomalies. Because the anomaly could either be basin fill or the floor/wall trenches of a potential structure, we calculated the average difference between basin size and floor size using the dataset for the region that reported both measurements: ESTL (Supplemental Table 1; Brennan Reference Brennan2018). We subtracted the average difference per temporal phase from our initial estimated length and width measurements for anomalies identified at Rouch and Rattlesnake West to provide a second set of modeled temporal affiliations.
Results
A total of 92 potential structures were identified in the survey data from Rattlesnake West, and 45 potential structures were identified in the survey data from the Rouch Mound group area. The calculation of structure density provides an estimate of 26.7 structures/ha for Rattlesnake West and 62.5 structures/ha for Rouch, spread over four temporal phases.
Comparison of the Cahokia Precinct and the ESTL Precinct datasets shows variation in the size of their buildings for different time periods. For example, TLW structures at ESTL are on average smaller than those in the Cahokia precinct, although beginning in the Lohmann phase, ESTL structures become larger (see Figure 5). A similar trend is noted in the LW ratios: TLW structures and Lohmann structures at ESTL are more square than those in the Cahokia precinct (see Figure 4). By the Stirling phase, ESTL structures are still larger overall, but the proportions between precincts are roughly the same (see Figures 4 and 5). Independent t-tests demonstrate that the differences in structures between Cahokia and ESTL are statistically significant for one or both variables (length and width) for most time periods (Supplemental Table 2), though data for Moorehead-phase structures at ESTL are too limited to provide comparison. That is why we only selected the Cahokia precinct buildings to create the regression.
Our modeled assignment of temporal affiliation for structures from the Rouch group initially returned an unexpectedly large number of possible Moorehead buildings (Table 1). From the initial regression data, uncorrected for potential measurement skew, one-third (33%) were identified as TLW, 4% Lohmann, 11% Stirling, and nearly half (49%) as Moorehead; one anomaly had the potential to be either TLW or Stirling and another Lohmann/Stirling. Adjusting for potential error introduced by measuring length and width of a basin versus the floor changed some of the temporal assignments, largely for the Lohmann and Moorehead phases: roughly one-third of the anomalies were then identified as TLW, another third as Moorehead, and the remainder evenly split between Lohmann and Stirling (Table 1).
Regression Residuals for Rouch Mound Group.

Note: Uncorrected for measurement highlighted in orange; corrected for measurement highlighted in green.
Before correction for potential skew, the Rattlesnake West Group had similar proportions; nearly one-quarter (24%) were identified as TLW structures, 11% Lohmann, 14% Stirling, and more than half (52%) as Moorehead (Table 2). After correction, anomalies were roughly evenly identified as TLW, Lohmann, or Stirling (16% or 17% each), whereas potential Moorehead-phase structures continued to dominate at just under 50%; one anomaly was identified as potentially Lohmann or Stirling and another as Stirling or Moorehead (see Table 2).
Rattlesnake West Regression Residuals.

Note: Uncorrected for measurement in orange; corrected for measurement in green.
Discussion and Conclusion
The geophysical surveys and statistical analyses of the Rouch and the Rattlesnake West neighborhoods in the southwestern part of Cahokia indicate that neighborhoods were likely occupied through the entire sequence of Cahokia. The Rouch neighborhood seems to have been more densely occupied than Rattlesnake West, although the presence of a seasonal wetland in the center of the area surveyed and the overall difficulty in identifying potential architectural anomalies in Rattlesnake West may have contributed to the difference in density. Variation in structure numbers between the two neighborhoods is also notable in the TLW to Lohmann phases. The Rouch neighborhood potentially had a larger TLW occupation, which decreased during the Lohmann phase, whereas the Rattlesnake West neighborhood had a smaller TLW occupation, with consistency in the number of structures into the Lohmann and Stirling phases. Both neighborhoods had comparable proportions of potential Lohmann and Stirling structures and a larger-than-expected number of possible Moorehead-phase structures. This seeming overabundance of Moorehead structures was initially thought to be a result of skew introduced by measuring subsurface anomalies from geophysical data results; however, after correction, the large number of possible Moorehead structures remained. A caveat should be offered for these potential Moorehead-phase structures: large square structures often identified as “council houses” are known for the entirety of the Mississippian sequence at Greater Cahokia (Betzenhauser and Pauketat Reference Betzenhauser and Pauketat2019). It is notable, however, that the largest structures by area for the Rouch neighborhood (Features 34 and 35) and for Rattlesnake West (Features 25, 35, 41, 46, and 57) were all identified as possibly dating to the Lohmann and Stirling phases.
The results from this geophysical survey and subsequent statistical analysis provide important insight into the chronological makeup and density of these two areas of Section Seven at Cahokia; in some ways, they run counter to the accepted narrative of a drastic depopulation and deurbanization of this city in the Late Stirling to Moorehead phases. Of course, our results are generated through noninvasive techniques, and excavation is necessary to obtain a fully accurate assessment of the structures and their chronological affiliation. However, our methods do provide a trusted and thoughtful means to obtain a reliable set of data without excavating into a protected heritage site. As such, the course of occupation based on our survey suggests a commitment to place into the Moorehead phase, evidenced by the notable presence of 30%–50% of the buildings for both areas dating to this late phase.
Regionally, our survey suggests that we must reconsider the neighborhood dynamics of late-phase occupation at Cahokia, particularly in those areas located on the periphery of the city's Downtown Core. Perhaps city inhabitants in these regions were less tied to the goings on of the Monks Mound / Grand Plaza areas and chose to invest more in their local neighborhoods and infrastructure. Maintaining a connection to place during the Moorehead phase is evidenced elsewhere at Tract 15B where late-phase buildings were rebuilt and occupied prior to the post–AD 1350 intentional destruction of the neighborhood (Pauketat Reference Pauketat2013). Interestingly, the building along the southern face of Rattlesnake Mound—a wall trench structure measuring roughly 6 × 4 m—dates to the late Stirling or early Moorehead phase and may have served to reorient Rattlesnake Mound to the late-phase orientation of Cahokia residential and public buildings (Baires Reference Baires2017).
Radiocarbon dates for the construction and use of Rouch Mound Group are not available. However, the survey conducted by Holley and colleagues (Reference Holley, Dalan and Watters1992) suggests, based on ceramics recovered from the plow zone, a TLW through Late Stirling domestic occupation oriented around the mounds. Additionally, their analysis of the mound group orientations indicates an “inward-looking perspective for this mound group” (Holley et al. Reference Holley, Dalan and Watters1992:38). It is possible that the builders of these mounds created a complex focused on their particular neighborhood, rather than aligning it with the broader Cahokian five-degree offset orientation. The possible localization of Moorehead-phase neighborhoods may in part result from earlier events that had the potential to create internal divisions within the city. A late eleventh-century conflagration in the East St. Louis precinct coincided with its initial depopulation (Brennan Reference Brennan2018; Pauketat Reference Alt2018; Pauketat et al. Reference Pauketat, Fortier, Alt and Emerson2013) and the construction of the palisade around the Downtown Core of the Cahokia precinct (Holley et al. Reference Holley, Lopinot, Dalan and Woods1990; Iseminger et al. Reference Iseminger, Pauketat, Koldehoff, Kelly and Blake1990; Krus Reference Krus2016). Dalan and colleagues (Reference Dalan, Holley, Woods, Watters and Koepke2003) describe the potential for the palisade to physically dive Downtown Cahokia, reflecting a broader fragmentation within the larger community. Although some have suggested that the thirteenth-century changes occurring at Cahokia demonstrated a shift in leadership strategy from a focus on corporate groups and communal action to one emphasizing individual leadership and elite status (Trubitt Reference Trubitt2000), others describe these transformations as part of a revitalization movement centered on returning to early practices of emergent Cahokia (Baltus Reference Baltus2014; Pauketat et al. Reference Pauketat, Fortier, Alt and Emerson2013).
The peripheries of Cahokia, such as Rattlesnake West and the Rouch Mound Group, can help us rethink the occupational history of this city. Based on the data presented here, these areas maintained a sense of community, albeit in varying ways over time, moving us away from traditional narratives of Cahokia collapse and abandonment to narratives of resilience and change.
Acknowledgments
Thank you to Lori Belknap and the Cahokia Mounds State Historic Site for permission to survey and gain access to the site area; permission was granted by the Illinois Department of Natural Resources on May 25, 2023, and the Illinois Historic Preservation Office (APRPA-06-2023). Thank you as well to Susan Alt, Indiana University, for her generous loan of the geophysical equipment to survey the Rouch Mound group.
Funding Statement
The survey of Rattlesnake West was supported by the National Science Foundation (NSF) under Grants 2218006 and 2218078.
Data Availability Statement
All data are on file with the authors at their respective institutions.
Competing Interests Statement
The authors declare none.
Supplemental Material
For supplemental material accompanying this article, visit https://doi.org/10.1017/aaq.2024.62.
Supplemental Figure 1. Structure temporal clusters with regression lines.
Supplemental Table 1. Average Difference in Length and Width Measurements between Basin and Floor.
Supplemental Table 2. Probability Values for Independent t-Test Comparing ESTL and Cahokia Structures.