

INTRODUCTION
With rapid secularization (Martin Reference Martin1978) and the declining social and cultural relevance of religion (Bruce Reference Bruce2013; Reference Bruce2014; Wilson Reference Wilson1966), the United Kingdom (UK) has witnessed major changes in the nature and extent of religious identification over the past few decades. High levels of atheism and agnosticism combined with comparatively low levels of religious identification and participation make the UK one of the “most secular nations on earth today” (Zuckerman, Galen, and Pasquale Reference Zuckerman, Galen and Pasquale2016, 79). Yet while there is a rich and growing scholarship on the causes and consequences of the decline of organized religion in the UK, there has been relatively little analysis of the growing non-religious segment of UK society. Who are the “religious nones”? How do they think and act in the religious, social, and political realms? And just how do they differ in their views from the religiously-affiliated?
One of the most significant changes in recent years has been the large decline in the proportion of adults in Britain (excluding Northern Ireland) professing some form of Christian affiliation (Clements Reference Clements2014). Data from the British Social Attitudes (BSA) surveys show that those identifying as Anglican fell from 40% in 1983 to 17% in 2014 (NatCen 2015), while Catholics declined from 10% to 8% of the adult population. The proportion with some other Christian identity remained at 17% (in both 1983 and 2014) (NatCen 2015), but the proportion of Nonconformists declined while the numbers identifying as Christian but without a specific denominational affiliation increased. A second key development has been an increase in levels of identification with non-Christian religions, from 2% in 1983 to 8% in 2014 (NatCen 2015). This shift reflects both changing patterns of inward migration and broader demographic shifts. A third key development, which forms the focus of this article, is the growing segment of society not professing any religious identity — the “religious nones.” Based on the BSA data, they increased from 31% in 1983, to 38% in 1994, 43% in 2004, and to about half in the most recent surveys (2009–2014) (NatCen 2015).
For the UK and other countries “in the midst of secular transition … the dominant trend in nearly all Western countries is the rise of non-religion” (Voas and McAndrew Reference Voas and McAndrew2012, 47). Even though these trends have gathered pace in recent years — a declining level of religious affiliation and a corresponding growth in the “religious nones” — there have been few quantitative analyses of the latter group using up-to-date and nationally-representative survey data of the general adult population (exceptions being: Woodhead Reference Woodhead2014; Voas and Day Reference Voas, Day, Kosmin and Keysar2007; for a qualitative approach, see Lee Reference Lee2015; Reference Lee2014). The most recent major studies of socio-political attitudes of religious groups have treated the “religious nones” as an undifferentiated category (Clements Reference Clements2015; Steven Reference Steven2011), partly due to limitations with the measurement of religious affiliation in existing academic surveys. While there is a well-developed base of scholarly knowledge regarding the areas of similarity and difference — and trends of convergence and divergence over time — in the attitudes of the religiously-affiliated and unaffiliated, much less is known about those within the latter group who may profess different group identities, such as atheists and agnostics, and how they differ among themselves as well as in comparison with established religious identities. This is an area that surely requires careful and robust empirical examination in the UK using representative survey data. As Smith and Baker (Reference Smith and Baker2015, 2) have noted:
Over the past decade it has become obvious for a number of reasons that the religiously unaffiliated and those who are irreligious need to be studied in a more systematic manner. A major part of the need for this comes from the realization that the religiously unaffiliated or disaffiliated compose a substantial and growing portion of the population in many countries.
Smith and Baker (Reference Smith and Baker2015, 5) further suggest that “One of the major directions that future research can pursue is to emphasize and outline the nuance present among secular segments of the population.” Taking the UK as our case study, we take up their call, seeking to contribute to a better scholarly understanding of the religiously unaffiliated and to wider debates about secularization, individualism, the privatization of religion, and the rise of spirituality (Baker and Smith Reference Baker and Smith2009b, 730).
This article uses a nationally-representative internet survey of the UK adult population to examine how those who identify as agnostic or atheist differ both from each other and from the religiously-affiliated. Specifically, we explore their (1) religiosity (religious beliefs, behaviors, and the personal salience of faith), (2) left-right ideology, and (3) policy preferences. The survey enables a differentiation of those within the religiously-unaffiliated, an operationalization of religiosity in a multi-faceted way, and contains measures of morality, salient policy debates, and broader ideological orientations. The results show that, for indicators of religiosity, ideology and policy debates, there are notable differences both between agnostics and atheists and between them and religious Britons. Taken together, the findings make an important contribution to delineating how secular groups differ from one another and from those belonging to different religious traditions within wider society. They develop scholarly knowledge about who are the religiously unaffiliated in the UK, and in so doing inform wider debates relating to secularization (Bruce Reference Bruce2013; Reference Bruce2014) and the “believing without belonging” perspective (Davie Reference Davie1994; Reference Davie2015; Crockett and Voas Reference Crockett and Voas2006; Voas and Crockett Reference Voas and Crockett2005).
EXISTING RESEARCH ON THE “RELIGIOUS NONES”
Recent analyses have shed important light on the social basis, nature, and extent of religiosity and spirituality, and the political attitudes of secular groups in the United States (Baker and Smith Reference Baker and Smith2009a; Reference Baker and Smith2009b; Reference Baker and Smith2015). Baker and Smith (Reference Baker and Smith2009b) compared three groups — atheists, agnostics, and unchurched believers (along with the affiliated believers) — in terms of their private religiosity and spirituality, political identity, moral liberalism, and attitudes toward religion in the public sphere (“sacralizing” ideology). Unchurched believers were the most privately religious or spiritual, followed by agnostics and then atheists (Baker and Smith Reference Baker and Smith2009b, 726–727). The picture was one of broad similarity in terms of political identification (being liberal or conservative) and moral liberalism, with no significant differences between the three groups (Baker and Smith Reference Baker and Smith2009b, 728). There were clear differences of view in relation to religion in the public sphere, with atheists and unchurched believers much more opposed compared to agnostics (Baker and Smith Reference Baker and Smith2009b, 730). Overall, their findings demonstrated that “there are distinctive differences between these categories when it comes to private religiosity and spirituality, as well as the level of opposition to religion in the public sphere” (Baker and Smith Reference Baker and Smith2009b, 731).
A subsequent analysis by Baker and Smith analyzed the political opinions of secular groupings — atheists, agnostics, culturally religious, and non-affiliated believers (as well as the actively religious) — across a range of issues. They found that:
A consistent pattern emerges, with agnostics the most liberal on issues ranging from environmentalism and diplomacy to matters of sexual politics and women working, followed by atheists, non-affiliated believers, and the culturally religious. It is over matters of sexuality and gender that political differences between actively religious and secular Americans are most evident (Baker and Smith Reference Baker and Smith2015, 181–182).
Baker and Smith also found notable differences in terms of political identity (ideological self-designation and party affiliation), as well as in voting behavior at presidential elections. Secular groups were more likely to identify as liberal in ideological terms (particularly agnostics), more likely to declare themselves as independent when asked about partisan affiliation (but were much more likely to lean toward being Democrat) and were also more likely to have been anti-Bush voters at the 2004 presidential election. Gries (Reference Gries2014, 122) similarly found that atheists and agnostics are the most likely of all American religious groups to have an “idealistic doves” foreign policy profile. He also found that atheists and agnostics are not just the coolest of all Americans religious groups toward Israel but also the warmest toward the Palestinians (Gries Reference Gries2015, 68). Yet other research has shown that partisan preferences of “religious nones” in the United States shifted from 1990 to 2008 away from the Republican Party and toward the Democratic Party (Kosmin et al. Reference Kosmin, Keysar, Cragun and Navarro-Rivera2011, 5). Taken together, these rich findings on secular groups in the United States serve to highlight the lack of similar analyses in the UK, even though it represents a society in which secularization is more advanced.
Research on secular groups in British society is more limited. Hayes’ (Reference Hayes2000, 203) study of “religious independents” across western democracies found that, in Britain, those with no affiliation were more likely to be male, younger, and less likely to be married, although there was no significant difference based on education, having children, type of occupation, or being employed. Voas and Day's (Reference Voas, Day, Kosmin and Keysar2007, 108) analysis of the socio-demographics of secularity in Britain concluded:
The age contrasts are significant, with younger, more secular generations gradually replacing the older and more religious. At the same time, people who are consciously and consistently religious or unreligious tend to be better educated and in higher occupational categories than those in the muddled middle.
Research has also shed limited light on the attitudes of secular versus religious groups. In terms of variation across social and political attitudes, Voas and Day (Reference Voas, Day, Kosmin and Keysar2007, 107) found that secular Britons were more somewhat likely to more likely to be ideologically to the left (with religious individuals being more likely to place themselves on the ideological right). Religious individuals were somewhat more authoritarian in their ideological orientations compared to more secular people, but this difference disappeared when taking age into account (2007, 107).
More recent empirical work has examined how the “religious nones” differ from the religiously affiliated in Britain. Comparing the non-affiliated with Anglicans, Catholics, and other Christians, those with no religious affiliation have generally been more progressive in their views on morality issues, although these are issues on which religious groups have also shifted their opinions in a more progressive direction in recent decades (Clements Reference Clements2015). There has been opinion convergence across religious and non-religious groups as the former have become more accepting of abortion, homosexuality, and equality measures for same-sex individuals, but “religious nones” still clearly are the most progressive group (Clements Reference Clements2015). Earlier research also found that the religiously-affiliated were more likely to hold socially-conservative opinions on similar moral questions, compared to the unaffiliated (Hayes Reference Hayes1995).
Taken together, research into “religious nones” as an undifferentiated group in the British context has provided well-established findings about their more liberal stance across moral issues as well as providing some clear indicators regarding their demographic basis and how they differ from the religiously affiliated. However, what is currently missing is a robust assessment of the different categories or groups within the religiously unaffiliated in the UK — particularly atheists and agnostics — looking at where they are distinctive or similar in terms of religiosity and social and political attitudes. This article presents a detailed analysis of where these secular groups differ from the religiously affiliated in the UK — in terms of personal religiosity, ideology and policy debates. The next section discusses the data and methods used for the empirical analyses.
DATA AND METHOD
The survey research company YouGov, through its United States headquarters in Palo Alto, California, was hired to implement a national internet survey in the UK in spring 2014. It constituted one-third of a parallel UK-France-Germany study designed by the second author, building on a spring 2011 United States survey (see Gries Reference Gries2014). The 2014 UK survey included a variety of questions about religious identifications, beliefs, and behaviors.
Internet surveys are no longer limited to convenience samples; the internet is now regularly used to gather nationally-representative samples of the UK or British (excluding Northern Ireland) populations. Objections have been raised both to the use of internet-sampling in academic research and, more generally, the efficacy of measuring religious belonging, believing, and behaving via opinion polls and academic surveys. We believe that to study sensitive private issues like religious beliefs and practices, and attitudes toward contentious public policy issues like immigration and same-sex marriage, the privacy of an internet survey has major advantages over telephone or face-to-face surveys (Pew Research Center 2015). Wuthnow (Reference Wuthnow2015) has, more broadly, criticized the use of polls to study religion. He is certainly correct that many pollsters design both their questions and samples with certain outcomes in mind, often to support the political goals of their clients. Our academic survey, by contrast, was self-funded, and does not start with any political agenda. We also believe that our survey approach, combining the strengths of both the political science (sampling) and psychological (measurement) survey traditions, achieves a good balance of both internal and external validity.
From April 16 to May 5, 2014 YouGov gathered 1,248 internet responses in the UK. Participants were recruited from YouGov's own panel of over 360,000 British adults, who are recruited via standard advertising and strategic partnerships with a broad range of websites. YouGov then used a “sample matching” methodology (see Ansolabehere and Rivers Reference Ansolabehere and Rivers2013) to create a representative national sample of 1,000 UK respondents (including England, Northern Ireland, Scotland, and Wales), first matching them on gender, age, and ideology using a frame constructed by stratified sampling from the September–October 2011 Eurobarometer. The final dataset was then weighted to match the full UK general population on age, gender, and education. These weights were used in all statistical analyses conducted in this article, which is why the reported Ns are not always exactly 1,000. The margin of error for the sample is ±3.8%.
To ensure that the relationships between the religious beliefs and public policy attitudes examined here are not the spurious products of other demographic variables, five standard covariates or “control variables” were included in most of the statistical analyses. They are age, gender, education, income, and being an immigrant. Age was a continuous variable created by subtracting “year of birth” from 2014, and ranged from 19 to 85, with a mean of 48 (SD = 17.13). There were 488 men (49%) and 512 women (51%) in the sample. Years of education were on a 10-point continuous scale, with a median response of studying through to age 17. Income was measured with the question “What is your gross household income?” and was measured in 10 £10,000 increments. The median response was £20–29 K. Finally, immigrant status was asked with a binary yes or no question of whether they, their parents, or grandparents were born in another country. In total, 184 respondents (18%) chose yes.
MEASURES
This study focuses on how two secular groups — atheists and agnostics — differ from the religiously-affiliated in terms of religiosity and socio-political attitudes. The categorization used here marks a clear advance over previous research, which has tended to compare the unaffiliated (as an undifferentiated whole) with the religiously-affiliated (often divided into major Christian denominations and those belonging to other faiths). Therefore, by analyzing the UK context specifically, it widens and deepens scholarly knowledge of secular groupings in contemporary societies and is clearly informed by key studies in this area. It does not attempt to precisely replicate previous studies already cited in the review of exiting research. One important area of difference is that this study uses an identity measure to categorise secular groups, rather than a combined measure of identity and affiliation (cf. Baker and Smith Reference Baker and Smith2009a; Reference Baker and Smith2009b), as a core aim is to examine group-related variation in religiosity in terms of both practice (including attendance.) and belief. Further research will, of course, be important to further develop and refine measurement and classification of secular groupings and identities in the UK context.
The religious affiliation question in the survey allows for a differentiation between two key secular groups: “atheists” — a perspective based on “a definitive claim that God does not exist” (Baker and Smith Reference Baker and Smith2009b, 721); and “agnostics” — based on the position that “such knowledge is beyond the realm of human capacity; they do not affirm or deny the existence of God” (Baker and Smith Reference Baker and Smith2009b, 721). The question was worded as follows: “Do you regard yourself as belonging to any particular religion, and if so, to which of these do you belong?” The survey therefore used a “belonging” form of question wording like that used in the BSA series which tends to elicit higher levels of non-affiliation, because it “puts least pressure on respondents to identify with a religion, by making no assumption that they have one and by introducing a formal concept of ‘belonging’” (Field Reference Field2001, 160). In contrast, a question which assumes in its wording that a respondent belongs to a religion and asks which one, “carries an implication that interviewees do have a profession and thus tends to minimise the number in the “no religion” category; and correspondingly register higher level of religious affiliation” (Field Reference Field2001, 160).
The overall profile of religious belonging for the sample showed that the modal category comprised those who declared themselves to be “agnostic” (28%). A further 11% of respondents professed themselves to be “atheist,” while 7% said they “don't know.” Social surveys, such as the BSA series, often do not provide any further questions which probe declared non-affiliation (in the standard BSA question on religious affiliation the option would be “no religion”), and so those who identify themselves as such cannot then provide a more specific grouping if they so wish, such as atheist, agnostic, or some other secular identity. The BSA series has featured three specialist modules on religion (in 1991, 1998, and 2008) carried as part of its participation in the International Social Survey Programme, which of course have allowed for more in-depth investigation of different aspects of religion concerning belonging, behaving and believing (see, for example, Voas and Ling Reference Voas, Ling, Park, Curtice, Thomson, Phillips, Clery and Sarah2010; McAndrew Reference McAndrew, Park, Curtice, Thomson, Phillips, Clery and Butt2010). Combined, then, 46% of our YouGov sample can be classified as religiously-unaffiliated. This proportion is commensurate with the levels of the non-affiliated recorded in recent BSA surveys discussed above. However, it cannot be straightforwardly assumed that those selecting “atheist” or “agnostic” in response to this survey are the same proportion of the population who identify as “no religion” on other surveys, such as the BSA series, but it would seem reasonable to expect a substantial overlap between the two groupings.
Just over half of our sample claimed some form of religious identification. A quarter said they were “Church of England/Anglican” (25%) (also the most prevalent religious identity recorded in the BSA surveys), 14% claimed some form of “other Protestant” (7%) identity (including “Methodists” [4%] and “Presbyterian/Church of Scotland” [3%]), 7% professed to be “Catholic” — with 46% in all claiming a Christian identification. 9% self-identified with a non-Christian religion (including “Muslim,” “Jewish,” “Buddhist,” “Hindu,” and “Sikh”).
To reduce clutter, in all subsequent analyses and figures, the 7% of (or 72) respondents who chose “don't know” for religious affiliation were excluded. They did not differ from self-identified atheists and agnostics in terms of gender (p = 0.75), age (p = 0.19), or education level (p = 0.76). “Don't knows” were slightly lower on self-reported income (p = 0.009), however, and were more likely to be recent immigrants (p = 0.008). They were more likely than atheists and agnostics to pray and attend church (F 1, 466 = 19.39, p < 0.001, η p 2 = 0.04), and much more likely to believe in God and the Bible (F 1, 466 = 90.34, p < 0.001, η p 2 = 0.16) and view themselves as religious (F 1, 466 = 120.13, p < 0.001, η p 2 = 0.21). “Don't knows” were also slightly to the right of atheists and agnostics (F 1, 466 = 10.63, p < 0.001, η p 2 = 0.02), very slightly more supportive of toughening immigration laws (F 1, 466 = 11.53, p = 0.009, η p 2 = 0.01), and were less supportive of legalizing gay marriage (F 1, 466 = 19.42, p < 0.001, η p 2 = 0.04). The two groups did not differ, however, on policy preferences toward either taxes (p = 0.23) or European integration (p = 0.68). And when the “don't knows” are included in the statistical analyses below, in no case was there a substantial change in either the significance level or effect size of the result.
Religiosity was measured based on (1) behavior, (2) belief, and (3) the personal salience of religion. (1) Religious behavior was operationalized with two items tapping (a) the frequency of attendance at religious services, a communal or public practice, and (b) the frequency of prayer, a more private religious practice. These were measured using six and seven point scales, respectively, so were standardized prior to averaging. Higher values represent more frequent religious practice. (2) Religious belief was measured with two questions exploring (a) biblical literalism (whether the Bible is literally true) and (b) certainty about God's existence. (3) Religious salience or importance was measured with two questions tapping whether (a) respondents perceived religion to be “an important part of my life,” and (b) whether they saw themselves as a “religious person.” All four beliefs and salience items were measured on 1–7 strongly disagree to strongly agree scales.
A combined six item measure of religiosity was internally-reliable, with a very high Cronbach's α of 0.93. Each of the two-item facets of religiosity were also internally-reliable (behavior: α = 0.76; belief: α = 0.83; salience: α = 0.93).
Low average religiosity for the full sample suggests a highly secular UK. For both religious belief (m = 2.89; SD: 1.91) and the salience or importance of region (m = 2.64; SD: 1.89), the UK mean was well below the scale mid-point of four. The secularization of British society was even more apparent in the two behavioral measures of religiosity, with over 60% of the population admitting that they “never” attend religious services or pray. This resulted in highly skewed distributions for both measures (skewness statistics of 1.76 for attendance, and 1.38 for prayer; both SE, 0.08).
The measures of socio-political policy preferences used as dependent variables were questions about the degree of opposition or support for a controversial issue of sexual morality (“legalising gay marriage”), and about salient social, economic, and foreign policy debates (“toughening immigration laws,” “increasing social welfare spending,” “decreasing taxes,” and “increasing EU integration”). There was also a measure of left-right ideology (a self-placement scale). Responses to the morality and policy questions were all on 1–7 scales where 1 denoted strong opposition and 7 denoted strong support (after being asked “To what extent do you support the following policies?”). Left-right ideology was operationalized as a composite scale based on two items. The first was asked earlier as part of YouGov's profile questions it keeps on all of its UK survey panelists: a 10-point self-placement scale running from left to right (“In political matters people talk of the ‘left’ and the ‘right.’ How would you place your views on this scale?”). The second was an unnumbered placement ruler anchored by “more to the left” and “more to the right” that ranged from 0 to 100 (“When it comes to politics, do you consider yourself more to the left or right?”). The two items were standardized and combined to create scale of excellent internal reliability, α = 0.92, despite the two measures being completed at different times (on the internal reliability of ideological self-placement, see Gries Reference Gries2016). Higher values represent more right-wing ideology.
RESULTS
As noted above, most analyses of covariance, mediation, and moderation analyses presented here include five standard covariates or “control variables”: age, gender, education, income, and being an immigrant. We compare atheists and agnostics both to each other and to other major religious groups in the UK (e.g., Anglicans, Other Protestants, and Catholics) in terms of (1) religiosity, (2) ideology, and (3) social, economic, and foreign policy preferences.
Religiosity
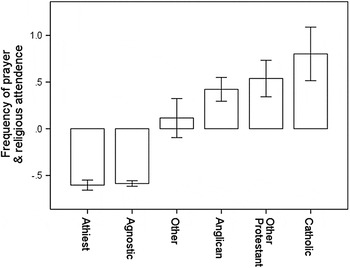
Unsurprisingly, our survey revealed large differences in religiosity between atheists and agnostics on the one hand and other religious groups on the other. First, as Figure 1 reveals, in terms of religious behavior (prayer and church attendance), atheists and agnostics are by far the least frequent, with Catholics and Other Protestants the most frequent. For instance, 95% and 92% of atheists and agnostics, respectively, claimed to “never” pray. By contrast, only 30% of Catholics and 32% of Anglicans and Other Protestants admitted to never praying. The frequencies of those claiming to “never” attend religious services were very similar, with a sizeable contrast between atheists and agnostics on the one hand and Anglicans and Other Protestants on the other.
Religious behavior. Note: Average (α = 0.93) of “Aside from when you are attending religious services, how often do you pray?” and “Aside from weddings and funerals, how often do you attend religious services?” F(5, 959) = 77.79, p < 0.001, η p 2 = 0.29. The analysis controls for age, gender, education, income, and being an immigrant. The T–bars represent 95% confidence intervals.

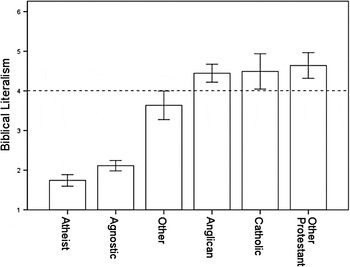
Second, as might be expected, atheists and agnostics also clearly differed from Christians on religious belief, a composite scale of belief in the Bible as literally true and in God's existence. As Figure 2 reveals, atheists scored the lowest on religious belief, followed closely by agnostics, while Catholics, Anglicans, and Other Protestants scored the highest. The only significant covariate was being an immigrant, who believed more.
Religious belief. Note: Average (α = 0.83) of “The Bible is literally true” and “I have no doubt at all that God exists” (1 = strongly disagree; 7 = strongly agree). F(5, 959) = 95.97, p < 0.001, η p 2 = 0.33. Analysis controls for age, gender, education, income, and being an immigrant. The T-bars represent 95% confidence intervals.

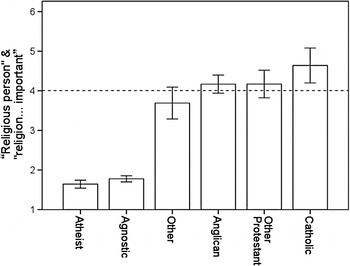
Third, atheists and agnostics again differed markedly from other groups in terms of the importance or salience of religion in their lives. As shown in Figure 3, atheists again scored slightly below agnostics, while Catholics, Other Protestants, and Anglicans scored the highest (and higher than those belonging to other religions). Greater education and being an immigrant were both associated with greater religious importance or salience.
Personal salience of religion. Note: Average (α = 0.93) of “Religion is an important part of my life” and “I see myself as a religious person.” (1 = strongly disagree; 7 = strongly agree). F(5, 959) = 121.26, p < 0.001, η p 2 = 0.39. The analysis controls for age, gender, education, income, and being an immigrant. The T-bars represent 95% confidence intervals.

In sum, across all three facets of religiosity — behavior, belief, and salience/importance — atheists and agnostics scored by far the lowest, and those with a Christian affiliation (Anglicans, Other Protestants, and Catholics) scored the highest. These findings follow common sense and are consistent with findings from the United States, where atheists are also the least religiously-engaged in any sense, followed closely by agnostics (cf. Baker and Smith Reference Baker and Smith2009b).
Ideology
The left-right (or socialist-laissez faire) distinction, based upon economic class structures, has long been the core axis underpinning party contestation and voter alignment in post-war British politics (Sanders Reference Sanders, Evans and Norris1999; Heath et al. Reference Heath, Jowell, Curtice, Evans, Field and Witherspoon1991). Although British political parties have recently divided over social and moral issues (such as the “culture wars” and concerns about immigration), the left-right ideological cleavage remains highly salient.
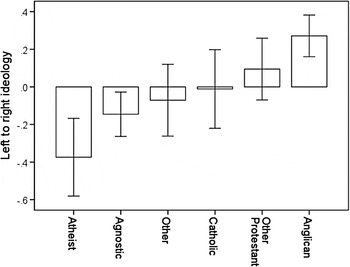
There is a medium sized overall difference in left-right ideology across our six British religious groups. As shown in Figure 4, atheists are furthest to the left on the ideological spectrum, followed by agnostics, and Anglicans are the furthest to the right. The latter finding on Anglicans is consistent with recent research on the ideological orientations of British religious groups (Clements Reference Clements2015). Among the demographic covariates, age and education were both statistically significant, with older Britons more to the right, and greater education associated with being more to the left.
Left-right ideology. Note: “When it comes to politics, do you consider yourself more to the left or right?” (anchors: “more to the left” to “more to the right”). F(5, 959) = 8.80, p < 0.001, η p 2 = 0.044. The analysis controls for age, gender, education, income, and being an immigrant. The T-bars represent 95% confidence intervals.

That British atheists and agnostics self-identify the farthest left is consistent with Smith and Baker's (Reference Baker and Smith2015, 182) recent analysis of secular groups in the United States, which found that when asked to identify politically as conservative or liberal, secular Americans were more likely to see themselves as liberal, with atheists even more liberal than agnostics.
Policy Preferences
Specific areas of policy debate which have been long-standing aspects of broader left-right contestation in British society include the level of taxation and government spending on welfare services (Heath et al. Reference Heath, Jowell, Curtice, Evans, Field and Witherspoon1991). Research in Britain has found that Anglicans are more likely than other religious groups to be both politically to the right and anti-welfare (Clements Reference Clements2015). In Britain, religious leaders have often participated in public debates over social welfare policy — not without controversy — to express reservations about or outright criticism of actual policy or proposed reforms.
Interestingly, on the question of whether to increase social welfare spending, the only significant difference for religious affiliation was between atheists and Anglicans, with the latter less supportive of increased expenditure than the former (the number of Catholics and members of other religions were too small for paired comparisons with Anglicans to be statistically significant). Beyond religious affiliation, the only other socio-demographic predictors of welfare attitudes were income, with wealthier people less supportive, and gender, with women more supportive than men.
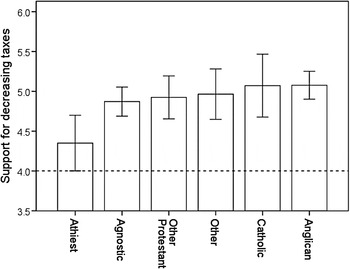
Whereas increasing welfare spending is commonly seen as a policy stance typical of a more left-wing disposition, advocacy of lower taxation is often seen as a key standpoint for more right-wing beliefs. Figure 5 reveals a small overall difference across all six religious groups regarding lowering taxation. Consistent with their preference for increased social welfare spending, atheists are the least supportive of decreasing taxes. Education and age were statistically significant covariates. Specifically, both greater education and age were associated with opposition to lowering taxes. The effect was much larger for education, F(1, 959) = 27.29, p < 0.001, η p 2 = 0.028, than it was for age, F(1, 959) = 6.72, p = 0.01, η p 2 = 0.007.
Decreasing taxation. Note: “To what extent do you support the following policies?” (1 = strongly oppose; 7 = strongly support) … Decreasing taxes. F(5, 959) = 2.62, p = 0.02, η p 2 = 0.013. The analysis controls for age, gender, education, income, and being an immigrant. The T-bars represent 95% confidence intervals.

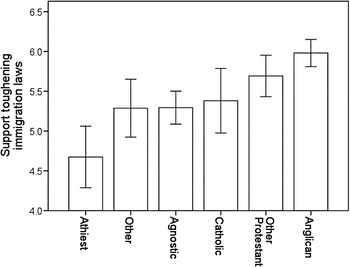
Religious groups differ slightly more over immigration and European integration. As shown in Figure 6, Anglicans are the most supportive and atheists most opposed to toughening immigration laws. Pairwise comparison reveals that the only statistically significant differences were between atheists on the one hand and both Anglicans and Other Protestants on the other. Greater education is strongly associated with opposition to tougher immigration laws, F(1, 959) = 93.06, p < 0.001, η p 2 = 0.09, while older people are slightly more supportive of tougher laws.
Controlling immigration. Note: To what extent do you support the following policies? (1 = strongly oppose; 7 = strongly support) … Toughening immigration laws. F(5, 959) = 4.32, p = 0.001, η p 2 = 0.02. The analysis controls for age, gender, education, income, and being an immigrant. The T-bars represent 95% confidence intervals.

Public opinion research, both cross-national and single-country, has focused attention on the religious factors shaping public attitudes toward European integration. In the United States, Gries (Reference Gries2014, 180–182) reports survey evidence that one reason that American conservatives feel so much cooler toward the European Union than do liberals is that many evangelical Protestants read the Book of Revelation to popularize the view that the Antichrist will arise from the European Union prior to Christ's Second Coming.
In Europe, Nelsen, Guth, and Highsmith (Reference Nelsen, Guth and Highsmith2011, 2–3) note that: “There are many historical, ideological, and institutional reasons to suspect that religious factors influence public attitudes toward integration.” Research in Europe has focused on the macro-level impact of countries having broadly a Protestant, Catholic, or mixed confessional culture (or the level of secularization) and the micro-level impact of religious identity and religiosity (Nelsen and Guth Reference Nelsen and Guth2015). Distrust of or opposition toward the integration process has traditionally been higher in northern European countries, including the UK, where Protestantism has been the predominant — and, in some countries, the official state — religion (Vollard Reference Vollard2006, 276). Recent research in the British context has shown that, over time, Anglicans have generally become more opposed to integration than Catholics (Clements Reference Clements2015), and that Anglicans are more Eurosceptic than the general population (Woodhead Reference Woodhead2013).
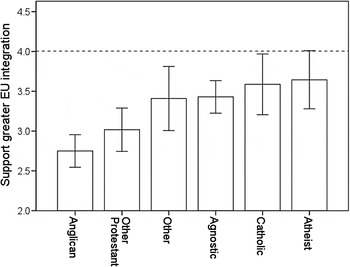
Figure 7 reveals that our data support these recent arguments: Anglicans were the most opposed to further European integration, with pairwise comparisons revealing them to differ significantly from both atheists and agnostics (with a larger sample of Catholics, they too would likely have differed from Anglicans). Age and gender were also significant predictors: older Britons and men were more likely to oppose greater European Union integration, a result consistent with earlier research on the topic (Clements Reference Clements2009). The age effect, F(1, 959) = 30.59, p < 0.001, η p 2 = 0.031, was almost four times larger than that for gender, F(1, 959) = 14.25, p < 0.001, η p 2 = 0.015.
European integration. Note: To what extent do you support the following policies? (1 = strongly oppose; 7 = strongly support) … Increasing EU integration. F(5, 959) = 3.12, p = .008, η p 2 = 0.02. The analysis controls for age, gender, education, income, and being an immigrant. The T-bars represent 95% confidence intervals.

The six religious groups differ far more over the “culture wars” issue of legalizing gay marriage. As Francis, Robbins, and Astley (Reference Francis, Robbins and Astley2005, 45) argue, “Traditionally, sexual relationships and family life are areas which have been closely policed by religious organisations and religious teaching.” Recent legislation promoting social equality for same-sex couples in different areas of social life has often been strongly opposed by religious denominations and their leaders. Indeed, more broadly, Hayes and Dowds (Reference Hayes, Dowds and Brunn2013, 2) suggest that “public disputes and related court battles over homosexual rights have now replaced abortion as the most significant and divisive moral issue within many contemporary western industrialized societies.” The most recent societal debate in Britain over moves to further same-sex equality involved the legalization of same-sex marriage, which engendered a particularly divisive national debate with religious faiths and campaign organization at the forefront of the opposition to such a reform. These include senior clergy within the Church of England, the Roman Catholic Church, and those representing other Christian denominations and other faiths. Even so, the Marriage (Same-Sex Couples) Act was enacted for England and Wales in 2013, with a separate law enacted in Scotland to enable the same reform. As Kettell (Reference Kettell2013, 2) observed at the time: “the issue of same-sex marriage is a particularly incendiary one for religious groups.”
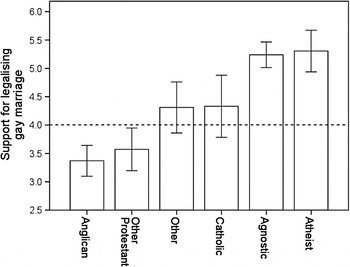
This policy debate therefore represents a “religiously-charged” (Baker and Smith Reference Baker and Smith2009b, 725) issue on which we might expect secular groups to hold views distinct from those held by religious groups. Indeed, Figure 8 reveals an overall medium-to-large difference across our six religious groups. Pair-wise comparisons reveal that atheists and agnostics are the most in favor while Anglicans and Other Protestants are the most opposed to legalizing gay marriage.
Legalizing gay marriage. Note: To what extent do you support the following policies? (1 = strongly oppose; 7 = strongly support) … Legalising gay marriage. F(5, 959) = 17.25, p < 0.001, η p 2 = 0.08. The analysis controls for age, gender, education, income, and being an immigrant. The T-bars represent 95% confidence intervals.

This finding adds nuance to extant research which has shown that the religiously-unaffiliated have, over time, generally maintained a more liberal stance on these equality issues compared to religious adherents, and that Catholics have tended — at least more recently — to be more liberal than Anglicans (Clements Reference Clements2015). Age also had a substantial (medium to large) effect, with younger people more supportive of legalizing gay marriage than older people, F(1, 959) = 96.14, p < 0.001, η p 2 = 0.09. Women were slightly more supportive than men, and those with higher incomes were also more in favor of legalization. Previous research into gay rights issues in Britain has also found that the key divides have been those based on gender, age, and religious affiliation (Crocket and Voas Reference Crockett and Voas2006). Moreover, these findings, are in accord with Hayes and Dowds (Reference Hayes, Dowds and Brunn2013, 17) study of public opinion on these issues in Northern Ireland, where “attitudes towards same-sex issues are not solely determined by a religious framework.” This is clearly the case for public opinion in Britain as well. These results are also consistent with those of Baker and Smith (Reference Baker and Smith2015), who found that religious and secular Americans differ the most over “culture war” issues like gay marriage.
Ideology as a Mediator of Religious Identification's Effect on Policy Preferences
Atheists and agnostics thus differ from Catholics, Anglicans and Other Protestants in both ideology and a variety of policy preferences. Might ideological differences account for these differences between religious groups on these policy issues? To explore this question, we reran the above policy analyses while also controlling for left-right ideology.
For two of the policy preferences — immigration and taxation — the small overall difference between religious groups is eliminated altogether when the impact of left-right ideology is accounted for (immigration: F(5, 958) = 1.25, p = 0.28; taxation: F(5, 958) = 1.29, p = 0.27). The biggest ideological cleavage is between atheists on the left and Anglicans on the right, F(1, 370) = 32.41, p < 0.001, η p 2 = 0.08 (see also Figure 4). This substantial ideological difference partially accounts for their differences over a variety of policy issues. For instance, atheists are more supportive of legalizing gay marriage than Anglicans, even controlling for socio-demographic variables, F(1, 369) = 10.06, p = 0.002, η p 2 = 0.03. Mediation analysis reveals that left-right ideology accounts about 40% of that difference (indirect PE = 0.2967, 95% CI from 0.1480 to 0.4914. Direct effect reduced from 4% to 2.5% [semi-partial = 0.202 to 0.162). Similarly, Anglicans were more supportive than atheists of decreasing taxation, F(1, 370) = 11.57, p = 0.001, η p 2 = 0.03). Mediation analysis reveals that left-right ideology accounts for a substantial 60% share of that difference (indirect PE = −0.2470, 95% CI from to −0.4240 to −0.1290. Direct effect reduced from semi-partial = −0.162 to −0.102).
One of the few policy disagreements between atheists and agnostics was over tax policy (Figure 5), with atheists even more opposed to decreasing taxes than agnostics, F(1, 388) = 4.25, p = 0.04, 60% = 0.01. However, this difference disappears when ideology is added as an additional covariate, F(1, 387) = 2.98, p = 0.09. Mediation analysis using Andrew Hayes’ PROCESS macro for SPSS revealed the indirect path from being atheist or agnostic to ideology to tax policy preferences was significant.
Ideology, Religiosity, and Policy Preferences
As a final step, we tested our two-item left-right ideology scale against our six item measure of religiosity (controlling for our five demographic covariates) to predict the five policy issues. Unsurprisingly, only ideology — and not religiosity — was a significant predictor of policy preferences regarding taxes, European Union integration, and immigration. And on social welfare spending preferences, while religiosity contributed a very small amount of unique variance, (0.04%), ideology (15.2%) contributed 38 times more. On these policy issues, ideology remains king.
When it comes to gay marriage, however, religiosity (5.4%) more than holds its own, contributing 44% more unique variance than ideology (3.8%) does. In other words, when “religious nones” (atheists and agnostics) in Britain disagree substantially with Protestants (Anglicans, Methodists, Presbyterians) over gay marriage, it is not primarily because they are farther to the left ideologically, but because they are less religious.
CONCLUSION
The empirical analyses within this article represent a significant contribution to scholarly research into religiously-unaffiliated people in the UK. Across different aspects of religiosity and a range of socio-political attitudes, the analyses found clear differences both among different secular groups (atheists and agnostics) and between secular groups and those with some form of religious affiliation. Taken together, the empirical results clearly extend existing scholarly knowledge of secular groups in Britain, who inhabit a society in an advanced state of secularization, as well as providing robust comparison of secular and religious groups. These findings also provide important micro-level evidence in the context of broader scholarly debates focused on the macro-level perspective concerning religious change, decline and secularization in the UK as a whole or in its constituent nations (Bruce Reference Bruce2013; Reference Bruce2014; Davie Reference Davie1994; Reference Davie2015). The results set out here also invite other scholars to undertake further research to shed more light on secular groups in the UK population, further investigating the sources of social and attitudinal heterogeneity within the broader “religious nones” grouping, and developing and refining classifications of secular and religious phenomena.
Further quantitative research could examine the attitudes of secular groups in the UK toward the role of religion in the public sphere where — unlike in the United States (Baker and Smith Reference Baker and Smith2009b) — there is no formal separation between church and state but instead an established or state church (in England). Further inquiry in this area seems especially pertinent given the emergence recently of a “new atheism” movement articulating a “direct set of political stances” on policy issues and an emphasis “on popularising anti-religious sentiment in order to support efforts to challenge the institutional and social power of religion” (McAnulla Reference McAnulla2014, 126). Another set of issues that could be examined in future research are religious and secular groups’ foreign policy attitudes — given the differences over European integration demonstrated here, and as other research has shown that secular and liberal groups in the United States are more amenable to diplomacy over military means to ensure peace, and are more likely to support an internationalist — as opposed to an isolationist — posture in world affairs (Baker and Smith Reference Baker and Smith2015, 179; Gries Reference Gries2014). While the analyses presented here encompassed ideology and policy issues, a complementary strand of research could focus on the patterns of party affiliation amongst more secular groups, and compared to the religiously affiliated, to see if the historical links between socialism and secularism (Baker and Smith Reference Baker and Smith2015, 178) are in any way present in wider British society today. Finally, while this analysis represents an important start and delivers a clear empirical payoff, another area where further research is necessary is in developing and testing the measurement and classification of secular groupings and identities in the UK context.