Introduction
Global climatic change is considered to be a crucial issue, especially in the Arctic where the ecological balance is extremely delicate (Chapin and others Reference Brossard, Elvebakk, Joly and Nilsen1997; Hollister and others Reference Hollister, Weber and Bay2004; Reynolds and Leadley Reference Reynolds, Leadley, Chapin, Jefferies, Reynolds, Shaver, Svoboda and Chu1992). In general, the type and degree of change in question is often approached through mechanisms on a global scale; however, in terms of the impact, particularly on vegetation, the ecological balance is controlled by complex processes which integrate levels that vary across scales in which global factors interact with local phenomena linked to the delicate structure of the landscape. According to the landscape process in question, this in-situ structure can accentuate or counterbalance the effects due to global change. It is, therefore, important to use, in Arctic environments, methods that permit the calibration of the variations in climate according to scales. This paper approaches this problem by focusing on temperature, which is a determining element of climatic change in Arctic environments. A minor climate change in the summer temperature sum or in the minimum/maximum temperature range could determine plant distributions (Weider and Hobaek Reference Weider and Hobaek2000). Some species could disappear, or other ones invade new areas. Changes in local temperatures will not however, be equally distributed nor will they have the same intensity. Therefore, the impact of climate change on a given area may vary according to its geographical positioning and its inner environmental diversity (McGraw and Fetcher Reference McGraw, Fetcher, Chapin, Jefferies, Reynolds, Shaver, Svoboda and Chu1992). In this context, it is important to understand how temperature distribution is structured at micro-scale (Nilsen and others Reference Nilsen, Brossard and Joly1999) and how that distribution changes spatially as the scale changes.
Temperature varies in space in a complex manner and differences observed between two stations are not only due to the distances between them, but also to the intricacies of the landscape that separate the two stations. Substantial differences can appear over a single hectare while vast areas can be thermally quasi homogenous. The temperature measured in an area results from the value of each of the components of the energetic assessment that is controlled by numerous factors related to topography (such as elevation, gradient, slope, aspect, and landform) and land cover (such as the type of vegetation, and the presence of bare ground and water; Stephenson Reference Stephenson1990; Barry Reference Barry1992). Additional elements worthy of consideration include the distance to significant phenomena such as the sea, crest lines or glaciers. In fact, according to the spatial distribution of the physical properties present, each surface element may permit or impede thermal changes, such as the acceleration or dampening of heat absorption and cooling. As such, the air in contact with the surface or the biosphere acquires specific thermal characteristics that can be a function of the size of the surface element in question, which may exist on a micro, local or regional scale. Because of the surface and climatic features present, spatially explicit climates can either remain confined in the milieu in which they were created, as can be exemplified by a small lake or a névé, or have influence on adjacent areas. As such, minimum temperature is often influenced by the movements of air which originate in contact with a specific characteristic of the contact areas, such as slope (Bolstad and others Reference Bolstad, Swift, Collins and Regniere1998).
Arctic climates are more particularly influenced by phenomena of scale and by the surface temperatures that react strongly to the local structure of the landscape (Chen and others Reference Chen, Saounders, Crow, Naimab, Brosofske, Mroz, Brookshire and Franklin1999; Lookingbill and Urban Reference Lookingbill and Urban2003; Yeakley and others Reference Yeakley, Swank, Swift, Hornberger and Shugart1998). Thus, the effects of scale need to be assessed to allow a better capability for looking at the effects of temperature across landscapes.
To study the effects of physical attributes across different scales on temperature in an Arctic environment, an experimental was conducted at Loven East and Loven Middre (79° N), two fore-glacial sites on Svalbard. These offer appropriate characteristics for such a study: (i) the micro to regional environmental conditions are significantly contrasted in terms of topography, vegetation cover, and soil properties, (ii) some significant influences (fjord, glaciers, mountain ridges) are present and, thus, it is possible to identify their specific influence on temperature, (iii) a complete data base is available for this area consisting of a DEM and remotely sensed images at different resolutions, and (iv) a number of climatic reference measurements are available.
Methods
Study area
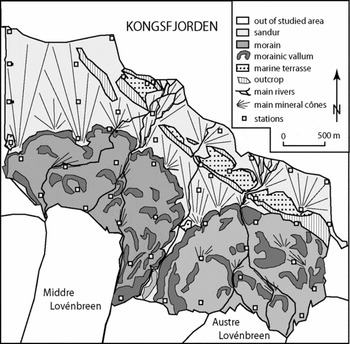
The study area, which covers about 10 km2, is located 6 km east of Ny-Ålesund, on the Brøgger Peninsula, Svalbard. It corresponds to a coastal plain, or a strandflat in geomorphological terms, and is characterised by several raised marine levels (raised beaches) caused by isostatic uplift after the last main quaternary glaciations. Since the Little Ice Age which peaked here at the end of the 19th Century, the two local glaciers have produced landforms of a high diversity; inner detritic cones, hills and ridges, bowls and valleys (Fig. 1). Rivers from the moraine belts flow from the glaciers and have created complex outwash plains (sandur) combining detritic cones in different stages of development. Adjacent to the two glaciers, Kongsfjorden constitutes another cold mass on the northern side. Close to the fjord, the wind is predominently from the northeast. On the glacier forefields, catabatic winds frequently blow from the south. An area is located between these two cold zones where the temperature is much higher and can vary according to local weather conditions and local air masses.
Study area.

Materials
Two main types of data are applied to the modelling process: temperature and raster data sets of the area.
Temperature measurements
The climate data in the study area was sampled using 53 temperature loggers (Hobo, 64 k recording instruments equipped with an exterior temperature sensor; Fig. 1). The georeferenced positioning of the loggers was determined and optimised by a stratified sampling procedure which took into account two constraints: the spatial distribution and the diversity of environmental conditions (Joly and others Reference Joly, Brossard, Dupont, Elvebakk, Fury and Nilsen1999). The sensors were protected from solar radiation and precipitation by a shelter. This measured 152 mm (height) by 213 mm (width) by 188 mm (diameter). The sensors were tested by Météo-France Besançon in 2000. They were placed 20 cm above the ground to assist in the study of temperature to plant distribution.
In all, the device furnished temperatures for the period between 12 July and 8 August 1999 (28 days), recording data every six minutes. The instruments made 240 recordings during the observation period, resulting in daily minimum and maximum temperatures. However, only minimum temperature will be used here to establish a methodological process that potentially shows how the physical environment factors, at varying scales, control temperature distribution in this Arctic environment. Temperature minimum is selected because it is one of the major constraints for vegetation and ecosystems.
Two dates (17 July and 5 August) were chosen as a basis for our initial analysis. The first date was a mostly sunny day with high cloud cover (cirrus, cirrostratus) and was warm (daily mean 12.1°C in Ny-Ålesund) while the second date was cold (daily mean 4.1°C), and cloudy with rain occasionally mixed with snow.
GIS data layers
The second data set comprised raster-based remotely sensed images and digital terrain models (DTM), available in two primary resolutions:
1. 2 m. The image source was obtained as a scanned infrared aerial photograph provided by the Norsk Polarinstitutt. The DTM was processed by an interpolation method applied to 43,000 coordinates measured in the field by a highly accurate GPS.
2. 20 m. This data source was developed from a resampled and orthorectified SPOT image. The DTM was provided by the Norsk Polarinstitutt.
Analysis
Production of different spatial subsets
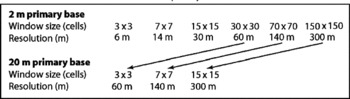
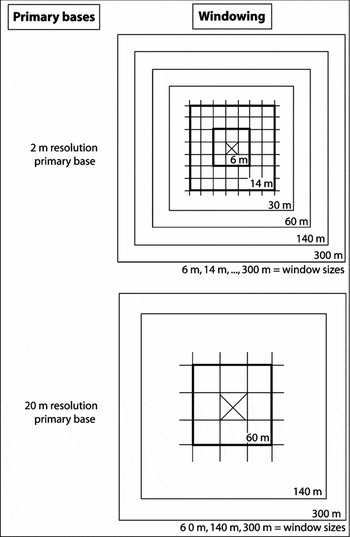
A windowing procedure was used to derive several spatial subsets from the two primary data bases (Fig. 2). An aggregation process (Table 1) was applied to obtain, from the 2 m primary base, six subsets (6, 14, 30, 60, 140 and 300 m pixel size) and, from the 20 m primary base, three subsets (60, 140 and 300 m pixel size). These were used to determine which of the different spatial scale levels contributed most significantly as a given explanatory factor by means of correlation process (Fig. 2).
size of the subsets identified on the primary bases at 2 m and 20 m resolution

Primary bases and windowing.

Derived layers
The second step provides the spatial links between the measurement points and the different data layers (Fig. 2). Several pixel resolutions (windows) corresponding to the different window sizes derived from the two primary bases are established around each point (Table 1). On this basis, the environmental conditions of the 53 reference climatic stations can be systematically described in the same way within each window frame. A great number of variables capable of explaining the observed temperature values can be obtained from such data sets and then tested to see if they are significant or not. The following list identifies some of these variables (Gardner and others Reference Gardner, Sasowski and Day1990); those in bold are reported here:
1. DTM: altitude, gradient, slope facing, theoretical solar energy, topographical contrast, landforms, distance to crest lines (Lookingbill and Urban Reference Lookingbill and Urban2003).
2. Images (scanned aerial photo and satellite data): land cover, vegetation cover, distance to the sea and glaciers.
In the case of the aerial photo (2 m primary resolution), the vegetation cover is valued through a potential vegetation index (PVI) giving the ‘probability that the considered pixel is 100% vegetated’; in the case of the satellite image (20 m primary resolution) the vegetation is valued through the usual index, normalised difference vegetation index (NDVI).
Correlations
As the aim is to suggest a methodological procedure for recognising, variable by variable, the most significant scale level that has an effect on temperature, we only present here the detailed results for three variables, showing how the procedure works. In all cases, the daily minimum temperature was taken as dependent variable, whereas altitude, theoretical solar energy and vegetation cover are taken as independent variables. These tests utilised temperature from two dates chosen for their contrasted weather conditions: relatively warm and cloud-free for July 17 and cool and rainy for August 5.
The procedure used here was based on a linear correlation process applied to different variable couples (Joly and others Reference Joly, Nilsen, Fury, Elvebakk and Brossard2003; Wilmott and Robeson Reference Wilmott and Robeson1995):
* temperature 17 July/altitude window 1; temperature 17 July/altitude window 2; temperature 17 July/altitude window 6;
* temperature 17 July/solar energy window 1; temperature 17 July/solar energy window 2; temperature 17 July/solar energy window 6;
* temperature 17 July/vegetation cover window 1; temperature 17 July 17/vegetation cover window 2; temperature 17 July/vegetation cover window 6;
* the same for 5 August.
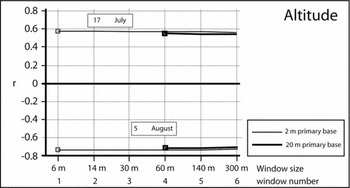
By using graphs, one can see how the correlation coefficients vary for each factor, from the highest to the lowest pixel resolution size, because the area is larger from one pixel resolution to another. Thus, the windowing makes it possible to consider the effect of the environment conditions at different scale levels on temperature (for example Figs. 3, 4 and 5).
Correlation coefficients between temperature minima (17 July, 5 August) and altitude.

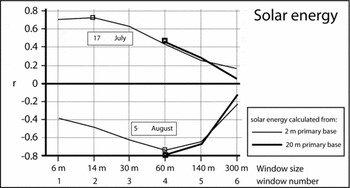
Correlation coefficients between temperature minima (17 July, 5 August) and solar energy income.

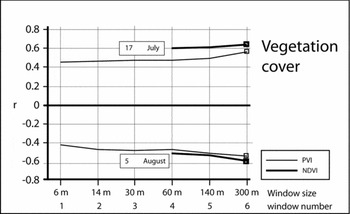
Correlation coefficients between temperature minima (17 July, 5 August) and vegetation cover indices (PVI and NDVI).

Although in previous work the authors have explored this methodology by systematic and iterative tests (Joly and others Reference Joly, Nilsen, Fury, Elvebakk and Brossard2003), in the present work, only the influence of the three explanatory variables on temperature is analysed one independently of the other. This analytic procedure is more appropriate to identify the scaling effect; level by level, of the different environment variables on temperature.
Results
Altitude
Fig. 3 shows how the correlation coefficient changes with temperature and altitude. The first observation is based on the sign of correlations which is positive in cloud-free weather (17 July) and negative in cloudy and rainy weather (5 August); this is true for all pixel resolution sizes under consideration. This shows that altitude, a powerful explanatory factor in the spatial variation of temperature, does not introduce any effect of scale (the curves are flat). This is probably due to the fact that because of a strong autocorrelation, altitude values do not significantly vary from pixel resolution to pixel resolution.
Solar energy
Theoretical solar energy can be computed with the help of a model taking into account gradient, aspect and the angular position of the sun above the horizon. It is usually a good temperature predictor. For this study, aspect and gradient were derived from the DEM whereas the solar angle was computed for every time interval by using a standard equation (Perrin de Brichambaut Reference Perrin de Brichambaut1978), taking into consideration the shadow effect due to the topographic variation.
For solar radiation, the coefficients were positive when the weather conditions were good (17 July) owing to the relatively uninhibited solar warming effect on local air temperature, whereas the reverse case is observed on 5 August (cloudy and rainy weather conditions) with strong negative correlation values. Therefore, solar energy has a strong effect on the spatial distribution of temperature.
For 17 July, Fig. 4 shows that the maximum correlation (r = 0.73) is related to window 2 (14-m window) and the minimum correlation (r = 0.19) is observed for window 6 (300-m window) indicating that the dependence of temperature on solar energy calculated on a large pixel resolution is low (probably owing to the amount of light distributed over the larger spatial area). A reverse relationship occurs for 5 August, resulting with a negative correlation peak (r = −0.75) for pixel resolution 3 (60-m window). The dependence of temperature on solar energy is weak (r ± 0.2) for pixel resolution 6 (300-m window) in each of the weather condition analysed in this study. These results indicate that scale may have an effect on the factors that explain temperature distribution across this landscape.
Although six different pixel resolutions were produced from the two different data sources, three of them (windows 4, 5 and 6 (60 m, 140 m and 300 m, respectively)) were common to both data sources. The coefficients of correlation obtained from these will make it possible (i) to compare the ability of each data source to describe the spatial variation of temperature and (ii) to compare the one with the other. At pixel resolution 4 (60 m), both sources provide almost the same coefficient and at the 300 m pixel resolution size, the deviation is maximum.
Vegetation cover
The correlation between temperature and PVI for 17 July shows that the coefficients have an irregular distribution but tend to increase with coarser pixel sizes. The profile for 5 August is also complex with a first negative peak (negative coefficients) at window 3 (30 m) and a second one at 6 (300 m). NDVI gives a better result than PVI in spite of a coarser pixel resolution. This effect is especially clear by during cloud free weather (17 July) at window 4 (60 m resolution). SPOT derived NDVI seems to be a better data source for modelling temperature variation than PVI from aerial photography. The curve profiles show that the vegetation patches must reach a large size threshold before having a perceived effect on temperature values (Fig. 5).
Modelling spatial variation of temperature
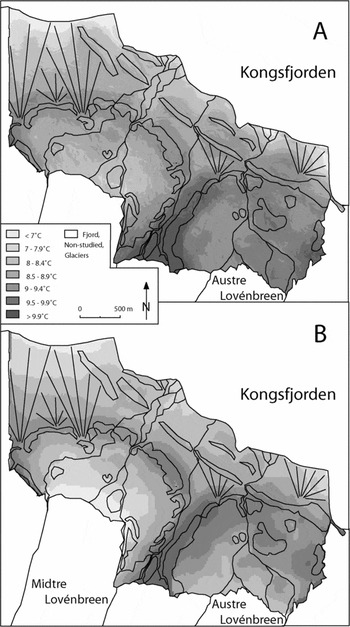
Finally, we applied the results to interpolate temperatures in the study area using a GIS based modelling approach (Brossard and others Reference Brossard, Elvebakk, Joly and Nilsen2002; Joly and others Reference Joly, Nilsen, Fury, Elvebakk and Brossard2003). The method automatically identifies the best explanatory variables and pixel resolution. Then the selected variables are linked in a multiple regression function. Both equations corresponding to the two available data sets (2 m and 20 m) are solved one independently of the other. Finally the regression coefficients are taken as cartographic operators to map the temperature distribution on the whole study area at 2 m and 20 m resolution. As example, Fig. 6 gives the estimated results for 17 July. Resulting temperature values are similar for both maps: low temperature at the coast line and near the terminus of the Middre Loven glacier, whereas the air is warm at the summit of the lateral moraines and in the central portion of the strandflat (flat coastal plain). Each model produces the same global distribution pattern, but some differences can be observed. Obviously, the map at the 2 m resolution produces more refined results, mainly at the inner part of the moraine belts where the topographical contrasts between hills, small valleys and bowls are at their maximum. On the contrary, the 20 m resolution map shows a more generalised view related to the main landscape components.
Temperature map for 17 July; A: 2 m resolution, B: 20 m resolution.

Discussion and conclusions
A set of windows having six different pixel resolution sizes from 6 m to 300 m derived from a digital terrain model (DTM) and remotely sensed image data provides the means to describe systematically environmental conditions and to identify, factor by factor, what is the most significant pixel resolution for explaining variation in temperature values in this high Arctic landscape. The procedure, based on mathematical correlations, tests the links between the daily temperature minima measured in the field and three variables processed from the multi-scale DTM and imagery databases.
The correlation between temperature and elevation value (DTM) provides a measure of the intensity of change along the vertical thermal gradient. The results shown here indicate that elevation induces a uniform influence on temperature, regardless of the source or scale of the data. Solar energy however, had its highest correlation with temperature minima for the medium pixel resolutions (14–60 m), whereas the vegetation index (PVI or NDVI) gave the best results when the coarser pixel resolutions are taken into account for processing the coefficients.
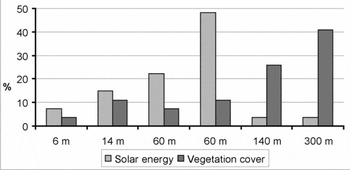
The analysis performed here was based upon only two study cases; minimum of temperature for the 17 July and for 5 August 1999; however, during the study period (from 12 July to 8 August 1999), each data logger provided 28 daily minimum temperature records. When this 28 day sequence is analysed, as a supplement to present a more robust analysis on the scale effects of the independent variables (solar energy and vegetation cover) on temperature, the statistic shows that the mode of the maximum coefficient is fixed on a 60 m pixel resolution size for the slope and solar energy, and upon a 300 m pixel resolution size for vegetation (Fig. 7). This helps substantiate the results obtained in this study that used only two days for the analysis (17 July and 5 August).
Frequency of maximum coefficients for the three explanatory variables, according to 6 spatial pixel resolutions.

Considerations of the effects of scale on potential temperature variations within a high Arctic area are significant because they indicate observations at different resolutions may produce significant results when analysed using different databases and spatial resolutions. As shown here, a high coefficient indicated a high dependence between temperature and one or more of the explanatory variables. For example, if the maximum coefficient is measured at the 3 m pixel resolution, this signifies that the temperature are potentially especially sensitive to the micro-local spatial variations of the variable; conversely, if the maximum coefficient is fixed on a 300 m pixel resolution size, this indicates that the spatial variations in temperatures are influenced by factors at a much larger landscape scale. Therefore, it is surmised that temperature is especially sensitive to variations in solar energy on a mean scale (60 m). In addition, it would appear that vegetation patches must reach a rather large size to have a perceptible effect on temperature measurements (taken at 20 cm above ground level).
Comparing the results between the two digital terrain model data sources (from GPS or from the Norsk Polarinstitut), one observes that the same coefficient for the 60 m pixel resolution size (window 4), and that the resulting coefficient curves partly diverge. On the contrary, coefficients are better with NDVI (satellite image) than with PVI (infrared aerial photograph).
On the basis of these results, the environmental factors considered show that the highest correlation with temperature minima is obtained for the medium (14 m to 60 m) pixel resolution size. If this conclusion is confirmed by further tests taking into account other variables and maximum temperatures, it would indicate that temperature distribution modelling is optimum when using readily obtainable (and often less expensive) data sources such as satellite images and DTMs available for large areas. It does not appear necessary to acquire spatial information at very high resolution under these conditions, even over small study areas, where the topography is very uneven and presents a multitude of microclimates over very large areas. However, the 2 m resolution DTM is perfectly adapted to applications that necessitate recourse to precise data at high resolution.
The significance of scale on climate and other environmental factors has been demonstrated on numerous occasions; however, it appears that the interpolation of the data over different scales must take them into account in order to improve the quality in the adjustment of temperatures over those same scales. Our research has been based on this principle. The explanatory variables proposed here are stated according to several pixel resolutions and analysing the differences and contributions of the different windows allows the identification of the optimal pixel resolution.