





1. Introduction
An airfoil encountering a highly unsteady flow is a classical fluid dynamics issue because of the time-varying part of flow velocity. This issue involves some significant problems like flutter, unsteady lift of an airfoil and loading on turbomachines (Barlas & Van Kuik Reference Barlas and Van Kuik2010; van Kuik et al. Reference van Kuik, Micallef, Herraez, van Zuijlen and Ragni2014). Although the relevant problems have been discussed for many years, it is still difficult to calculate the aerodynamic loads accurately. Such information is necessary for predicting the aeroelastic behaviour of an airfoil.
As early as 1935, Theodorsen (Reference Theodorsen1935) proposed the fundamental solution for an airfoil oscillating in a steady free stream. The validity of his theory has been verified by many experimental investigations (Silverstein & Joyner Reference Silverstein and Joyner1939; Reid Reference Reid1940; Halfman Reference Halfman1952; Rainey Reference Rainey1957), but the application of Theodorsen's theory to a helicopter blade is questionable (Johnson Reference Johnson1980), because of the bidimensionality of the flow and the largely nonlinear structural or aerodynamic phenomena. Sears (Reference Sears1941) analysed the transient lift development of an airfoil in a transverse gust by following the earlier work of non-uniform motion (von Karman & Sears Reference von Karman and Sears1938), and then calculated the fluctuations in lift of the rotors and stators of axial flow turbomachines (Kemp & Sears Reference Kemp and Sears1953, Reference Kemp and Sears1955). Isaacs (Reference Isaacs1945) was probably the first to calculate the lift force on an airfoil for the need of more accurate estimations of helicopter blade loads. He provided a complete solution to the lift force of an airfoil with constant attack angle when the incoming flow has variable magnitude. But for the case of variable attack angle, which is undeniably of importance for rotary wing aircraft, relevant calculations were not undertaken. About the same time, Greenberg (Reference Greenberg1947) developed a simplified solution for this case using a different method. He assumed a simple form of wake with a certain degree of approximation by extending the method of Theodorsen (Reference Theodorsen1935) and obtained the lift on an airfoil not only in a sinusoidal streamwise gust but also in pitching and plunging motions. Kottapalli (Reference Kottapalli1985) developed a similar theory for the same problem by assuming small pitching oscillation amplitudes with respect to the mean flow velocity. van der Wall & Leishman (Reference van der Wall and Leishman1994) compared the theories of Isaacs (Reference Isaacs1945), Greenberg (Reference Greenberg1947) and Kottapalli (Reference Kottapalli1985), and concluded that the theory of Isaacs is the only exact theory without additional simplification and extended the theory to arbitrary free-stream velocity variations and arbitrary motions. It must be noted that all these theoretical approaches are based on certain assumptions: incompressible potential flow, two-dimensional flat-plate airfoil, attached flow, planar and non-deforming wake and small disturbances.
As summarized above, the relevant theories for this classical issue have been developed for decades, but most of them have not been fully validated by experiments (Leishman Reference Leishman2002), especially the theory of Greenberg (Reference Greenberg1947), which has been widely used in applications for many years. Favier et al. (Reference Favier, Agnes, Barbi and Maresca1988) investigated the unsteady lift of a pitching airfoil in an unsteady free stream with moderate velocity amplitudes, but the experimental results were not compared with any theoretical prediction. Granlund et al. (Reference Granlund, Monnier, Ol and Williams2014) experimentally investigated the unsteady lift of a fixed NACA0009 airfoil in time-periodic sinusoidal gusts with a constant attack angle. Their experimental results agreed well with Greenberg's theory at small attack angles while there was a marked deviation at large attack angles. Strangfeld et al. (Reference Strangfeld, Müller-Vahl, Nayeri, Paschereit and Greenblatt2016) investigated a two-dimensional airfoil encountering a harmonic oscillation flow with high amplitude at constant attack angle using both theoretical calculations and experiments. They concluded that the method of Isaacs is more accurate compared with Greenberg's theory. However, most experimental investigations mentioned above focused on a fixed airfoil with a constant attack angle. But for an oscillating airfoil subject to a harmonic oscillation incoming flow, which was also derived by Greenberg (Reference Greenberg1947), relevant studies are still scarce. One important reason of this lack is probably due to the fact that such a pure harmonic oscillation flow is difficult to produce in a conventional wind tunnel. The most common approach for solving this problem is to modify a conventional wind tunnel (Szumowski & Meier Reference Szumowski and Meier1996; Harding, Payne & Bryden Reference Harding, Payne and Bryden2014). Another approach is using a louvre system (Kerstens et al. Reference Kerstens, Pfeiffer, Williams, King and Colonius2011; Granlund et al. Reference Granlund, Monnier, Ol and Williams2014; Monnier et al. Reference Monnier, Williams, Weier and Albrecht2016; Strangfeld et al. Reference Strangfeld, Müller-Vahl, Nayeri, Paschereit and Greenblatt2016). The quality of sinusoidal gusts for the first approach is limited by the effects of fan stall and large inertia. For the second approach, the louvre system would produce a pressure gradient that might cause an extra component of pressure on the airfoil. In that case, a multiple-fan actively controlled wind tunnel, which is specially designed for the purpose of producing a streamwise fluctuating flow, is an idea facility.
In this study, the unsteady lift on an oscillating airfoil encountering a sinusoidal streamwise gust is investigated using a multiple-fan actively controlled wind tunnel. The quality of the generated fluctuating flow was proved to be excellent (Yang et al. Reference Yang, Li, Ma and Li2017). The surface pressures of the airfoil are measured using DMS-4000 pressure scanners, and thus the lift force can be obtained by integration along the chord length of the airfoil. Experimental results of this study are compared with Greenberg's prediction. Using spectral analysis, the reasons for the small deviation between the experimental results and the theoretical results are discussed.
2. Theoretical description
Fundamental solutions for an oscillating airfoil in a steady free stream were given by Theodorsen (Reference Theodorsen1935). The validity of his theory has been verified by several experiments (Silverstein & Joyner Reference Silverstein and Joyner1939; Reid Reference Reid1940; Halfman Reference Halfman1952; Rainey Reference Rainey1957). For an airfoil in harmonic pitch oscillation, the unsteady lift is
 \begin{equation} F = {\rm \pi}\rho b^2\left(v\dot{\beta}-b\bar{a}\ddot{\beta}\right)+2{\rm \pi}\rho v b C(k)\left[v\beta+b\left(\tfrac{1}{2}-\bar{a}\right)\dot{\beta}\right], \end{equation}
where  $\rho$ is the air density,
 $b$ is the half-chord of the airfoil,
 $v$ is the streamwise wind velocity,
 $\bar {a}$ is the non-dimensional position of torsion axis of the airfoil measured from the centre,
 $\beta =\beta _0\cos (2{\rm \pi} f_{\beta } t)$ is pure pitch motion and
 $C(k)$ is the well-known Theodorsen function.
Theodorsen's theory was based on the following assumptions: incompressible potential flow, two-dimensional flat-plate airfoil, planar and non-deforming wake, small disturbances and attached flow. To extend that theory to an unsteady fluctuation stream, simply replacing the constant wind velocity  $v$ by fluctuation velocity
 $v=v_0(1+\sigma \sin (2{\rm \pi} f_vt))$ is not enough. The effect on both non-circulatory and circulatory forces should also be considered. On that basis, Greenberg (Reference Greenberg1947) extended Theodorsen's theory to the case of an oscillating airfoil encountering a periodically varying streamwise flow.
For the non-circulatory part, adding the effect of time-varying velocity and integrating the pressure difference over the entire airfoil gives the total non-circulatory force:
 \begin{equation} L_{nc}={\rm \pi}\rho b^2\left[v\dot{\beta}+\dot{v}(\alpha+\beta)-b\bar{a}\ddot{\beta}\right]. \end{equation}
While the non-circulatory moment is
 \begin{equation} M_{nc}={\rm \pi}\rho b^2\left[-v^2(\alpha+\beta)-b\bar{a}\dot{v}(\alpha+\beta)+b^2\left(\tfrac{1}{8}+\bar{a}^2\right)\ddot{\beta}\right]. \end{equation}
For the circulatory part, Greenberg made an assumption of high frequency to the wake velocity, which gives the wake a pure periodic form to simplify the derivation. Although the assumption of high frequency for the wake integrals is questionable, it is concluded to be equivalent to a small  $\sigma$ approximation for parts of the wake (van der Wall & Leishman Reference van der Wall and Leishman1994). On that basis, the circulatory force can be derived as
 \begin{align} L_c&=2{\rm \pi}\rho vb\left\{\vphantom{\tfrac{1}{2}}v_0\alpha+\sigma v_0\alpha C(k_v)\textrm{e}^{\textrm{i}\omega_v t} +\left[\textrm{i}\omega_{\beta} \beta_0 b\left(\tfrac{1}{2}-\bar{a}\right)+v_0\beta_0\right]C(k_{\beta})\textrm{e}^{\textrm{i}\omega_{\beta} t}\right.\nonumber\\ &\quad+\left.\sigma v_0\beta_0 C(k_{v+\beta})\textrm{e}^{\textrm{i}(\omega_{v}+\omega_{\beta}) t}\vphantom{\tfrac{1}{2}}\right\}, \end{align}
where  $k_v=2{\rm \pi} f_v b/v_0$,
 $k_{\beta }=2{\rm \pi} f_{\beta } b/v_0$ and
 $k_{v+\beta }=2{\rm \pi} f_{v+\beta }b/v_0$. Using the same method, the circulatory moment is
 \begin{align} M_c&= {\rm \pi}\rho vb^2\left[v(\alpha+\beta)+\dot{\beta}b\left(\tfrac{1}{2}-\bar{a}\right)\right] -2{\rm \pi}\rho vb^2\left(\tfrac{1}{2}+\bar{a}\right)\left\{\vphantom{\tfrac{1}{2}}v_0\alpha+\sigma v_0\alpha C(k_v)\textrm{e}^{\textrm{i}\omega_v t} \right.\nonumber\\ &\quad+\left.\left[b\left(\tfrac{1}{2}-\bar{a}\right)\dot{\beta} +v_0\beta\right]C(k_{\beta})+\sigma v_0\beta C(k_{v+\beta})\textrm{e}^{\textrm{i}\omega_v t}\right\}. \end{align}
Adding (2.2) and (2.4) gives the total lift force:
 \begin{align} L&={\rm \pi}\rho b^2\left[v\dot{\beta}+\dot{v}(\alpha+\beta)-b\bar{a}\ddot{\beta}\right]+2{\rm \pi}\rho vb\left\{\vphantom{\tfrac{1}{2}}v_0\alpha+\sigma v_0\alpha C(k_v)\textrm{e}^{\textrm{i}\omega_v t}\right.\nonumber\\ &\quad+\left.\left[b\left(\tfrac{1}{2}-\bar{a}\right)\dot{\beta} +v_0\beta\right]C(k_{\beta})+\sigma v_0\beta C(k_{v+\beta})\textrm{e}^{\textrm{i}\omega_v t}\right\}. \end{align}
Adding (2.3) and (2.5) gives the total moment:
 \begin{align} M&={\rm \pi}\rho b^2\left[vb\left(\tfrac{1}{2}-\bar{a}\right)\dot{\beta}-b\bar{a}\dot{v}(\alpha+\beta)+b^2\left(\tfrac{1}{8}+\bar{a}^2\right)\ddot{\beta}\right]\nonumber\\ &\quad-2{\rm \pi}\rho vb^2\left(\tfrac{1}{2}+\bar{a}\right)\left\{\vphantom{\tfrac{1}{2}}v_0\alpha+\sigma v_0\alpha C(k_v)\textrm{e}^{\textrm{i}\omega_v t}\right.\nonumber\\ &\quad+\left.\left[b\left(\tfrac{1}{2}-\bar{a}\right)\dot{\beta} +v_0\beta\right]C(k_{\beta})+\sigma v_0\beta C(k_{v+\beta})\textrm{e}^{\textrm{i}\omega_v t}\right\}. \end{align}
For the case of pure harmonic pitch oscillation without constant attack angles:
 \begin{align} L_s&={\rm \pi}\rho b^2\left[v\dot{\beta}+\dot{v}\beta-b\bar{a}\ddot{\beta}\right]\nonumber\\ &\quad+2{\rm \pi}\rho vb\left\{\left[b\left(\tfrac{1}{2}-\bar{a}\right)\dot{\beta} +v_0\beta\right]C(k_{\beta}) + \sigma v_0\beta C(k_{v+\beta})\textrm{e}^{\textrm{i}\omega_v t}\right\}, \end{align}
 \begin{align} M&= {\rm \pi}\rho b^2\left[vb\left(\tfrac{1}{2}-\bar{a}\right)\dot{\beta}-b\bar{a}\dot{v}\beta+b^2\left(\tfrac{1}{8}+\bar{a}^2\right)\ddot{\beta}\right]\notag\\&\quad-2{\rm \pi}\rho vb^2\left(\tfrac{1}{2}+\bar{a}\right)\left\{\left[b\left(\tfrac{1}{2}-\bar{a}\right)\dot{\beta} +v_0\beta\right]C(k_{\beta})+\sigma v_0\beta C(k_{v+\beta})\textrm{e}^{\textrm{i}\omega_v t}\right\}. \end{align}
After normalizing all dynamic effects, the non-dimensional lift coefficient is
 \begin{gather} C_L=\frac{L_s}{2{\rm \pi}\rho b {v_0}^2 \beta_0}, \end{gather}
 \begin{gather} C_M=\frac{L_s}{4{\rm \pi}\rho b^2 {v_0}^2 \beta_0}. \end{gather}
It should be noticed that there are three frequencies included in the unsteady lift development, which are the frequency of harmonic pitch oscillation  $f_{\beta }$, the sum frequency
 $f_{sum}=f_{\beta }+f_v$ and the difference frequency
 $f_{diff}=|f_{\beta }-f_v|$ generated by the product of
 $\sin (2{\rm \pi} f_vt))$ and
 $\cos (2{\rm \pi} f_{\beta } t)$. However, as far as we know, no experimental research has reported the existence of the sum frequency and difference frequency. A relevant study set the gust fluctuation frequency the same as the model oscillating frequency in experiments for consideration of engineering applications (Strangfeld et al. Reference Strangfeld, Rumsey, Mueller-Vahl, Greenblatt, Nayeri and Paschereit2015).
3. Experimental set-up
3.1. Sinusoidal streamwise gust
The experiment was conducted in the multiple-fan actively controlled wind tunnel of the State Key Laboratory of Disaster Reduction in Civil Engineering at Tongji University, Shanghai, China. Unlike conventional wind tunnels, this actively controlled wind tunnel has 120 individual fans arranged in a  $10 \times 12$ matrix to produce specific forms of flow, including a sinusoidal streamwise gust. Each fan can work independently and is controlled by computer. By inputing specific parameters, a sinusoidal streamwise gust
 $v=v_0(1+\sigma \sin (2{\rm \pi} f_vt))$ can be generated with predetermined oscillation frequency
 $f_v$, mean flow velocity
 $v_0$ and amplitude of velocity variation
 $\sigma$. Figure 1 shows a comparison of the measured streamwise gust with the targeted streamwise velocity. The oscillation frequency is
 $f_v=1\ \textrm {Hz}$. It is clear from figure 1(a) that the two velocity time histories match very well. The ideal mean stream velocity is
 $v_{0,{ideal}}=10.5\ \textrm {m}\,\textrm {s}^{-1}$ while the measured mean stream velocity is
 $v_{0,{measured}}=10.6\ \textrm {m}\,\textrm {s}^{-1}$. The expected amplitude of velocity variation is
 $\sigma _{ideal}=0.2$ while the measured one is
 $\sigma _{{measured}}=0.196$, resulting in a difference of 2 %. Figure 1(b) shows the spectral analysis of the two time histories of velocity. It is obvious that there is only one marked peak in the spectra, which is consistent with the expected oscillation frequency
 $f_v=1\ \textrm {Hz}$. Therefore, the sinusoidal streamwise gust produced by the multiple-fan actively controlled wind tunnel is of good quality.
 $(a)$ Time history of the sinusoidal streamwise gust.
 $(b)$ The corresponding Fourier amplitude spectrum of the gust. The grey line is the measured signal while the red dashed line is the expected velocity. Here
 $v_{0,measured}=10.6\ \textrm {m}\,\textrm {s}^{-1}$,
 $v_{0,ideal}=10.5\ \textrm {m}\,\textrm {s}^{-1}$,
 $\sigma _{ideal}=0.2$,
 $\sigma _{{measured}}=0.196$,
 $f_v=1\ \textrm {Hz}$.

3.2. Oscillating airfoil
Figure 2 shows a schematic of the experimental set-up. A two-dimensional NACA0015 airfoil is oscillating in the multiple-fan actively controlled wind tunnel. The NACA0015 airfoil has a chord length of  $2b=0.4\ \textrm {m}$ and a span of
 $s=1.2\ \textrm {m}$ while the test section of the wind tunnel is
 $1.5\ \textrm {m} \times 1.8\ \textrm {m}$. A forced-oscillation rig is installed in the test section to make the airfoil oscillate in the sinusoidal streamwise gust. The forced-oscillation rig consists of four linear actuators and each actuator can work independently. With a phase difference of
 ${\rm \pi}$ between the front actuators and rear actuators, the airfoil can oscillate in pure pitch motion
 $\beta =\beta _0\cos (2{\rm \pi} f_{\beta } t)$ of amplitude
 $\beta _0$ and frequency
 $f_{\beta }$. To measure the surface pressure distribution of the airfoil, two chord-wise strips are set on the airfoil surface, each strip having 48 taps. These two strips are connected to DMS-4000 pressure scanners, which can acquire the dynamic pressure. Integration along the chord length of the airfoil gives the total lift force
 $F=\sum P_{i}L_{i}\cos \theta _{i}$. Here
 $P_{i}$ is the pressure of point
 $i$,
 $L_{i}$ is the integral length of point
 $i$ and
 $\theta _{i}$ is the angle between the inner normal and the horizontal plane.
Sketch of experimental set-up for an oscillating airfoil encountering a sinusoidal streamwise gust.

In order to identify the sum frequency  $f_{sum}=f_{\beta }+f_v$ and the difference frequency
 $f_{diff}=|f_{\beta }-f_v|$, the pitch motion frequency is set as
 $f_{\beta }=1.4$ and 1.7 Hz to differ from the frequency of the sinusoidal streamwise gust
 $f_v=1\ \textrm {Hz}$. The pitch angles are
 $\beta _0 =1^{\circ }$ and
 $2^{\circ }$.
4. Results and discussion
Figure 3 shows a comparison between the measured phase-averaged unsteady lift coefficient and the theoretical prediction of Greenberg (Reference Greenberg1947). Because of the difference in frequency between stream oscillation and pitch motion, there should be three frequencies included in the lift development. In that case, the unsteady lift is not harmonic and each pitch motion cycle is different. Figures 3(a) and 3(b) show the results of the first six cycles of pitch motion for  $f_{\beta } = 1.4$ and 1.7 Hz, respectively. It should be noticed that for pitch motion frequency
 $f_{\beta } = 1.7\ \textrm {Hz}$, the whole period of the lift development has 17 pitch motion cycles, which also contains 27 cycles of sum frequency and 7 cycles of difference frequency. Similarly, for pitch motion frequency
 $f_{\beta } = 1.4\ \textrm {Hz}$, the whole period of the lift development has 7 pitch motion cycles, which contains 12 cycles of sum frequency and 2 cycles of difference frequency. In general, the experimental results in figure 3 are in good agreement with the theoretical prediction and all three curves have exactly the same trend. It is clear that the non-dimensional lift is nearly the same for the two different pitching amplitudes (
 $\beta _0=1^{\circ }$ and
 $2^{\circ }$), but the difference between the experimental results and the theoretical prediction should not be ignored. For pitching frequency
 $f_{\beta } = 1.4\ \textrm {Hz}$, the deviation is obvious in the range
 $90^{\circ}<\phi <270^{\circ }$, in cycle 1. In cycle 4, the same deviation can be seen in the same range. For pitching frequency
 $f_{\beta } = 1.7\ \textrm {Hz}$, it can be seen clearly that the period of motion is different from that of
 $f_{\beta } = 1.4\ \textrm {Hz}$, which means the component at pitch motion frequency has a significant effect on the lift development. However, similar deviation can also be seen in the range
 $90^{\circ }<\phi <270^{\circ }$ in cycles 1 and 3. It can be concluded that the difference between the experimental results and the theoretical prediction shows a kind of periodicity.
Time history of non-dimensional unsteady lift coefficient of the first six cycles. The airfoil is pitched continuously with amplitude  $\beta _0 =1^{\circ }$ and
 $2^{\circ }$. The sinusoidal incoming flow is
 $v=v_0(1+\sigma \sin (2{\rm \pi} f_vt))$ with
 $v_0=10.6\ \textrm {m}\,\textrm {s}^{-1}$,
 $\sigma =0.2$ and
 $f_v=1\ \textrm {Hz}$.
 $(a)$ Pitch motion frequency is
 $f_{\beta }=1.4\ \textrm {Hz}$.
 $(b)$ Pitch motion frequency is
 $f_{\beta }=1.7\ \textrm {Hz}$. Experimental results are compared with Greenberg's prediction, which is represented by red solid line. Markers (1)–(6) represent cycles 1–6, respectively.

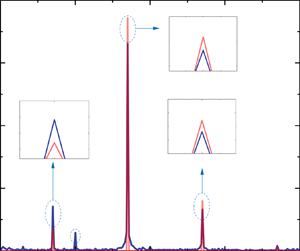
In order to study the specific reason for the deviation between the experimental results and the theoretical prediction, spectral analysis is conducted to compare the amplitude of each part directly. Figure 4 shows the corresponding Fourier amplitude spectrum of the unsteady lift coefficient. As predicted by the Greenberg theory, the sum frequency  $f_{sum}=f_{\beta }+f_v$ and the difference frequency
 $f_{diff}=|f_{\beta }-f_v|$ can be seen obviously in the experimental results. As far as we know, this is the first time for these two frequencies being observed in experiments. The results show that the amplitude of pitch motion frequency
 $f_{\beta }$ is very close to the theoretical value, which is mainly affected by the mean velocity of the incoming flow. For the amplitudes of the sum frequency
 $f_{sum}$ and the difference frequency
 $f_{diff}$, which are also affected by the fluctuation intensity of the incoming flow, results are quite different. The amplitude of the sum frequency
 $f_{sum}$ is also very close to the theoretical value while the amplitude of the difference frequency
 $f_{diff}$ has a significant error. In addition, there is another obvious peak in the experimental results, which has the same frequency as the sinusoidal streamwise gust. The reason for such a frequency component is probably due to the existence of a small steady attack angle, which is almost inevitable in such an actively controlled wind tunnel.
The Fourier amplitude spectrum of the unsteady lift coefficient. Pitch motion frequency  $f_{\beta }=1.7\ \textrm {Hz}$, sinusoidal streamwise gust frequency
 $f_v=1\ \textrm {Hz}$, sum frequency
 $f_{sum}=2.7\ \textrm {Hz}$ and difference frequency
 $f_{diff}=0.7\ \textrm {Hz}$. The parameters of the sinusoidal streamwise gust are:
 $v_0=10.6\ \textrm {m}\,\textrm {s}^{-1}$,
 $\sigma =0.2$ and
 $f_v=1\ \textrm {Hz}$. Experimental results for
 $\beta _0=2^{\circ }$, represented by blue solid line, are compared with Greenberg's prediction, represented by red solid line.

Figure 4 indicates that the frequency component of pitching frequency, the sum frequency and the difference frequency are dominant in the unsteady lift. To discuss the difference of each part between the experimental results and theoretical values, the amplitudes and phases of different pitch motion frequency ( $\,f_{\beta }=1.4$ and 1.7 Hz), sum frequency
 $f_{sum}$ and difference frequency
 $f_{diff}$ are given in figures 5 and 6, respectively. Each plot represents the amplitude of every ‘dominant’ harmonic in the unsteady lift. Here the reduced frequencies are varying by changing the mean flow speed and keeping pitch frequencies constant. In each group of plots, the correlation of the theoretical results with the experimental results is good. The amplitude of non-dimensional lift coefficient of each frequency has the same variation trend as Greenberg's theory. To be specific, the amplitudes of the experimental results agree well with the theoretical values for the pitching frequency component, as shown in figures 5(a) and 6(a). The small deviation is probably due to the effect of the thickness of the NACA0015 airfoil (Glegg & Devenport Reference Glegg and Devenport2009; Motta, Guardone & Quaranta Reference Motta, Guardone and Quaranta2015). Experimental results of phase angles of unsteady loads with respect to motion are also shown in figures 5(a) and 6(a). It can be seen that the agreement between the theoretical and experimental results is generally good according to the plots. Moreover, the non-dimensional lift is nearly the same for the two different pitching amplitudes. This is in accordance with linear theory with respect to the pitching amplitude for the range of pitching amplitudes considered, and in good agreement with the findings of Halfman (Reference Halfman1952). This also implies that any offset in the steady angle of attack is likely to have a small effect. Figures 5(b) and 6(b) show a comparison of amplitudes for the sum frequency component. The agreement between the experimental results and theoretical predictions for
 $f_{\beta } = 1.4$ and 1.7 Hz is still reasonably good. The variation tendencies with the reduced frequencies for the theoretical predictions and experimental results of both
 $\beta _0=1^{\circ}$ and
 $2^{\circ}$ are identical. Moreover, the correlation of the theoretical results with the experimental results for phase angles is also good. Both experimental results and theoretical prediction of phase angles have the same variation tendency, with the difference being very small for the motion frequency component and the sum frequency component. However, for the difference frequency component, as shown in figures 5(c) and 6(c), the difference between the experimental results and theoretical prediction is relatively marked. It can be seen that the amplitudes of
 $f_{diff}$ have similar values to those of
 $f_{sum}$ while Greenberg's theory indicates that the amplitudes of
 $f_{sum}$ should be larger than those of
 $f_{diff}$. In addition, deviation of phase angles between the experimental results and theoretical prediction is also significant according to the plots. However, the absolute difference between the theoretical and experimental results of the lift in figures 5(a) and 6(a) is about the same as that in figures 5(c) and 6(c). Thus, the lift coefficient still agrees well with Greenberg's theory in general. It can be concluded that the agreement between theory and experiment is best for the frequency component of pitching frequency, and still reasonably good for the sum frequency component and least good for the difference frequency component, since that is also the order of the relative magnitudes of the lifts at each of these frequency components.
Normalized lift amplitudes of  $(a)$ pitch motion frequency
 $f_{\beta }$,
 $(b)$ sum frequency
 $f_{sum}$ and
 $(c)$ difference frequency
 $f_{diff}$ with different reduced frequency. Here
 $f_{\beta }=1.4\ \textrm {Hz}$,
 $k_{\beta }=2{\rm \pi} f_{\beta } b/v_0$,
 $k_{\beta +v}=2{\rm \pi} f_{sum}b/v_0$,
 $k_{|\beta -v|}=2{\rm \pi} f_{diff}b/v_0$.

Normalized lift amplitudes of  $(a)$ pitch motion frequency
 $f_{\beta }$,
 $(b)$ sum frequency
 $f_{sum}$ and
 $(c)$ difference frequency
 $f_{diff}$ with different reduced frequency. Here
 $f_{\beta }=1.7\ \textrm {Hz}$,
 $k_{\beta }=2{\rm \pi} f_{\beta } b/v_0$,
 $k_{\beta +v}=2{\rm \pi} f_{sum}b/v_0$,
 $k_{|\beta -v|}=2{\rm \pi} f_{diff}b/v_0$.

Figures 7 and 8 show the amplitudes and phase angles of moment coefficient of pitching frequency  $f_{\beta } = 1.4$ and 1.7 Hz with different reduced frequencies, which are varying by changing the mean flow speed and keeping pitch frequencies constant. In general, the correlation between the theoretical results and the experimental results is good. Similar to the plots of lift coefficient in figures 5 and 6, the amplitude of non-dimensional lift coefficient of each frequency has the same variation trend as Greenberg's theory. The experimental results of the pitching frequency component agree well with the theoretical values, as shown in figures 7(a) and 8(a). Plots of phase angles of unsteady loads with respect to motion also have a good agreement between experiment and theory. Figures 7(b) and 8(b) present the results of the sum frequency component. The amplitudes obtained by the experiment still agree well with Greenberg's prediction while a significant difference is observed for the phase plots. For the difference frequency component shown in figures 7(c) and 8(c), the differences of amplitudes between the experimental results and theoretical prediction are relatively marked. However, the experimental results of phase angles agree well with the theoretical values. It can be concluded that the amplitudes of moment coefficient of the experimental results agree reasonably well with the theoretical prediction, which is similar to that for lift coefficients.
Normalized moment amplitudes of  $(a)$ pitch motion frequency
 $f_{\beta }$,
 $(b)$ sum frequency
 $f_{sum}$ and
 $(c)$ difference frequency
 $f_{diff}$ with different reduced frequency. Here
 $f_{\beta }=1.4\ \textrm {Hz}$,
 $k_{\beta }=2{\rm \pi} f_{\beta } b/v_0$,
 $k_{\beta +v}=2{\rm \pi} f_{sum}b/v_0$,
 $k_{|\beta -v|}=2{\rm \pi} f_{diff}b/v_0$.

Normalized moment amplitudes of  $(a)$ pitch motion frequency
 $f_{\beta }$,
 $(b)$ sum frequency
 $f_{sum}$ and
 $(c)$ difference frequency
 $f_{diff}$ with different reduced frequency. Here
 $f_{\beta }=1.7\ \textrm {Hz}$,
 $k_{\beta }=2{\rm \pi} f_{\beta } b/v_0$,
 $k_{\beta +v}=2{\rm \pi} f_{sum}b/v_0$,
 $k_{|\beta -v|}=2{\rm \pi} f_{diff}b/v_0$.

Figure 9 shows the lift amplitudes and phase angles of flow frequency component with different reduced frequencies. To compare the magnitude between different  $\beta _0$, the lift amplitudes are normalized by
 $2{\rm \pi} \rho b{v_0}^2$, and thus the effect of pitching amplitude
 $\beta _0$ is considered. In each group of plots, it is clear that the amplitudes decrease slowly with the increase of reduced frequency while the phase angles remain almost unchanged. The amplitudes for
 $\beta _0=1^{\circ }$ are nearly equal to those for
 $2^{\circ }$. This implies that the pitching amplitude
 $\beta _0$ has almost no effect on this frequency component. Moreover, the amplitudes for
 $f_{\beta }= 1.4\ \textrm {Hz}$ in figure 9(a) are identical to those for
 $f_{\beta }= 1.7\ \textrm {Hz}$ in figure 9(b), which implies that the pitch frequency
 $f_{\beta }$ also has no effect on this frequency component. It seems that the flow frequency component is only affected by the incoming flow. As we discussed before, the reason causing this frequency component is probably due to the existence of a small steady attack angle, which is almost inevitable in such an actively controlled wind tunnel. Greenberg (Reference Greenberg1947) discussed the lift force caused by a steady attack angle. According to his theory, this component should not be affected by the forms of motion but by the incoming flow and the steady attack angle. This is in accordance with the experimental results. The validity of Greenberg's theory for a steady attack angle has been discussed by van der Wall & Leishman (Reference van der Wall and Leishman1994) and Strangfeld et al. (Reference Strangfeld, Müller-Vahl, Nayeri, Paschereit and Greenblatt2016).
Normalized lift amplitudes and phase angles of gust frequency with different reduced frequencies:  $(a)$
 $f_{\beta }=1.4\ \textrm {Hz}$;
 $(b)$
 $f_{\beta }=1.7\ \textrm {Hz}$. Here
 $f_v=1\ \textrm {Hz}$,
 $k_v=2{\rm \pi} f_v b/v_0$.

5. Conclusion
A sinusoidal streamwise gust of high quality was generated by the multiple-fan actively controlled wind tunnel. Using the forced-oscillation rig, a NACA0015 airfoil oscillated in the wind tunnel test. In the case of an oscillating airfoil ( $\,f_{\beta }=1.4$ and 1.7 Hz,
 $\beta _0=1^{\circ }$ and
 $2^{\circ }$) encountering the sinusoidal streamwise gust with different oscillating frequencies (
 $\,f_v=$ 1Hz,
 $\sigma=0.2$), the unsteady lift force was measured by DMS-4000 pressure scanners, and compared with Greenberg's theoretical prediction. It was found that the experimental results agree generally well with the theoretical values. Through spectral analysis, it can be concluded that there are two main reasons for the small deviation between the experimental and theoretical values. First, the component of gust frequency caused by the small steady attack angle, which is almost inevitable in such an actively controlled wind tunnel, is likely to have a small effect. This could be the reason for the poorer agreement for the component of difference frequency. Second, the thickness of the NACA0015 airfoil may have a small effect on the lift and moment, which has been discussed by many researchers.
In conclusion, the sum frequency  $f_{sum}=f_{\beta }+f_v$ and the difference frequency
 $f_{diff}=|f_{\beta }-f_v|$ discussed by Greenberg (Reference Greenberg1947) are confirmed to exist as determined through spectral analysis. This is probably the first time for these two frequencies being observed in experiments. It can be concluded that the agreement between theory and experiment is best for the frequency component of pitching frequency, and still reasonably good for the sum frequency component and least good for the difference frequency component, since that is also the order of the relative magnitudes of the lifts at each of these frequency components. In general, the experimental results for unsteady lift force of the oscillating airfoil in the sinusoidal streamwise gust with a small amplitude (
 $\sigma =0.2$) agree well with Greenberg's prediction, while there is a small difference. The main reasons for the deviation may be the thickness of the airfoil and the steady attack angle. In further works, experiments of an oscillating airfoil with an attack angle will be carried out to study the effect of the attack angle. For an oscillating airfoil encountering a sinusoidal streamwise gust of arbitrary oscillating frequency, Greenberg's theory appears to be an appropriate approach.
Acknowledgements
This work was funded by the National Natural Science Foundation of China under grant no. 51878580.
Declaration of interests
The authors report no conflict of interest.



