INTRODUCTION
Neotropical rain forests have the highest plant and animal diversity of all terrestrial ecosystems. Vertical stratification of resources and their consumers in tropical rain forest has intrigued researchers for decades (Bernard Reference BERNARD2001, Bonaccorso Reference BONACCORSO1978, Handley Reference HANDLEY1967, Kalko & Handley Reference KALKO and HANDLEY2001). The high abundance of resources, especially fruit, throughout all strata suggests that spatial distribution of species reflects resource partitioning within the community. Vertical stratification may be due to differences in light, temperature, humidity, vegetation density, food and risk of predation, as well as relative mobility of species (Schulze et al. Reference SCHULZE, LINSENMAIR and FIEDLER2001, Walther Reference WALTHER2002). Studies of invertebrates (e.g. Lepidoptera, Schulze et al. Reference SCHULZE, LINSENMAIR and FIEDLER2001) and vertebrates (Shanahan & Compton Reference SHANAHAN and COMPTON2001) have linked vertical stratification to the availability of food resources. Bats are nocturnal animals capable of powered flight and are thus an ideal consumer group to provide insight into spatial distribution in highly diverse assemblages. Phyllostomid bats are especially suitable, as they are the most ecologically diverse mammalian family on the planet, exploit food resources from all strata and form assemblages of extremely high species richness (Bass et al. Reference BASS, FINER, JENKINS, KREFT, CISNEROS-HEREDIA, McCRACKEN, PITMAN, ENGLISH, SWING, VILLA, DiFIORE, VOIGT and KUNZ2010, Kalko & Handley Reference KALKO and HANDLEY2001, Rex et al. Reference REX, KELM, WIESNER, KUNZ and VOIGT2008, Reference REX, CZACZKES, MICHENER, KUNZ and VOIGT2010). Vertical stratification has previously been studied by mist netting at various heights above ground level and bat species were categorized accordingly as understorey-, subcanopy- or canopy-foraging species (Bonaccorso Reference BONACCORSO1978, Handley Reference HANDLEY1967, Kalko & Handley Reference KALKO and HANDLEY2001, Pereira et al. Reference PEREIRA, MARQUES and PALMEIRIM2010). However, bats might use different strata to commute than for foraging to avoid predators or dense vegetation, so capture height should reflect a combination of both – the height at which bats commute and the height at which they forage. Information on foraging heights of bats rather than their commuting activity is needed to gain insight into their resource utilization.
In this study, we estimate foraging height of phytophagous bats using the stable carbon isotope ratio (13C/12C) in their body tissue. Previous studies have found that the ratio of 13C/12C in forest air and plant material varies among forest strata due to different rates of respiration among strata (Buchmann et al. Reference BUCHMANN, BROOKS and EHLERINGER2002, Sternberg et al. Reference STERNBERG, MULKEY and WRIGHT1989, van der Merwe & Medina Reference VAN DER MERWE and MEDINA1989, Reference VAN DER MERWE and MEDINA1991; Voigt Reference VOIGT2010). Enzymes associated with respiration break down glucose, CO2 is produced and released. The enzymes select for glucose molecules containing 12C atoms, so that mostly CO2 containing 12C atoms is released. Thus, soil respiration depletes the air near the ground of 13C, whereas the high rates of photosynthesis in the canopy have the opposite effect and lead to enrichment in 13C in the surrounding air (Medina & Minchin Reference MEDINA and MINCHIN1980). Since plants assimilate carbon from the air through photosynthesis, the 13C/12C ratio of the air is reflected in nearby plant tissue. A δ13C gradient exists in plants, where 13C/12C ratio of understorey plants are about 5‰ lower than those of canopy plants (Cerling et al. Reference CERLING, HART and HART2004, van der Merwe & Medina Reference VAN DER MERWE and MEDINA1989). Frugivorous bats obtain the majority of their carbon from plant material, and accordingly the 13C/12C ratio of their mostly fruit-based diet is reflected in their body tissue (DeNiro & Epstein Reference DENIRO and EPSTEIN1978, Fleming et al. Reference FLEMING, NUNEZ and STERNBERG1993, Tieszen et al. Reference TIESZEN, BOUTTON, TESDAHL and SLADE1983, Voigt et al. Reference VOIGT, MATT, MICHENER and KUNZ2003). The δ13C values (13C/12C ratio in relation to a standard) of the body tissue of bats yield information about their foraging height.
We examined the vertical δ13C gradient in plants in two Neotropical lowland rain forests and determined the height from which phyllostomid bats derive their food. We present data on 54 phyllostomid bat species that include plant components in their diet (Rex et al. Reference REX, CZACZKES, MICHENER, KUNZ and VOIGT2010). We expected species to be distributed along the vertical forest axis with smaller species foraging in the understorey and larger species feeding on the large fruits from tall canopy trees (Kalko et al. Reference KALKO, HERRE and HANDLEY1996). Additionally, we compared capture strata and foraging heights of phyllostomid bats to gain further insight into their foraging behaviour. We expected capture height to be lower than foraging height in phyllostomid bats, because vegetation provides cover from moonlight and bats might potentially avoid predators by commuting in the more cluttered understorey vegetation.
MATERIALS AND METHODS
Data were collected from two Neotropical lowland rain forest sites, La Selva Biological Station (LS) and Tiputini Biodiversity Station (TBS). LS (10°25′52″N, 84°00′12″W) is located in the Caribbean lowland of Costa Rica, whereas the TBS (0°38.31′S, 76°8.92′W) is located in the Amazonian lowland rain forest of eastern Ecuador adjacent to the Yasuní Biosphere Reserve. Both study sites are situated within an extensive area of primary forest. For detailed description see Rex et al. (Reference REX, KELM, WIESNER, KUNZ and VOIGT2008, Reference REX, CZACZKES, MICHENER, KUNZ and VOIGT2010).
Bats were captured in nylon mist nets from September to November 2004 (rainy season) and from March to May 2005 (dry season). We set 36 × 2.5-m of ground nets and a 9 × 3-m canopy net at 10 arbitrarily chosen 1-ha plots for about 40 full nights at each site (20 nights for each study period). We did not intentionally set nets near fruiting or flowering plants to avoid introducing a sampling bias. Bats were identified according to Timm & LaVal (Reference TIMM and LAVAL1998) and Baker (Reference BAKER2002) for Costa Rican species and several taxonomic keys and publications for Ecuadorian species (Albuja Reference ALBUJA1999, Tirira Reference TIRIRA1999). For further details see Rex et al. (Reference REX, KELM, WIESNER, KUNZ and VOIGT2008, Reference REX, CZACZKES, MICHENER, KUNZ and VOIGT2010). Bats were banded with a coloured and numbered plastic split ring (A.C. Hughes Ltd., London, UK) on the right forearm (males) or left forearm (females) to recognize recaptures. Wing tissue samples were taken from each bat in the field using a sterile, 3-mm-diameter biopsy punch. In the laboratory, wing tissue samples were dried at 50 °C for 3 d and weighed on a Sartorius microbalance (Satorius AG, Göttingen, Germany). They were subsequently loaded in tin capsules and analysed with a mass spectrometer in Boston University's Stable Isotope Laboratory to determine 13C/12C ratio (δ13C) and 15N/14N ratio (δ15N). The values are given in reference to an international standard using equation (1). Nitrogen isotope ratios (δ15N) were used to calculate the trophic position of bats equation (2) and carbon stable isotope data (δ13C) to calculate the bats' foraging height.

where nX represents 13C or 15N, respectively; Rsample and Rstandard are the 13C/12C and 15N/14N ratios of the sample and standard, respectively. Peedee belemnite marine limestone (PDB) was used as the isotope reference standard for carbon stable isotope measurements, air nitrogen as a standard for nitrogen isotope measurements (Farquhar et al. Reference FARQUHAR, DEHLERINGER and HUBICK1989, Peterson & Fry Reference PETERSON and FRY1987).
At each plot, we also collected insects (orders Orthoptera and Lepidoptera) in the understorey, as well as leaves and if possible fruit from five understorey (0–5 m height above ground), subcanopy (10–15 m) and canopy (>20 m) plant species, respectively. Understorey plants were collected both from gaps and under the forest shade as previous studies have shown them not to differ in δ13C values (Medina et al. Reference MEDINA, STERNBERG and CUEVAS1991). All plant material was dried and ground, and 1–2 mg of each sample was analysed in a mass spectrometer in an identical manner to the wing tissue samples. For those plants for which fruits were available, we tested for differences in isotope ratios between fruit and leaf tissue of the same plant (Δ13Cleaf-fruit = δ13Cleaf − δ13Cfruit). A δ13C above −15‰ indicated C4 or CAM metabolism of the plant (Fleming et al. Reference FLEMING, NUNEZ and STERNBERG1993) and respective samples were excluded from the analyses.
Establishing the vertical δ13C gradient of plants for each site and season
For each study site we calculated a linear regression using the least squares method for the relationship between δ13C and the height from which the plant material was collected. From this regression we obtained the slope of the vertical gradient in δ13C of plants. If δ13C of fruit tissue differed from δ13C of leaf tissue, we added mean Δ13Cleaf-fruit to the values of leaf tissue.
Assessing the trophic level of each bat
δ13C values of bat tissue do not correspond directly to δ13C values of plants, because 13C is enriched in animal tissue in relation to the diet and thus varies according to the bat's trophic position. Thus, δ13C values of wing tissue were corrected for trophic δ13C enrichment based on the expected trophic level (TL) of each species. The latter was calculated from the δ15N value of the wing tissue (data presented in Rex et al. Reference REX, CZACZKES, MICHENER, KUNZ and VOIGT2010), using equation (2).

where δ15Nbat (‰) is the 15N/14N ratio of the bat's wing membrane in relation to air nitrogen, δ15Nplants (‰) is the average 15N/14N ratio of all collected plants in relation to air nitrogen, and Δ15N is the increase of δ15N per trophic step (e.g. from plants to insects).
To determine Δ15N, we averaged the enrichment in δ15N from plant to insect, from insects to insectivorous non-phyllostomid bat species (Emballonuridae, Molossidae, Verpertilionidae) and from plants to frugivorous bat species (see Rex et al. Reference REX, CZACZKES, MICHENER, KUNZ and VOIGT2010 for details and results). Recognized trophic levels were 1 for phytophagous species, 2 for insectivorous and 3 for carnivorous species and intermediate values for species with a mixed diet.
Correcting the δ13C values of bats for trophic enrichment
The trophic level of bats calculated from the δ15N value of their wing tissue yielded information about the extent of δ13C enrichment in their wing membrane caused by trophic enrichment.
Unlike the trophic enrichment of δ15N, the trophic enrichment of δ13C differed from plants to insects and insects to insectivorous bats. Thus, the δ13C values of bats were corrected for trophic enrichment, considering the trophic position of the bat as well as differences in trophic enrichment using equation (3).

where δ13Cbat-enrichment is the 13C/12C ratio of the bat's wing membrane corrected for trophic enrichment of δ13C in relation to the international standard, δ13Cbat is the 13C/12C ratio of the bat's wing membrane in relation to the international standard, Δ13Cinsects-plants is the difference between the 13C/12C ratios of insects and plants (both collected in the understorey), i.e. the enrichment in the first trophic step that is reflected in all animals. Δ13Cins.bats-insects is the difference between the 13C/12C ratio of insectivorous bats (i.e. non-phyllostomids) and insects, and TLbat is the trophic level of a bat as calculated from equation (2). Δ13Cins.bats-insects is only taking into account the percentage of insect protein in the bats diet, i.e. the proportion in trophic level that is above 1. Because the calculated foraging height only yields information about the plant-based component of a bat's diet, we excluded carnivorous and sanguinivorous species from our analyses (i.e. Chrotopterus auritus, Desmodus rotundus, Trachops cirrhosus).
Calculating the foraging height of bats
After having corrected for trophic enrichment, δ13C values were fitted onto the δ13C gradient of plants from understorey to canopy. Average canopy height at TBS and LS was approximately 30 m and bat-dispersed fruits grow at all forest levels (K. Rex, pers. obs.). Likewise, bats were captured at all strata. Thus, δ13C values of bats should range across all forest levels. In order to fit the δ13C values of bats to the plant regression line, we calculated the median of δ13C for all bat species, which should reflect the δ13C enrichment for a bat foraging at middle level (i.e. 15 m height). We chose this starting point rather than ground or canopy level, because variance in δ13C of plants is highest in the understorey, and maximal canopy height varies between locations. From the designated starting point, we added or subtracted the δ13C difference per unit height calculated from the plant gradient slope to obtain foraging heights of bats. We then calculated the foraging height of bat species according to equation (3), separately for each site and season based on these respective enrichment values.
Because mist netting was not performed continuously throughout all forest levels, capture height of each bat was noted and bats were grouped accordingly into those captured in understorey nets (0–5 m), versus those captured in subcanopy (10–15 m) or canopy nets (>20 m). For each category we calculated the average foraging height of species to test if bats captured in the respective stratum also feed at that level. Owing to the limited accessibility to the canopy, mist-netting effort was four times higher on the ground than at canopy level. We corrected for this bias by multiplying captures at canopy level by four. Statistics were calculated using GraphPad InStat 3 (1992). Data are presented as mean ± 1 SD. All tests were two-tailed, with accepted significance levels of P < 0.05.
RESULTS
Plants and insects
We analysed samples collected from 600 individual plants from all forest strata. At TBS δ13C of fruits averaged −34.1‰ ± 2.2‰ (n = 26), which did not differ significantly from δ13C of leaf tissue of the same plant individual (mean δ13Cleaf = −34.3‰ ± 1.81‰; Wilcoxon test: n = 26, W = −103, P = 0.20). By contrast, δ13C of fruit and leaf tissue of the same plant differed significantly at LS (Wilcoxon test: n = 43, W = −856, P = 0.0001; δ13Cfruit = −32.1‰ ± 2.72‰, δ13Cleaf = −33.3‰ ± 2.44‰).
Since δ13Cplants was not significantly different between seasons at the same site (Mann–Whitney U-test: TBS: U = 13 000, P < 0.16; LS: U = 21 900, P = 0.57), we pooled data from different seasons to test for regional differences. We found a significant difference in δ13C of plants between sites (Mann–Whitney U-test: U = 61 300, P < 0.001).
The δ13C of plants showed a gradient from ground to canopy level with an increasing depletion in δ13C (i.e. lower δ13C values) towards the ground at both sites (Spearman rank correlation: rLS 2004 = 0.77, rLS 2005 = 0.79, rTBS 2004 = 0.70, rTBS 2005 = 0.71; P < 0.0001 for all; Figure 1). The increase in δ13C per unit height was 0.168‰ m−1 at LS in 2004, 0.188‰ m−1 at LS in 2005, 0.127‰ m−1 at TBS in 2004 and 0.115‰ m−1 at TBS in 2005. These values were used to calculate foraging heights of bats based on their δ13C value obtained from equation (3).
Relationship between δ13C (‰) and plant tissue height above ground (m). Microbial respiration leads to lower δ13C values in the understorey, whereas photosynthesis induces higher δ13C values towards the canopy. The line indicates the linear regression. Data for La Selva Biological Station (LS) in the rainy season (a) (δ13C = −34.5 + 0.17 height; r2 = 0.56) and dry season (b) (δ13C = −34.5 + 0.19 height; r2 = 0.61) and for Tiputini Biodiversity Station (TBS) in the rainy (c) (δ13C = −34.4 + 0.13 height; r2 = 0.37) and dry season (d) (δ13C = −34.6 + 0.12 height; r2 = 0.37).

Enrichment of δ 13C along the trophic cascade
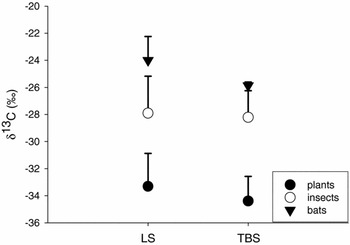
We analysed 350 insect samples and 31 samples of non-phyllostomid bats, known to feed exclusively on insects, from both sites and seasons to determine trophic enrichment in δ13C from plants to insects and insects to insectivorous bats. Because the δ13C of insect samples did not differ significantly between seasons (Mann–Whitney U-test: TBS: U = 4750, P > 0.05; LS: U = 1996, P = 0.53), we pooled data from both seasons for regional comparison of δ13Cinsects. The δ13C values of insect samples differed significantly between sites (Mann–Whitney U-test: U = 12 400, P = 0.04). δ13Cinsects averaged −28.2‰ ± 1.97‰ at TBS and −27.9‰ ± 2.74‰ at LS.
Insectivorous bat species of the families Verspertilionidae, Molossidae and Emballonuridae likewise differed in δ13C between sites (Mann–Whitney U-test: nLS = 10, nTBS = 5, U = 9, P = 0.02), but not between seasons (Mann–Whitney U-test: LS: n2004 = 5, n2005 = 6; U = 17, P = 0.63; sample size at TBS was too small for seasonal comparison). The δ13C value of non-phyllostomid species averaged –25.9‰ ± 0.3‰ (n = 5) at TBS and –24.0‰ ± 1.8‰ at LS (n = 10) (Figure 2).
Carbon isotope ratios (δ13C) of plants, insects (Orthoptera, Lepidoptera) and insectivorous (non-phyllostomid) bats for both study sites (rainy and dry seasons combined). Trophic enrichment and trophic level of phyllostomid bats were calculated based on these data. Non-phyllostomid bats: Lasiurus blossevillii (n = 1) Molossus bondae (n = 3), Molossus molossus (n = 6), Myotis albescens (n = 2), Myotis elegans (n = 1), Myotis nigricans (n = 3), Myotis riparius (n = 4), Peropteryx kappleri (n = 1), Saccopteryx bilineata (n = 5), Saccopteryx leptura (n = 2), Thyroptera tricolor (n = 2).

The average δ13C enrichment between plants and insects (Δ13Cinsects-plants) differed significantly from that between insects and insectivores (Δ13Cins.bats-insects) at both sites and seasons (ANOVA, deviation from linearity: FTBS 04 = 18.4, FTBS 05 = 5.88, FLS 04 = 7.77, FLS 05 = 4.80, all: P < 0.03). Enrichment in δ13C from plants to insects averaged 6.5‰ at TBS in 2004, 5.7‰ at TBS in 2005, 6.1‰ at LS in 2004 and 6.5‰ at LS in 2005. Enrichment in δ13C from insects to insectivorous bats averaged 2.5‰ at TBS in 2004, 2.4‰ at TBS in 2005, 3.7‰ at LS in 2004 and 4.5‰ at LS in 2005. δ13C values corrected for trophic enrichment were all within the range of δ13C values of plants.
Isotopic signature and foraging height of bats
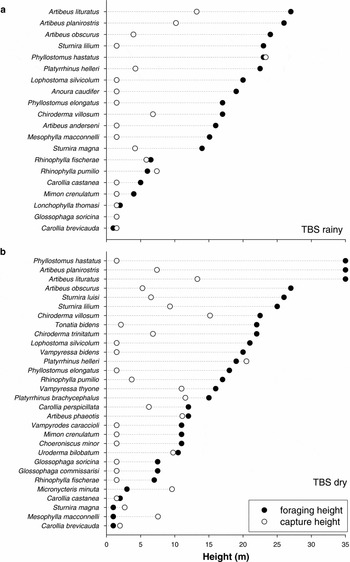
We analysed the δ13C of 1101 wing tissue samples of 54 phyllostomid species that predominantly consumed fruit (Appendix 1, Figures 3, 4). Within species, stable carbon isotope signatures differed among seasons (ANOVA: 13C species × season r2 = 0.60, F = 2.83, df = 40, P < 0.0001) and between sites (ANOVA: δ13C species × site r2 = 0.58, F = 2.26, df = 16, P < 0.003). As predicted, body mass was positively correlated with foraging height (Spearman rank correlation, r = 0.45, P = 0.006). Sixty-two per cent of the individuals were captured in ground nets and 38% in canopy nets. Foraging height, as calculated using δ13C isotope data, of species captured in ground nets averaged 12 ± 9 m, and was significantly lower than for species captured in canopy nets, which averaged 21 ± 8 m (Mann–Whitney U-test: U = 357, P < 0.001).
Vertical strata used by phyllostomid bat species at the La Selva Biological Station (LS) in the rainy season (a) and dry season (b) based on δ13C values of wing tissue (filled circles) and average capture height (open circles).

Vertical strata used by phyllostomid bat species at the Tiputini Biodiversity Station (TBS) in the rainy season (a) and dry season (b) based on δ13C values of wing tissue (filled circles) and average capture height (open circles).

DISCUSSION
Vertical stratification
Neotropical rain forests produce flowers and fruits at all vertical strata from ground level to the canopy (Schaefer et al. Reference SCHAEFER, SCHMIDT and WESENBERG2002, Shanahan & Compton Reference SHANAHAN and COMPTON2001). Most phyllostomid bat species include at least some plant resources in their diet and for many of them fruit or nectar is the predominant food source (Herrera et al. Reference HERRERA, FLEMING and STERNBERG1998, Reference HERRERA, HOBSON, MIRÓN-M., RAMÍREZ-P., MÉNDEZ-C. and SÁNCHEZ-CORDERO2001, Reference HERRERA, GUTIERREZ, HOBSON, ALTUBE, DÍAZ and SÁNCHEZ-CORDERO2002; Rex et al. Reference REX, CZACZKES, MICHENER, KUNZ and VOIGT2010, Voigt et al. Reference VOIGT, ZUBAID, KUNZ and KINGSTON2011). In this study we demonstrated that all forest strata are used by a number of bat species, where they exploit the available fruit and nectar resources. This pattern is markedly different from Palaeotropical rain forests, where large pteropodid bats assume the role of pollinators and seed dispersers. Large flying foxes forage predominantly in the canopy and subcanopy (Henry et al. Reference HENRY, BARRIÈRE, GAUTIER-HION and COLYN2004, Zubaid Reference ZUBAID1994), which has been attributed to their reliance on visual cues while foraging, which generally is not possible in the understorey (Hodgkison et al. Reference HODGKISON, BALDING, ZUBAID and KUNZ2003, Reference HODGKISON, BALDING, ZUBAID and KUNZ2004). Because phyllostomid bats in the Neotropics are capable of echolocation, they can navigate and forage in dense and often dark understorey as well as at canopy height. Their smaller body size and relatively short and broad wings (Norberg & Rayner Reference NORBERG and RAYNER1987) also enable them to navigate through dense vegetation, thus making them ideal pollinators and seed dispersers for understorey plants (e.g. Piper spp.), as well as for large canopy trees such as Ficus spp.
Smaller species (e.g. Carollia spp. or Artibeus phaeotis) tend to feed predominantly on understorey plants, whereas large species (e.g. Artibeus lituratus and Phyllostomus hastatus) prefer larger fruits that occur in the canopy (Bonaccorso et al. Reference BONACCORSO, WINKELMANN, SHIN, AGRAWAL, ASLAMI, BONNEY, HSU, JEKIELEK, KNOX, KOPACH, JENNINGS, LASKY, MENESALE, RICHARDS, RUTLAND, SESSA, ZHAUROV and KUNZ2007, Pereira et al. Reference PEREIRA, MARQUES and PALMEIRIM2010, Schaefer et al. Reference SCHAEFER, SCHMIDT and WESENBERG2002, Shanahan & Compton Reference SHANAHAN and COMPTON2001, Voigt Reference VOIGT2011). Thus, vertical stratification might occur in response to differences in fruit size among forest strata, because fruit size is correlated with the size of their dispersers (Kalko et al. Reference KALKO, HERRE and HANDLEY1996, Lambert Reference LAMBERT1989). We also found no evidence that vertical stratification is associated with habitat clutter, because clutter generally is lowest in middle strata, and large species tend to prefer the more cluttered canopy (Terborgh & Petren Reference TERBORGH, PETREN, Bell, McCoy and Mushinsky1991).
Consistent with our results, previous studies have classified Carollia spp. as understorey foragers (Bonaccorso et al. Reference BONACCORSO, WINKELMANN, SHIN, AGRAWAL, ASLAMI, BONNEY, HSU, JEKIELEK, KNOX, KOPACH, JENNINGS, LASKY, MENESALE, RICHARDS, RUTLAND, SESSA, ZHAUROV and KUNZ2007, Fleming Reference FLEMING1988), whereas Artibeus lituratus and Phyllostomus hastatus have been categorized as canopy-foragers. In our study we have shown that even Phyllostomus elongatus, which was mainly captured in the understorey, is a canopy-foraging species, as we would have expected from its large body size (Bernard Reference BERNARD2001, Kalko & Handley Reference KALKO and HANDLEY2001). However, our results also suggest that there is no clear distinction between canopy- and ground-foraging bat species in lowland tropical rain forests, but rather a distribution of species throughout all vertical forest strata. Previous studies have shown that phyllostomid species often include a large range of food items in their diet (Fleming Reference FLEMING, Estrada and Fleming1986, Humphrey et al. Reference HUMPHREY, BONACCORSO and ZINN1983, Rex et al. Reference REX, CZACZKES, MICHENER, KUNZ and VOIGT2010, York & Billings Reference YORK and BILLINGS2009), and thus interspecific competition is not limited to species within the same feeding ensemble (i.e. nectarivores, frugivores, insectivores, carnivores; Rex et al. Reference REX, CZACZKES, MICHENER, KUNZ and VOIGT2010). The vertical distribution of species likewise suggests a large overlap in foraging strata among phyllostomid bat species that is not restricted to distinct groups. This, of course, makes it even more challenging to understand the mechanisms underlying the extremely high species richness within phyllostomid assemblages.
Stable isotope analysis – a reliable source of dietary information
Stable carbon isotope analysis is a valuable tool, because it provides information on a bat's diet integrated over the 3–4 mo previous to the time of tissue collection (Voigt et al. Reference VOIGT, MATT, MICHENER and KUNZ2003), rather than giving a snapshot of a bat's flight activity at the time of capture. Analyses of stable carbon isotopes have been used to determine trophic levels of animals; however, in the present study we found that nitrogen isotope ratios are more suitable for this purpose, because they are not influenced as much by other factors (Herrera et al. Reference HERRERA, FLEMING and STERNBERG1998, Reference HERRERA, HOBSON, MIRÓN-M., RAMÍREZ-P., MÉNDEZ-C. and SÁNCHEZ-CORDERO2001; Post Reference POST2002). Concurring with Herrera et al. (Reference HERRERA, FLEMING and STERNBERG1998), our results show that enrichment of δ13C along the trophic cascade differs significantly between trophic levels (Figure 2), being almost twice as high from plants to insects (6.2‰) than from insects to insectivorous bats (3.3‰). By contrast enrichment of δ15N was the same among trophic levels (Rex et al. Reference REX, CZACZKES, MICHENER, KUNZ and VOIGT2010; but see McCutchan et al. Reference MCCUTCHAN, LEWIS, KENDALL and MCGRATH2003 for a review). Moreover, carbon isotope ratios are influenced not only by trophic level, but also by the metabolic pathway of plants, such as C3 versus C4 or CAM metabolism (Fleming Reference FLEMING1995, Fleming et al. Reference FLEMING, NUNEZ and STERNBERG1993, Nassar Reference NASSAR, BECK, STERNBERG and FLEMING2003, Rubenstein & Hobson Reference RUBENSTEIN and HOBSON2004), and by vertical stratification within forests (Buchmann et al. Reference BUCHMANN, BROOKS and EHLERINGER2002; this study). Thus, we used nitrogen isotope analyses (δ15N values) to determine the trophic level of each bat species (Rex et al. Reference REX, CZACZKES, MICHENER, KUNZ and VOIGT2010), which has also proven to be a reliable method in other studies (DeNiro & Epstein Reference DENIRO and EPSTEIN1978, Herrera et al. Reference HERRERA, FLEMING and STERNBERG1998, Reference HERRERA, HOBSON, MIRÓN-M., RAMÍREZ-P., MÉNDEZ-C. and SÁNCHEZ-CORDERO2001, Reference HERRERA, GUTIERREZ, HOBSON, ALTUBE, DÍAZ and SÁNCHEZ-CORDERO2002; Post Reference POST2002, Voigt & Kelm Reference VOIGT and KELM2006a, Reference VOIGT and KELM2006b; York & Billings Reference YORK and BILLINGS2009) and carbon isotope ratios (δ13C) to determine foraging height.
We found that the δ13C gradient in plants from ground to canopy level, as well as the trophic enrichment factor, needs to be assessed for each study site, study period and each species separately to achieve accurate and reliable results (McCutchan et al. Reference MCCUTCHAN, LEWIS, KENDALL and MCGRATH2003).
Combining the use of stable carbon isotope with classical assessment of vertical stratification by mist netting at different forest strata is a valuable method for gaining additional information on the spatial foraging behaviour of bats, as it reveals differences between commuting and foraging flights. When commuting between foraging sites, most species appear to use the understorey, given that we captured species from all foraging strata in understorey nets, whereas canopy nets mainly captured canopy-foraging species. Commuting in the understorey may be important for bats to avoid predators. Because birds of prey rely on visual cues when hunting and cannot hunt as easily in dense vegetation, bats should be safer commuting in the relatively dark and cluttered understorey.
A higher capture rate in mist nets in the understorey might also be due to a bias associated with proximity of nets to roost sites. Capture rates were highest when bats were emerging from their roosts at dusk or returning to them at dawn. Bats are more likely to be captured in the understorey on their way to or from roosting sites, because most bats roost either in tree cavities, beneath roots along river banks or inside or under modified leaves, all of which are mainly found in the understorey (Kunz & Lumsden Reference KUNZ, LUMSDEN, Kunz and Fenton2003).
Conclusion
Phyllostomid bat species collectively exploit resources from all forest strata. Foraging height calculated from stable carbon isotope values of wing tissue showed that each forest strata is used by certain species, so the bat assemblage is not partitioned into an understorey versus a canopy foraging group. Resource partitioning along the vertical forest axis appears to occur throughout the entire assemblage and is not restricted to taxonomic or ecological subgroups. Given that species foraging at higher strata are captured in ground as well as canopy nets, and those foraging at lower strata are captured exclusively in ground nets, we suggest that capture height misrepresents foraging height. Thus, we conclude that bats are most likely to use the lower strata to commute between foraging sites or roosts.
ACKNOWLEDGEMENTS
We wish to thank Barbara Buchner, Doris Fichte, Kim Jochum, Mirkka Jones, Christine Neumann, Detlev Kelm, Andrea Kunz, Britta Lammers, Fernando Noriega, Ben Rinehart, Erica Sampaio, Alfonso Arguero Santos, Holger Schütt, Carolin Werres and Javier Zamora for their help in the field and with species identification. We especially wish to thank Benjamin Czaczkes for support with calculations and statistical analyses as well as Heather York and an anonymous reviewer for comments on earlier versions of this manuscript. We also thank the staff at La Selva Biological Station and the Tiputini Biodiversity Station as well as the Costa Rican and Ecuadorian authorities for permitting our work. Funding for this project was provided by the Deutsche Forschungsgemeinschaft (Vo 890/7) and the Center for Ecology and Conservation Biology at Boston University. This study complied with the Boston University Animal Care and Use Committee and the current laws of Costa Rica and Ecuador.
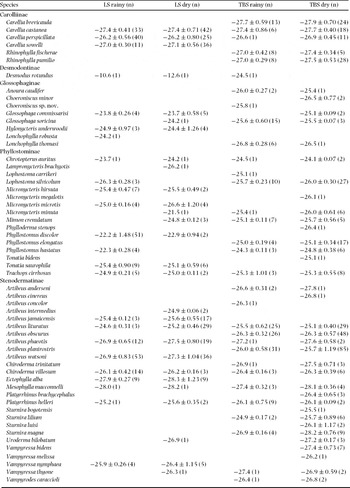
Stable carbon isotope ratios (δ13C, ‰) of 36 phyllostomid species in the dry (2005) and rainy season (2004) at the La Selva Biological Station (LS, Costa Rica) and the Tiputini Biodiversity Station (TBS, Ecuador). Species were identified according to Timm & LaVal (Reference TIMM and LAVAL1998) and Baker (Reference BAKER2002) for Costa Rican species and Albuja (Reference ALBUJA1999) and Tirira (Reference TIRIRA1999) for Ecuadorian species. Nomenclature is based on Simmons (Reference SIMMONS, Wilson and Reeder2005). Sample sizes (n) are given in parentheses.