Suicide is a leading cause of death in the USA (Stone et al., Reference Stone, Simon, Fowler, Kegler, Yuan, Holland and Crosby2018). To reduce the prevalence of suicide, researchers have studied risk factors for self-injurious thoughts and behaviors [SITB; i.e. non-suicidal self-injury (NSSI), suicide ideation (SI), suicide attempt (SA), and death by suicide; Franklin et al., Reference Franklin, Ribeiro, Fox, Bentley, Kleiman, Huang and Nock2017], such as posttraumatic stress disorder (PTSD). There is an established relationship between SITB and PTSD in both civilian and Veteran/military samples (e.g. Bentley et al., Reference Bentley, Franklin, Ribeiro, Kleiman, Fox and Nock2016; Panagioti, Gooding, Triantafyllou, & Tarrier, Reference Panagioti, Gooding, Triantafyllou and Tarrier2015). Unfortunately, by only examining PTSD diagnostic status or overall symptom severity, the differential associations between SITB and individual PTSD symptoms are obscured (Krysinska & Lester, Reference Krysinska and Lester2010). Identifying specific relevant posttraumatic stress symptoms could inform viable treatment targets to reduce SITB. Findings from prior studies do not offer consistent or compelling evidence on which specific symptoms are driving the co-occurrence of SITB and PTSD (e.g. Davis, Witte, & Weathers, Reference Davis, Witte and Weathers2014; Legarreta et al., Reference Legarreta, Graham, North, Bueler, McGlade and Yurgelun-Todd2015; Selaman, Chartrand, Bolton, & Sareen, Reference Selaman, Chartrand, Bolton and Sareen2014). Given the inconsistent findings at the symptom level, it is important to consider the limitations of these studies that may have obscured the full nature of the relationship between SITB and PTSD, such as potential problems with multicollinearity and suppression (Courville & Thompson, Reference Courville and Thompson2001; Elhai et al., Reference Elhai, Biehn, Armour, Klopper, Frueh and Palmieri2011; Witte, Domino, & Weathers, Reference Witte, Domino and Weathers2015). Thus, it is important to utilize less restrictive and more sophisticated data analytic approaches when examining the unique relationship of PTSD symptoms on other variables, such as SITB.
Network analysis is a statistical approach that may offer insight into the dynamics between symptoms of PTSD and SITB. It assumes that psychiatric disorders are a network of interrelated symptoms (represented as nodes) that have a direct effect on one another (i.e. partial correlations represented as edges; Borsboom & Cramer, Reference Borsboom and Cramer2013). Network analysis also assumes that there are causal relationships among symptoms (McNally, Reference McNally2016), which is consistent with literature suggesting PTSD symptoms are highly related and have a direct causal effect on one another (Mitchell et al., Reference Mitchell, Wolf, Bovin, Lee, Green, Rosen and Marx2017). In addition to the benefits of the theoretical framework of network analysis, the analytic methods provide information on which variables are most central, or influential, to a network (e.g. expected influence, or the sum of magnitudes of associations per node; Mitchell et al., Reference Mitchell, Wolf, Bovin, Lee, Green, Rosen and Marx2017; van Borkulo et al., Reference van Borkulo, Boschloo, Borsboom, Penninx, Waldorp and Schoevers2015).
The network approach to comorbidity is also unique. In network analysis, the direct relationship between symptoms of multiple disorders is the basis for comorbidity, wherein each disorder represents a complex set of interrelated symptoms (Borsboom, Cramer, Schmittmann, Epskamp, & Waldorp, Reference Borsboom, Cramer, Schmittmann, Epskamp and Waldorp2011; Cramer, Waldorp, van der Maas, & Borsboom, Reference Cramer, Waldorp, van der Maas and Borsboom2010). In a comorbidity network, the between-disorder symptom connections are called bridges or bridge symptoms (Afzali et al., Reference Afzali, Sunderland, Teesson, Carragher, Mills and Slade2017; Mitchell et al., Reference Mitchell, Wolf, Bovin, Lee, Green, Rosen and Marx2017). Bridge symptoms are considered essential to the co-occurrence of the comorbid disorders and have been hypothesized to have clinical implications from early-stage assessment to post-treatment monitoring (Afzali et al., Reference Afzali, Sunderland, Teesson, Carragher, Mills and Slade2017). For example, prior studies have suggested that bridge symptoms can be used to screen patients for higher risk of developing a comorbid disorder and may be good candidates for treatment prioritization. By ‘deactivating’ bridge symptoms, there may be a significant decrease in both within-disorder and between-disorder symptom relationships (Afzali et al., Reference Afzali, Sunderland, Teesson, Carragher, Mills and Slade2017). The re-emergence of bridge symptoms can be a warning sign of relapse in post-treatment monitoring (Afzali et al., Reference Afzali, Sunderland, Teesson, Carragher, Mills and Slade2017; McNally et al., Reference McNally, Robinaugh, Wu, Wang, Deserno and Borsboom2015). Lastly, the identified bridge symptoms offer hypotheses for future studies. Two relevant metrics when considering bridges in a network are one-step bridge expected influence (i.e. the sum of direct edge-weights from a given node to all nodes of the opposite disorder) and two-step bridge expected influence (i.e. the sum of all indirect and direct edge-weights from a given node to all nodes of the opposite disorder; Heeren, Jones, & McNally, Reference Heeren, Jones and McNally2018; Jones, Ma, & McNally, Reference Jones, Ma and McNally2019; Robinaugh, Millner, & McNally, Reference Robinaugh, Millner and McNally2016). For both types of bridge influence, higher values denote greater influence on the nodes of the other disorder (Jones et al., Reference Jones, Ma and McNally2019).
Network analysis in PTSD and SITB
Only two studies have examined co-occurring suicidal ideation (SI) and PTSD symptoms using network analysis, with no known studies examining other types of SITB. The first study found that, when including seven clinical covariates (e.g. anxiety, active SI in the last 2 weeks), there was a positive partial correlation between the PTSD-related risky behaviors and active SI (Armour et al., Reference Armour, Fried, Deserno, Tsai, Pietrzak and Southwick2017). A second study examined risk and protective factors of SI using a network framework (Simons et al., Reference Simons, Simons, Walters, Keith, O'Brien, Andal and Stoltenberg2019). This study conducted two different network analyses – one in which PTSD was treated as a unidimensional construct and one in which individual PTSD clusters were examined. In the first network, SI was positively associated with overall PTSD severity. In the second network, the authors used DSM-IV PTSD symptoms to approximate the four DSM-5 PTSD symptom clusters, finding that only the negative alterations in mood and cognition cluster were positively associated with SI in the partial correlation network. Importantly, because this study used DSM-IV PTSD symptoms, three potentially important symptoms that were newly added to the DSM-5 version of PTSD (i.e. distorted blame, persistent negative emotion states, risky behavior; Friedman, Reference Friedman2013) were not included in the analyses. The authors also did not examine individual PTSD symptoms, thus limiting the ability to understand the unique relationships between specific PTSD symptoms and SI. In addition, neither the Armour et al. (Reference Armour, Fried, Deserno, Tsai, Pietrzak and Southwick2017) or Simons et al. (Reference Simons, Simons, Walters, Keith, O'Brien, Andal and Stoltenberg2019) studies reported bridge symptoms between PTSD variables and comorbid variables, which limits interpretation about which symptoms were contributing to comorbidity. Moreover, neither study included other SITB variables, such as suicide intent, planning, attempts, or NSSI behaviors, and both studies included modestly sized samples (Ns = 221 and 276, respectively), potentially limiting replicability or generalizability of findings.
The current study
In this study, we used network analysis to better understand the relationship between SITB and DSM-5 PTSD symptoms. To address concerns of generalizability across populations, trauma types, and levels of clinical severity (Fried et al., Reference Fried, Eidhof, Palic, Costantini, Huisman-van Diujk, Bockting and Karstoft2018), we examined bridge symptoms in cross-sectional PTSD-SITB networks within two independent, large samples: a trauma-exposed community sample with a lifetime history of SI (Sample 1) and a sample of trauma-exposed, treatment-seeking US Veterans (Sample 2). We explored prospective associations between SITB and PTSD symptoms using two methods. First, we constructed a longitudinal network in Sample 2 to examine associations over a 2-year period. Second, we conducted logistic regressions to examine the predictive utility of individual nodes from the cross-sectional networks on three SITB outcomes [SAs (both samples), NSSI (Sample 1), SI (Sample 1)] as another means of testing short- and long-term predictive utility of PTSD symptoms on SITB. To our knowledge, ours is the first study to formally evaluate the comorbidity of SITB and PTSD in a network model by identifying symptoms with the highest bridge expected influence (cross-sectionally) and through temporal network analysis.
Methods
Sample 1
Participants and procedure
Participants were English-speaking US residents recruited through Amazon's Mechanical Turk (MTurk) who were screened for lifetime history of SI. Data were collected at six time points (T1–T6) over a 15-day period. For more details on the sample and study procedure, see Zuromski, Cero, & Witte (Reference Zuromski, Cero and Witte2017). Because we only collected PTSD symptom data at Time 1 (T1), we only used T1 data in the cross-sectional network analysis. For logistic regression analyses (described subsequently), we created three dichotomous variables for SI endorsement, engagement in NSSI, and SAs across the remaining five timepoints (15-day time period). The network only included individuals who met DSM-5 Criterion A for a traumatic event, which yielded a final sample of 349 individuals. Table 1 presents sample demographics. Tables 1 and 2 present descriptive statistics for SITB and trauma variables.
Sample demographics

*-- indicates not collected in sample.
Node name, node position, and symptom description for both samples
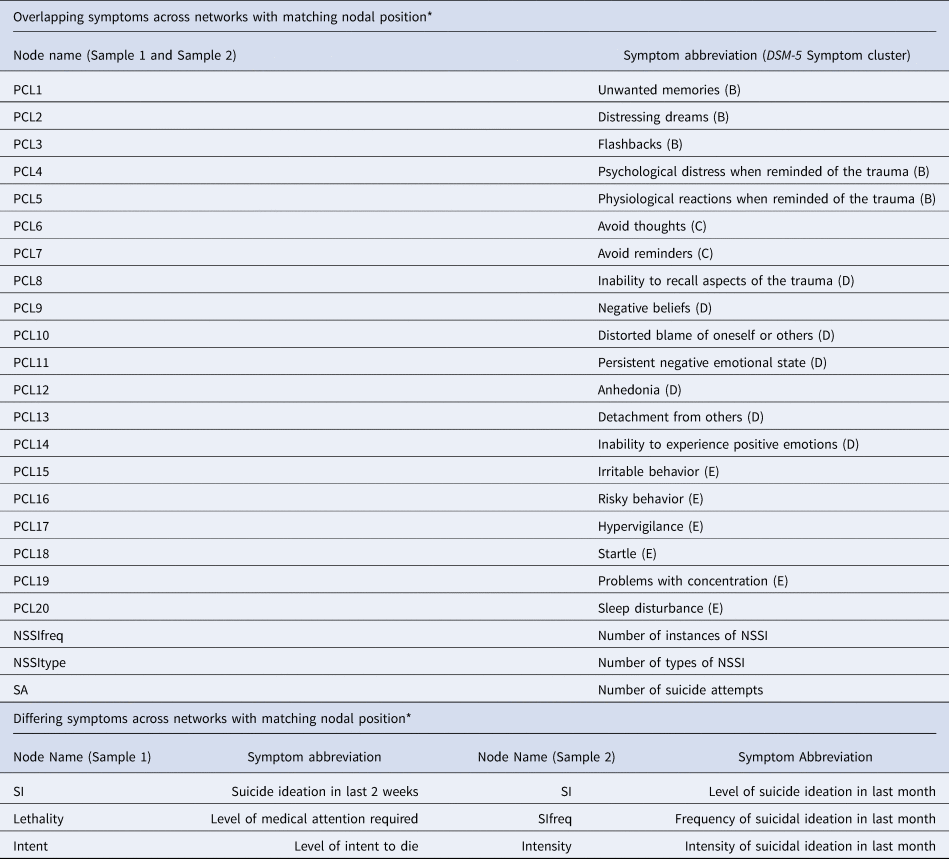
*Nodal position refers to the location of the node in the visual representation of the networks in Fig. 1.
Measures
Life events checklist for DSM–5 (LEC-5; Weathers et al. Reference Weathers, Blake, Schnurr, Kaloupek, Marx and Keane2013a)
The LEC-5 is a self-report questionnaire that was administered at T1 to assess trauma exposure. Two independent graduate clinicians rated narrative trauma descriptions to assess if participants met DSM-5 Criterion A for PTSD. There was 93.7% agreement (κ = 0.78, p < 0.001) between raters on initial ratings. Disagreements were resolved through discussion, and the consensus was ultimately achieved. The most common types of trauma in Sample 1 were transportation accident, sexual assault, and physical assault
PTSD checklist for DSM–5 (PCL-5; Weathers et al. Reference Weathers, Litz, Keane, Palmieri, Marx and Schnurr2013b)
The PCL-5 is a 20-item, self-report measure that assesses DSM–5 PTSD symptoms in the past month and requires participants to indicate the severity of distress associated with each symptom from 0 (not at all) to 4 (extremely). The PCL-5 has strong psychometric properties in samples of trauma-exposed undergraduates and Veterans (Blevins, Weathers, Davis, Witte, & Domino, Reference Blevins, Weathers, Davis, Witte and Domino2015; Bovin et al., Reference Bovin, Marx, Weathers, Gallagher, Rodriguez, Schnurr and Keane2016).
Depression symptom inventory – suicide subscale (DSI-SS; Joiner, Pfaff, & Acres, Reference Joiner, Pfaff and Acres2002)
The DSI-SS is a four-item, four-point scale self-report measure that assesses SI, plans, and impulses in the last 2 weeks. Previous studies have demonstrated the acceptable psychometric properties of this measure (Joiner et al., Reference Joiner, Pfaff and Acres2002).
Additional SITB items
Additional items assessed SA history, medical response required for the most lethal attempt, and intent to die during the most recent attempt. In addition, we included one item from the Inventory of Statements about Self-Injury [ISAS; Klonsky & Olino, Reference Klonsky and Olino2008; i.e. Please estimate the number of times in your life you have intentionally (i.e. on purpose) performed each type of non-suicidal self-harm (e.g. 0, 10, 100, 500): 12 types listed]. We used this item to create two unique items: one item collapsed the numbers of instances of NSSI behaviors across behavior types and the second item counted how many different types of NSSI behavior the individual had engaged in their lifetime.
Sample 2
Participants and procedures
Participants and procedure for Sample 2 are from the Project VALOR (Veterans' After-discharge Longitudinal Registry) dataset and have been previously described (see Rosen et al., Reference Rosen, Marx, Maserejian, Holowka, Gates, Sleeper and Keane2012; Wisco et al., Reference Wisco, Marx, Holowka, Vasterling, Han, Chen and Keane2014). Participants were combat theatre-deployed Operation Enduring Freedom (OEF)/ Operation Iraqi Freedom (OIF)/Operation New Dawn (OND) Veterans who have received mental health services in the Department of Veteran Affairs healthcare system. Investigators collected data on PTSD symptoms and demographic information were collected through telephone interviews with a doctoral-level clinician and a self-administered questionnaire completed online or by mail. Investigators collected data on SAs occurring between two-time points from both self-report and medical records; however, this item was dichotomized (i.e. attempt or no attempt) and, therefore, was not included in the temporal network, which only allowed for ordinal or continuous variables. Instead, it was used as the primary outcome for logistic regression. Follow-up data were collected every year for 5 years. For the purposes of this study, we utilized data from Time 2 (T2) for the cross-sectional network (the first time point with PCL-5 data) and utilized data from T2 and Time 4 (T4; i.e. when SA data were collected; 2-year time difference) for the temporal network. The network only included Veterans who met Criterion A for a traumatic event per DSM-5, which yielded a final sample of 1307 Veterans. Table 1 presents the sample demographics. Online Supplementary Tables 1 and 2 present descriptive statistics for SITB and trauma variables.
Measures
Lec-5 (Weathers et al., Reference Weathers, Blake, Schnurr, Kaloupek, Marx and Keane2013a)
The LEC-5 was used to identify the types of traumatic exposure endorsed by participants, without narrative accounts (see online Supplementary Table 2). In Sample 2, over 90% of the sample reported combat exposure, with the next most common traumas being transportation accident and physical assault.
PCL-5 (Weathers et al., Reference Weathers, Litz, Keane, Palmieri, Marx and Schnurr2013b)
The PCL-5 was completed as part of the self-administered questionnaire packet.
SCID-5 – PTSD module (First, Williams, Karg, & Spitzer, Reference First, Williams, Karg and Spitzer2015)
Doctoral-level clinicians assessed current (past month) PTSD diagnostic status by administering the SCID-5 over the phone. In this study, we used the SCID-5 to determine Criterion A status.
Self-Injurious thoughts and behaviors interview (SITBI; Nock, Holmberg, Photos, & Michel, Reference Nock, Holmberg, Photos and Michel2007)
The SITBI is a structured interview that assesses the presence, frequency, and severity of a wide range of SITB, including SI, suicidal plans, suicidal gestures, NSSI, and SAs. The SITBI has strong psychometric properties (Nock et al., Reference Nock, Holmberg, Photos and Michel2007). For the current study, we used items from the SITBI to create a variable that collapsed the numbers of instances of NSSI behaviors across behavior types, a variable that counted how many different types of NSSI behavior the individual had engaged in his/her lifetime, and a variable that assessed the number of SAs.
The Mini-international neuropsychiatric interview suicide subscale (MINI; Sheehan et al., Reference Sheehan, Lecrubier, Sheehan, Amorim, Janavs, Weiller and Dunbar1998)
The MINI Suicidal Scale was administered over the phone by doctoral-level clinicians to assess suicide risk in the last month (Sheehan et al., Reference Sheehan, Lecrubier, Sheehan, Amorim, Janavs, Weiller and Dunbar1998). Because dichotomous items cannot be combined with ordinal items in partial correlation networks, we collapsed three dichotomous items related to suicide ideation to create a single ordinal item for the level of suicide ideation. Specifically, we created the level of SI item by taking the highest level of ideation endorsed in the last 2 weeks: 0 = negative response to all three items; 1 = passive ideation (Think you would be better off dead or wish you were dead?); 2 = active ideation (Think about suicide?); and 3 = suicide plan (Have a suicide plan?). In addition, we used two items that assessed frequency (0 = N/A, no ideation; 1 = Occasionally, 2 = Often, 3 = Very Often) and intensity (0 = N/A, no ideation; 1 = Mild, 2 = Moderate, 3 = Severe) of SI in the past month.
Statistical procedure
Missing data and non-normality
The maximum missing data for any one variable included in the network was 1.1% for Sample 1 and 1.7% for Sample 2. Missing data were handled using the built-in pairwise deletion feature in the qgraph package in R (Epskamp, Cramer, Waldorp, Schmittmann, & Borsboom, Reference Epskamp, Cramer, Waldorp, Schmittmann and Borsboom2012). In addition, since there were skewed data for SITB variables, we applied the nonparanormal transformation (Liu, Han, Yuan, Lafferty, & Wasserman, Reference Liu, Han, Yuan, Lafferty and Wasserman2012) before estimating the graphical models using the huge package in R (Zhao et al., Reference Zhao, Li, Liu, Roeder, Lafferty and Wasserman2015), as recommended by Epskamp, Borsboom, and Fried (Reference Epskamp, Borsboom and Fried2018).
Cross-sectional networks
We constructed cross-sectional networks for each sample separately to examine associations between PTSD-SITB. Both networks included the 20 PTSD symptoms measured by the PCL-5 and six SITB items. Table 2 includes details about symptoms included in each network.
All network analyses were conducted using RStudio (1.1.453; RStudio Team, 2015). We used the R package qgraph (Epskamp et al., Reference Epskamp, Cramer, Waldorp, Schmittmann and Borsboom2012) to estimate and visualize networks. The least absolute shrinkage selection operator (LASSO) in qgraph, which uses the Extended Bayesian Information Criteria (EBIC), optimized fit such that spurious associations were eliminated in favor of a more parsimonious network (Mitchell et al., Reference Mitchell, Wolf, Bovin, Lee, Green, Rosen and Marx2017). The graphical LASSO networks are weighted, such that the thickness of the edges signifies the magnitude of the association between nodes. Dashed lines indicate negative partial correlations and solid lines indicate positive partial correlations (Epskamp et al., Reference Epskamp, Cramer, Waldorp, Schmittmann and Borsboom2012). For the visual representation of the models, we used the averageLayout from the qgraph package to allow for easier visual comparison between two networks, as it constrains the layout to be equal for both networks meaning that nodes are placed in the same location across networks (Epskamp & Fried, Reference Epskamp and Fried2016).
One-step (direct) and two-step (indirect) expected bridge influence was calculated using the bridge function of the networktools R package (Jones, Reference Jones2018). In supplemental materials, we also report the stability of edge-weights and central metrics, consistent with recommendations and methods put forth by Epskamp et al. (Reference Epskamp, Borsboom and Fried2018). To address concerns that low endorsement of particular symptoms (i.e. restricted variability) would affect metrics of centrality, we examined correlations between skewness and centrality (McNally, Heeren, & Robinaugh, Reference McNally, Heeren and Robinaugh2017).
Prospective associations
Temporal network
To explore prospective associations between PTSD symptoms and SITB in Sample 2, we computed a cross-lagged panel network, an approach recently developed by Reference Rhemtulla, van Bork and CramerRhemtulla, van Bork, and Cramer (in press) and utilized by Bernstein et al. (Reference Bernstein, Kleiman, van Bork, Moriarity, Mac Giollabhui, McNally and Alloy2019). As PTSD symptoms were only assessed at T1 in Sample 1, we were unable to use this method in that sample. In Sample 2, this approach examines the effects of individual items at T2 on all other items at T4, controlling for auto-regressive effects (i.e. regressing each variable at T4 on itself at T2). Both within-timepoint (undirected) and between-timepoint (directed) associations are considered.
Following the examples of Reference Rhemtulla, van Bork and CramerRhemtulla et al. (in press) and Bernstein et al. (Reference Bernstein, Kleiman, van Bork, Moriarity, Mac Giollabhui, McNally and Alloy2019), we first computed within- and between-timepoint unstandardized coefficients and autoregressive coefficients with regularized regressions using maximum likelihood with a LASSO penalty to estimate a sparse network structure and reduce the number of false positives. The glmnet package (Friedman, Hastie, & Tibshirani, Reference Friedman, Hastie and Tibshirani2010) was used to calculate regressions and the qgraph package (Epskamp et al., Reference Epskamp, Cramer, Waldorp, Schmittmann and Borsboom2012) was used to plot all graphs. We then calculated the overall influence of each node – specifically, in-prediction and out-prediction statistics. In-prediction refers to the proportion of variance for a given node at a later timepoint (i.e. T4) that is accounted for by variables at an earlier time point (i.e. T2). Out-prediction refers to the effect a given node at an earlier time point (i.e. T2) has on variables at a later timepoint (i.e. T4). For in-prediction and out-prediction, three statistics are calculated: overall, which includes all variables, cross-lagged, which excludes the autoregressive path of the node of interest, and cross-construct, which excludes paths connecting nodes within the same disorder (i.e. PTSD or SITB).
Logistic regression
To examine whether identified PTSD symptoms with high bridge expected influence were the most robust predictors of future SITB, we conducted univariable logistic regression with methods like those used by Haag, Robinaugh, Ehlers, and Kleim (Reference Haag, Robinaugh, Ehlers and Kleim2017). Specifically, for Sample 1, we assessed individual symptoms at T1 as predictors of future NSSI, SI, and SAs in the subsequent 15 days. Across the 15-day period, 128 participants reported SI, 35 participants engaged in NSSI at least once and nine participants reported attempting suicide. Similarly, for Sample 2, we used univariable logistic regression to assess individual symptoms at T2 as predictors of future SAs (n = 29) between T2 and T4 (2-year time period).
Results
Network estimation
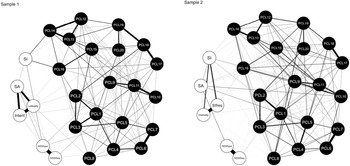
The regularized partial correlation network for Sample 1 and Sample 2 are depicted in Fig. 1. In both samples, there were no isolated nodes in the network; all symptoms were connected to at least one other symptom in the network. For more details on the network estimation, edge-weights, stability, and centrality metrics, see Supplemental Materials.
Regularized partial correlation network for Sample 1 (N = 349) and Sample 2 (N = 1307). Thicker lines are indicative of stronger associations. Solid lines represent positive associations and dashed lines represent negative associations. AverageLayout used to set nodes in the same spatial position across networks. See Table 2 for a list of symptom names and description.

Network inference
Bridge symptoms
Sample 1. In Sample 1, SI, risky behaviors (PCL16), negative beliefs (PCL9), inability to experience positive emotions (PCL14), and the number of different types of NSSI (NSSItype) had the greatest one-step and two-step bridge expected influence between the PTSD symptoms and the SITB symptoms (see Fig. 2).
One-step and two-step bridge expected influence. *indicates symptoms that vary between samples. See Table 2 for a list of symptom names and description.

Sample 2. In Sample 2, the number of SAs, level of SI, distorted blame of oneself or others (PCL10), unwanted memories (PCL1), and negative beliefs (PCL9) had the greatest one-step and two-step expected influence between the PTSD symptoms and the SITB symptoms. Two of these symptoms (i.e. SI and negative beliefs) overlapped with the greatest one-step and two-step bridge expected influence from Sample 1. Of note, the symptom with the next highest one-step and two-step bridge expected influence in Sample 2 was risky behaviors (PCL16), which also overlaps with Sample 1.
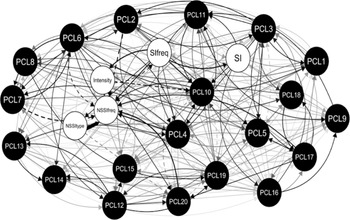
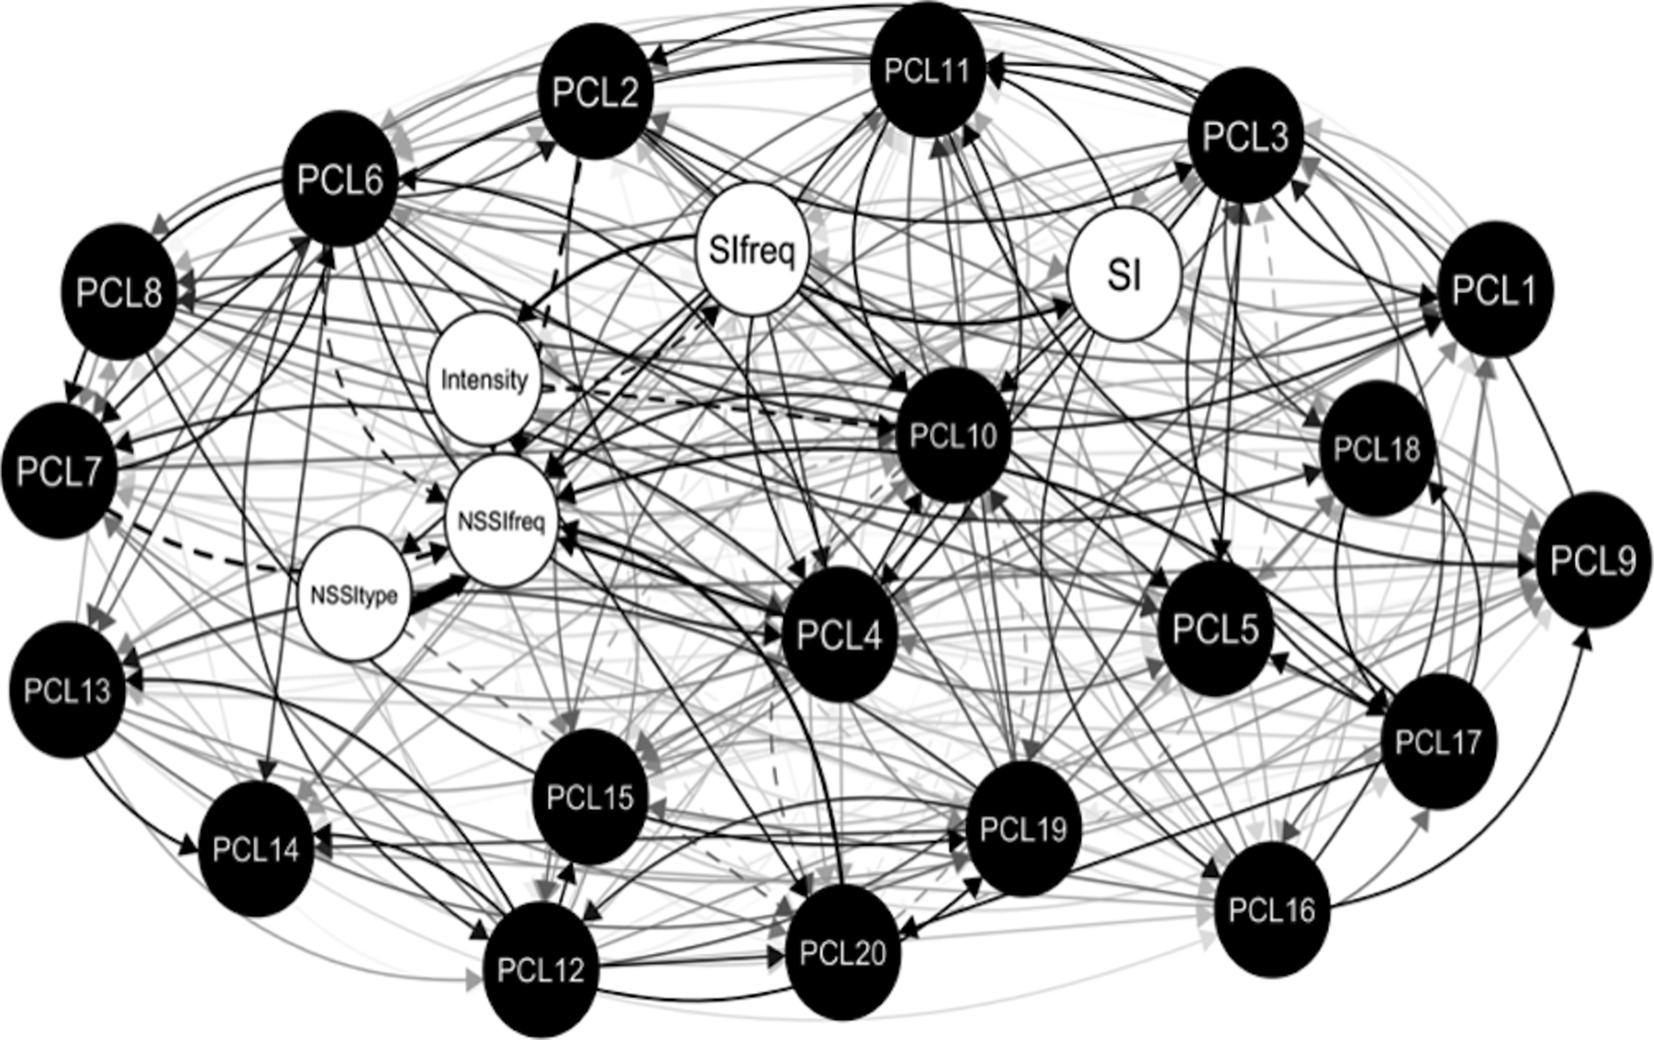
Temporal network in Sample 2
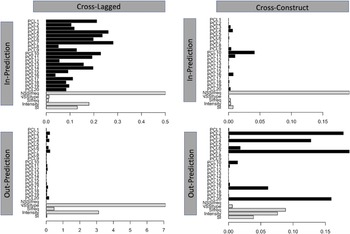
Figure 3 shows the cross-lagged panel network. Edges represent cross-lagged effects and denote the direction of prediction with arrows. Figure 4 shows cross-lagged and cross-construct estimates of in-prediction and out-prediction. Cross-construct estimates suggest that number of instances of NSSI is heavily influenced by PTSD symptoms (i.e. high in-prediction values). Regarding specific symptom drivers of SITB, avoidance of external reminders (PCL7), distressing dreams (PCL2), sleep disturbance (PCL20), and psychological distress (PCL4) were most influential. Moreover, the frequency of SI (SIfreq), the intensity of SI (Intensity), and level of SI in the last month (SI) most influences PTSD nodes. Notably, the number of instances of NSSI was the SITB node that was most heavily influenced by PTSD symptoms.
Regularized cross-lagged partial correlation network for Sample 2 (N = 1307) from Time 2 to Time 4 (2-year period). Thicker lines are indicative of stronger associations. Solid lines represent positive associations and dashed lines represent negative associations. See Table 2 for a list of symptom names and description.
Cross-lagged panel network estimates of centrality. Cross-lagged (Column 1): In-prediction estimates for a given node at T4 by all other nodes at T2 (i.e. excludes auto-regressive path of a given node) and out-prediction estimates for a given node at T2 to all other nodes at T4. Cross-construct (Column 2): In-prediction estimates for a given node at T4 by all nodes in the other construct at T2 (i.e. excludes any path connecting nodes from the same construct) and out-prediction estimates for a given node at T2 to all nodes in the other construct at T4. Larger values indicate greater centrality. See Table 2 for a list of symptom names and description.

Logistic regression
Table 3 displays the logistic regressions for SITB. For Sample 1, instances of NSSI, SI, and SAs reported between T1 and T6 (15-day period) were the outcomes of interest. Every PTSD symptom significantly predicted SI. Fourteen PTSD symptoms, including the three PTSD symptoms identified as the strongest bridge symptoms, significantly predicted future NSSI. Finally, eight PTSD symptoms, including two of the strongest bridge symptoms, significantly predicted a future SA. Compared with all PTSD and SITB variables, risky behaviors (PCL16) had the highest odds ratio for all three SITB outcomes. The second-highest odds ratios differed across the three outcomes: for SI it was previous SI; for NSSI it was a persistent negative emotional state (PCL11); and for SAs it was intent to die. For Sample 2, SAs that occurred between T2 and T4 (2-year period) served as the outcome. Consistent with Sample 1, the five strongest identified bridge symptoms significantly predicted a future SA. Unwanted memories (PCL1) and psychological distress when reminded of the trauma (PCL4) had the highest odds ratios. We highlighted the two strongest predictors from each logistic regression; however, there are many overlapping confidence intervals across predictor variables. Thus, caution is warranted when making interpretations about the relative magnitude of odds ratios.
Logistic regressions by sample

Note. Bolded = highest odd ratios.
Discussion
To our knowledge, this study represents the first network analysis of PTSD and SITB comorbidity in both a community sample and a Veteran sample who experienced a Criterion A traumatic event. Our findings suggest that both PTSD and SITB symptoms influence one another. However, in the interest of informing treatment targets, we focus primarily on PTSD symptoms that drive SITB, given the availability and effectiveness of clinical interventions for PTSD.
Despite differences in demographics and trauma exposure between our samples, we found several consistent results in the cross-sectional networks, which is especially notable given recent discussion of the lack of consistency across PTSD networks estimated across studies and data sets (e.g. Fried et al., Reference Fried, Eidhof, Palic, Costantini, Huisman-van Diujk, Bockting and Karstoft2018). Specifically, in both samples, PTSD-related negative beliefs were highly influential on SITB. Other highly influential bridge symptoms were risky behaviors (Sample 1, to a lesser extent in Sample 2), inability to experience positive emotions (Sample 1), distorted blame (Sample 2), and unwanted memories (Sample 2). The replication of the main findings suggests that these results are stable across different trauma types and different groups within US adults. These findings are true for both one-step and two-step bridge influence, suggesting that even after including secondary influences or indirect effects from surrounding nodes, these symptoms remained the strongest bridges in the networks. In addition, both samples included individuals with increased risk for suicide who had experienced at least one DSM-5 Criterion A traumatic event. These inclusion criteria are noteworthy given that individuals with active SI are often excluded from studies of PTSD (Gradus, Suvak, Wisco, Marx, & Resick, Reference Gradus, Suvak, Wisco, Marx and Resick2013).
PTSD-related negative beliefs had high bridge expected influence across both samples. In addition, it significantly increased the odds of future SI and future NSSI in Sample 1 and future SAs in Sample 2; however, negative beliefs did not have high cross-construct loadings in the longitudinal network. Our study's finding adds to the literature by demonstrating that PTSD-related negative beliefs not only relate to overall PTSD severity (e.g. Agar, Kennedy, & King, Reference Agar, Kennedy and King2006; Foa, Ehlers, Clark, Tolin, & Orsillo, Reference Foa, Ehlers, Clark, Tolin and Orsillo1999; Park, Mills, & Edmondson, Reference Park, Mills and Edmondson2012) and SAs (Legarreta et al., Reference Legarreta, Graham, North, Bueler, McGlade and Yurgelun-Todd2015), but also acts as a direct connection to numerous SITB symptoms in both cross-sectional and longitudinal analyses. Thus, targeting negative beliefs through treatments such as cognitive processing therapy (CPT; Resick & Schnicke, Reference Resick and Schnicke1993) and prolonged exposure (PE; Foa, Hembree, & Rothbaum, Reference Foa, Hembree and Rothbaum2007) may prevent the co-occurrence of SITB symptoms from developing or may decrease these symptoms. Indeed, there is some evidence to suggest that CPT and PE may lead to a reduction in SI (e.g. Gradus et al., Reference Gradus, Suvak, Wisco, Marx and Resick2013).
Consistent with Armour et al. (Reference Armour, Fried, Deserno, Tsai, Pietrzak and Southwick2017), there was a positive edge (i.e. partial correlation) between SI and risky behaviors in both samples. However, by demonstrating that risky behaviors act as a bridge between PTSD symptoms and a larger range of SITB than just SI, our study demonstrates that PTSD-related risky behaviors may be important to the development of the co-occurrence of these symptoms. Not only was risky behaviors the PTSD symptom with the highest bridge expected to influence in Sample 1, but it also had the highest odds ratio for future SI, instances of NSSI, and SAs in Sample 1. Thus, PTSD-related risky behaviors may be an important treatment target for preventing or reducing SITB. Treatments that target emotion regulation and impulse control (e.g. skill training in affective and interpersonal regulation; Levitt & Cloitre, Reference Levitt and Cloitre2005) may be beneficial in reducing SITB over time.
In Sample 2, PTSD-related unwanted memories had the greatest bridge expected influence and had the highest odds ratio for future SAs. Thus, it appears to be an important clinical consideration for screening for SITB risk and might be considered a primary treatment target (e.g. via PE) in those who are experiencing SITB. Of the three PTSD symptoms with the greatest bridge expected influence on SITB in Sample 2, only distorted blame had strong cross-construct connections over time and predicted future instances of NSSI, pointing to it as a potentially important maintenance factor in the PTSD–SITB relationship. Thus, similar to unwanted memories and risky behaviors, distorted blame may be a prospective indicator of SITB, and thus has implications for the screening of SITB risk and might be an important treatment target for preventing SITB (e.g. via CPT).
Limitations
Study findings should be interpreted in light of limitations. First, the SITB items used in Samples 1 and 2 varied somewhat with respect to content and timeframe (see Table 2). Thus, the networks are not directly comparable. However, the variation in measures of SITB and timeframes may increase the generalizability of our findings, such that we can speak to both proximal and distal SITB.
Furthermore, the unique findings in each sample for bridge symptoms may in part be due to sample differences. Though both samples were trauma-exposed, Sample 1 was a community sample screened for lifetime SI, and Sample 2 consisted of treatment-seeking, combat deployed Veterans. The difference in samples may also be attributable to a difference in traumatic exposure type. Regarding demographic variables, Sample 1 had a higher percentage of female participants. Although we consider the variability we observed in trauma exposure and demographics between samples to enhance generalizability of our findings, these differences likely explain some of the differences in the networks between samples and should be explored further in future studies.
Moreover, Sample 1 included MTurk workers with a lifetime history of SI. While MTurk allows researchers to efficiently study psychopathology in a non-clinical sample, it has its limitations. For instance, the MTurk worker pool may differ from the general population (Arditte, Çek, Shaw, & Timpano, Reference Arditte, Çek, Shaw and Timpano2016). Future studies should seek to replicate our findings with additional non-Veteran samples, outside of MTurk. In addition, as this sample only included individuals with a lifetime history of SI, it is possible that individuals who engaged in other types of SITB (e.g. NSSI) without ever experiencing SI were excluded. Future studies should explore these findings in a sample with wider inclusion criteria.
In addition, in the logistic regression, there are overlapping confidence intervals across predictor variables. This finding highlights the uncertainty in these estimates. Thus, caution is warranted in interpreting any meaningful differences between predictor variables with overlapping confidence intervals.
Lastly, in this paper, the authors presume that network theory is correct (e.g. that reduction in bridge symptoms would lead to deactivation of co-occurrence of PTSD and SITB). However, testing of the tenants of network theory itself was beyond the scope of this paper. Related, the network approach and self-report measures used in this study, like other forms of statistical analysis, makes it difficult to parse out shared method variance from meaningful variance. Thus, we are limited in our ability to identify to what degree the associations (e.g. bridges) observed in this study are due to shared method variance or meaningful variance.
Conclusion
In this study, we used the novel methodology of network analysis to evaluate which PTSD symptoms may drive SITB, improving upon limitations of past studies that failed to examine bridge symptoms between DSM-5 PTSD symptoms and a wide range of SITB. By examining the symptom-level associations between SITB and PTSD within a network framework, we identified several symptoms that may have important roles in the development and maintenance of SITB. Primarily, it appears that risky behaviors and negative beliefs may be most consistently related to the development of SITB. Further, although not replicated in Sample 1, results from Sample 2 suggest that for individuals with a history of combat trauma, distorted blame of oneself or others and unwanted memories may also be strongly related to the development and maintenance of SITB. These findings offer new insights that may help to develop testable hypotheses for understanding the development, maintenance, and treatment of co-occurring SITB and PTSD.
Supplementary material
The supplementary material for this article can be found at https://doi.org/10.1017/S0033291720002263.
Conflict of interest
None.