1. Introduction
Shock waves in plasmas are typically analysed using the tools of magnetohydrodynamics (MHD). Hence, the jump conditions derived rely on two assumptions: (1) that collisions are frequent enough to establish an isotropic pressure, both upstream and downstream, and (2) that all the matter upstream passes to the downstream, together with the momentum and the energy it carries (Gurnett & Bhattacharjee (Reference Gurnett and Bhattacharjee2005), § 5.4.4; Goedbloed, Keppens & Poedts (Reference Goedbloed, Keppens and Poedts2010) chapters 2 and 3; or Thorne & Blandford (Reference Thorne and Blandford2017), § 13.2).
It turns out that in collisionless plasmas, where the mean free path is much larger than the size of the system, shock front included, these two assumptions may not be fulfilled. Regarding the second one, it has been known for long that collisionless shocks can accelerate particles which escape the ‘Rankine–Hugoniot budget’ and modify the jump conditions (Berezhko & Ellison Reference Berezhko and Ellison1999). As for the first assumption, namely that pressures are isotropic, it is still valid in collisionless unmagnetized plasmas since, in such plasmas, the Weibel instability ensures isotropic pressures are unstable (Weibel Reference Weibel1959; Silva, Afeyan & Silva Reference Silva, Afeyan and Silva2021).
Yet, still in a collisionless plasma, an external magnetic field can stabilize an anisotropy, invalidating the second assumption (Hasegawa Reference Hasegawa1975; Gary Reference Gary1993). This has been clearly proved by in situ measurement in the solar wind (Bale et al. Reference Bale, Kasper, Howes, Quataert, Salem and Sundkvist2009; Maruca, Kasper & Bale Reference Maruca, Kasper and Bale2011; Schlickeiser et al. Reference Schlickeiser, Michno, Ibscher, Lazar and Skoda2011). The present work is about departures from MHD predictions stemming from the violation of the second assumption. Departures stemming from the violation of the first one, namely accelerated particles escaping the Rankine–Hugoniot budget, will not be addressed here (see Bret (Reference Bret2020) for a review).
Assuming an isotropic upstream, how could any anisotropy develop downstream? Simply through an anisotropy that would be triggered at the front crossing, and then maintained stable in the downstream by means of an external magnetic field. Such is the scenario we have been contemplating in a series of recent articles on parallel, perpendicular and switch-on shocks (Bret & Narayan Reference Bret and Narayan2018, Reference Bret and Narayan2019, Reference Bret and Narayan2020, Reference Bret and Narayan2022).
In our model, the plasma is compressed anisotropically when it crosses the front. Then, depending on the resulting anisotropy degree, the field can sustain the anisotropy in the downstream, or not. Note that for the parallel case, our model has been successfully tested against particle-in-cell (PIC) simulations in Haggerty, Bret & Caprioli (Reference Haggerty, Bret and Caprioli2022).
The present work aims at bridging between all the previously treated cases. We therefore consider the general case of an oblique shock, where the upstream magnetic field makes an arbitrary angle with the shock normal.
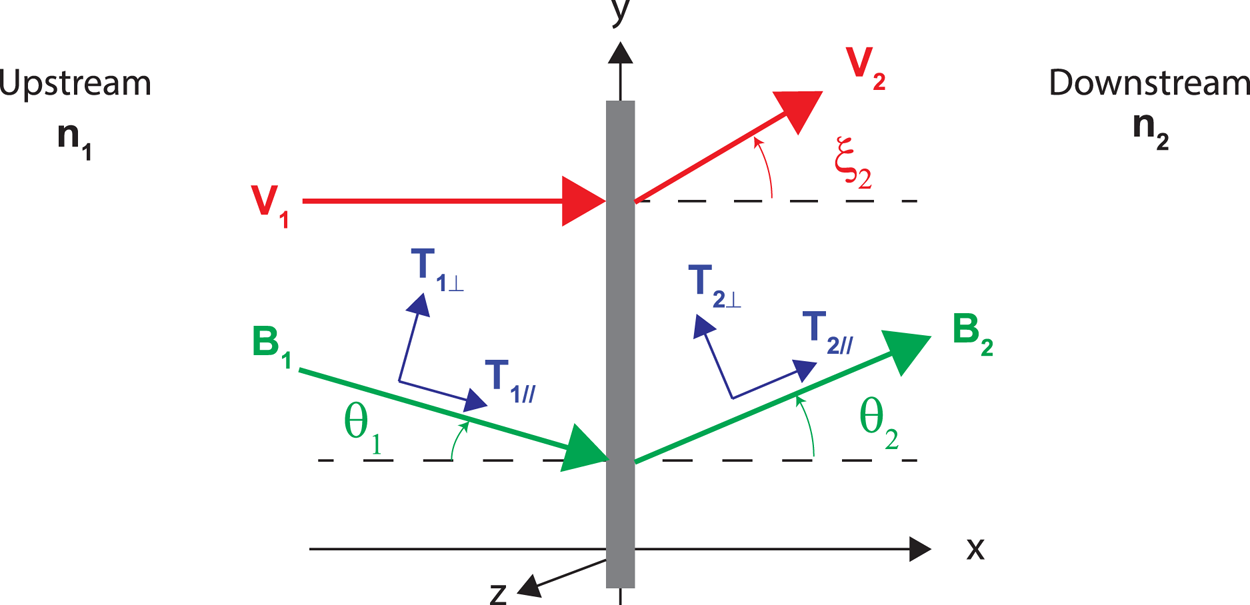
The system considered is pictured in figure 1. Subscripts ‘1’ and ‘2’ refer to the upstream and the downstream respectively. We work in the reference frame where the upstream velocity $\boldsymbol {v}_1$ is normal to the front. The upstream magnetic field $\boldsymbol {B}_1$
 makes an arbitrary angle $\theta _1 \neq 0$
 with the shock normal, contrary to Bret & Narayan (Reference Bret and Narayan2018, Reference Bret and Narayan2022) where $\theta _1=0$
 , and to Bret & Narayan (Reference Bret and Narayan2019) where $\theta _1={\rm \pi} /2$
 . The fields $\boldsymbol {B}_{1,2}$
 and the velocities $\boldsymbol {v}_{1,2}$
 are assumed coplanar.
System considered. The upstream magnetic field $\boldsymbol {B}_1$ makes an angle $\theta _1$
 with the shock normal. The downstream field $\boldsymbol {B}_2$
 and velocity $\boldsymbol {v}_2$
 make angles $\theta _2$
 and $\xi _2$
 respectively with the shock normal. We work in the reference frame where the shock is stationary and the upstream velocity $\boldsymbol {v}_1$
 is normal to the front ($\xi _1=0$
 ). The upstream has density $n_1$
 and temperatures $T_{1\parallel }$
 and $T_{1\perp }$
 parallel and perpendicular to the upstream field $\boldsymbol {B}_1$
 . The downstream has density $n_2$
 and temperatures $T_{2\parallel }$
 and $T_{2\perp }$
 parallel and perpendicular to the downstream field $\boldsymbol {B}_2$
 . The parallel and perpendicular directions are therefore defined with respect to the local magnetic field. Even though the equations presented in § 3 can be applied to an anisotropic upstream, the model is only solved for $T_{1\parallel }= T_{1\perp }=0$
 .

Even though the formalism presented is valid for anisotropic downstream and upstream temperatures, we restrict ourselves to $T_{1\parallel }= T_{1\perp }=0$ when solving it.
Also, we consider a plasma of electron–positron pairs. The identity of the mass of both species allows us to deal with only one parallel and one perpendicular temperature in the downstream, as it has been found that in collisionless shocks, species of different mass are heated differently (Feldman et al. Reference Feldman, Bame, Gary, Gosling, McComas, Thomsen, Paschmann, Sckopke, Hoppe and Russell1982; Guo, Sironi & Narayan Reference Guo, Sironi and Narayan2017, Reference Guo, Sironi and Narayan2018).
As the reader will realize, even for a coplanar geometry with $T_{1\parallel }= T_{1\perp }=0$ , the forthcoming algebra is quite involved. For this reason, the present work is mainly devoted to the algebraic resolution of our model for the oblique case. We write down the conservation equations and explain how to solve them symbolically. We also explain how these solutions fit with each other within the rules of our model. Yet, as known even for MHD, listing the solutions of the equations does not provide the full picture of the shock physics, as some solutions which do satisfy the MHD conservation equations could eventually be non-physical (Kennel, Blandford & Wu Reference Kennel, Blandford and Wu1990; Falle & Komissarov Reference Falle and Komissarov1997; Wu Reference Wu2003; Kulsrud Reference Kulsrud2005; Goedbloed Reference Goedbloed2008; Delmont & Keppens Reference Delmont and Keppens2011). An assessment of the physical relevance of our solutions will be presented in a forthcoming article. Here, we focus on the mathematical solutions of our model.
This article is structured as follows. In § 2, we explain our model, emphasizing how we bridge between our previous treatments of the parallel and the perpendicular cases. In particular, we introduce ‘Stage 1’ and ‘Stage 2’ which are supposed to be two stages of the kinetic history of the plasma. In § 3, we introduce the conservation equations for anisotropic temperatures, together with the dimensionless variables used subsequently. In §§ 4, 5 and 6, Stages 1 and 2 are studied separately. Then in § 7, we explain how they relate to each other in order to fully characterize the shock within our model for any field obliquity $\theta _1$ .
2. Method
Although the method used to deal with the oblique case has been explained in Bret & Narayan (Reference Bret and Narayan2022), we here outline it for completeness.
Consider an upstream with temperatures $T_{1\parallel }$ and $T_{1\perp }$
 . If the crossing of the front could be fully described by the isentropic Vlasov equation (Landau & Lifshitz Reference Landau and Lifshitz1981, § 27), the downstream temperatures could be related to the other quantities through the expressions derived in Chew, Goldberger & Low (Reference Chew, Goldberger and Low1956):

But the crossing of the front is not isentropic since in a shock there is an entropy increase from the upstream to the downstream. As a consequence, temperatures increase by more than the amount specified by (2.1), as found in the PIC simulations of Haggerty et al. (Reference Haggerty, Bret and Caprioli2022). In both the parallel case ($\theta _{1,2}=0$ ) and the perpendicular case ($\theta _{1,2}={\rm \pi} /2$
 ), we considered this excess goes into the temperature parallel to the motion, since the compression at the front can be considered to operate along this direction. As a consequence, the temperature parallel to the motion increases, while the temperature perpendicular to the motion remains constant.
Hence, denoting $T_\mathrm {entropy}$ as the temperature correction due to entropy generation, we took for the parallel case

and for the perpendicular case

In order to bridge between these two extremes, we now make the following ansatz:


where $T_e$ (subscript $e$
 for $e$
 ntropy) will be determined by the conservation equations.
Physically, (2.4) and (2.5) are motivated by our hypothesis that the excess energy goes into a direction parallel to the upstream velocity, by analogy with our previous treatments of the parallel and perpendicular shock subcases. Geometry is then used to divide the energy excess between $T_{2\parallel }$ and $T_{2\perp }$
 .
The scheme chosen in (2.4) and (2.5) is the simplest one fulfilling the following conditions:
(i) It correctly reduces to (2.2) and (2.3) for $\theta _2=0$
 and $\theta _2={\rm \pi} /2$.
(ii) All temperature excesses sum up to $T_e$
.(iii) It guaranties the two downstream temperatures normal to the field $\boldsymbol {B}_2$
are equal, which is required by the Vlasov equation (Landau & Lifshitz Reference Landau and Lifshitz1981, § 53).


Its relevance will have to be checked via PIC simulation, like that of Bret & Narayan (Reference Bret and Narayan2018) has been checked in Haggerty et al. (Reference Haggerty, Bret and Caprioli2022).
The downstream temperatures after the front crossing are therefore given by (2.4) and (2.5). We refer to this state of the downstream as ‘Stage 1’. Depending of the strength of the downstream field $\boldsymbol {B}_2$ , Stage 1 can be stable or unstable.
Previous analysis showed that Stage 1 can be firehose or mirror unstable. In the case where Stage 1 is firehose unstable, it migrates to the ‘Stage-2-firehose’ state, on the firehose instability threshold where (Hasegawa Reference Hasegawa1975; Gary Reference Gary1993; Gary & Karimabadi Reference Gary and Karimabadi2009)

with

where $k_B$ is the Boltzmann constant. In the case where Stage 1 is mirror unstable, it migrates to the ‘Stage-2-mirror’ state, on the mirror instability threshold where

At any rate, imposing condition (2.6) or (2.8) in the forthcoming conservation equations determines the state of the downstream. Our algorithm is summarized in table 1.
Summary of the assumed kinetic history of the plasma as it crosses the front. Although the formalism presented in § 3 allows for an anisotropic upstream, the model is only solved for $T_{1\parallel }=T_{1\perp }=0$ .

The firehose instability reaches its maximum growth rate for $\boldsymbol {k}$ parallel to the field, while the mirror instability reaches its maximum growth rate for a $\boldsymbol {k}$
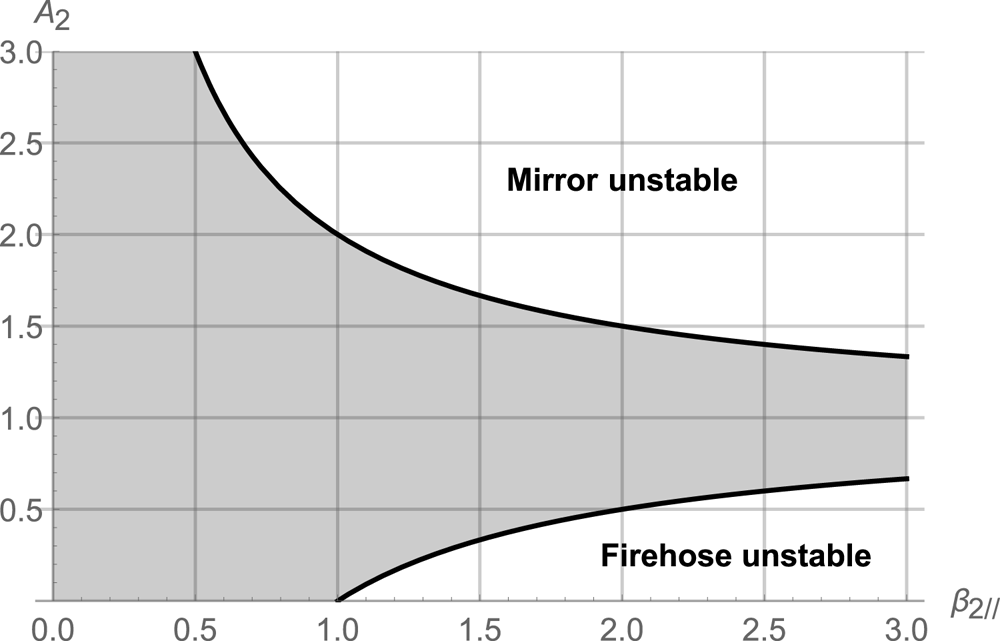
 making an oblique angle with the field (Gary Reference Gary1993, § 7.2). The instability thresholds (2.6) and (2.8) for the firehose and mirror instabilities are plotted in figure 2. Of note, the instability domains do not overlap in the $(\beta _{2\parallel },A_2)$
 plane so that the two instabilities cannot compete with each other.

3. Conservation equations
The conservation equations for anisotropic temperatures were derived in Hudson (Reference Hudson1970), Erkaev, Vogl & Biernat (Reference Erkaev, Vogl and Biernat2000) and Génot (Reference Génot2009). They have been re-derived in Bret & Narayan (Reference Bret and Narayan2022) with the present notations. They are formally valid even for anisotropic upstream temperatures, with $T_{1\parallel } \neq T_{1\perp }$ . Writing them for $T_{1\parallel }=T_{1\perp }\equiv T_1$
 , they read


where

The anisotropic upstream version of these equations is obtained by replacing the right-hand side of each equation by the left-hand side, changing subscripts ‘2’ to ‘1’ and then setting $\xi _1=0$ . Indeed, in the case where a shock propagates behind another one, the downstream of the first shock is eventually the upstream of the next one. A formalism accounting for an anisotropic upstream is therefore necessary since our model always leaves an anisotropic downstream (unless $\boldsymbol {B}_1=0$
 ).
Even though the model can be solved, the algebra is extremely involved. The system is symbolically solved with Mathematica. Its solutions are then numerically studied in MATLAB. On occasions, the Mathematica calculations give rise to the resolution of a polynomial of considerable length. In such cases, the polynomial is transferred to MATLAB using the Mathematica Notebook described in Bret (Reference Bret2010).
It is useful to focus on the quantity

as the system of equations above allows one to deduce a polynomial equation for $T2$ , easy to solve numerically. The general pattern of the resolution consists therefore of deriving such a polynomial and, from its roots, to compute the other downstream quantities like $n_2$
 , in terms of the upstream parameters.
The following dimensionless variables are used throughout this work:

While the Alfvén Mach number $\mathcal {M}_{A,i}$ is prominent in the shock literature, the related $\sigma$
 parameter is typically used in PIC simulations like those of Haggerty et al. (Reference Haggerty, Bret and Caprioli2022).
In order to simplify the problem, in the present work we restrict ourselves to the case $T_1=0$ , that is, the strong sonic shock case. This is why no sonic Mach number is defined above.
The upstream is therefore characterized by four variables: $n_1$ , $\theta _1$
 , $B_1$
 and $v_1$
 . The downstream is characterized by six variables: $n_2$
 , $\theta _2$
 , $B_2$
 , $v_2$
 , $\xi _2$
 and $T_e$
 . The six equations (3.1)–(3.6) then allow one to solve the problem.
We now outline the resolution of the conservation equations for Stage 1, Stage-2-firehose and Stage-2-mirror.
4. Study of Stage 1
With $T_{1\parallel }=T_{1\perp }=0$ , (2.4) and (2.5) for Stage 1 read

4.1. Symmetries
Although not immediately visible, the system (3.1)–(3.6) with prescriptions (4.1) has some symmetries.
It can be checked that, all other things being equal, if the set of angles $(\theta _1,\theta _2,\xi _2)$ is a solution, then $(-\theta _1,-\theta _2,-\xi _2)$
 is also a solution, while $(-\theta _1,+\theta _2,\pm \xi _2)$
 is not. This implies that we cannot ignore the negative $\theta _2$
 . We then restrict our exploration to $\theta _1 \in [0,{\rm \pi} /2]$
 and solve for $\theta _2,\xi _2 \in [-{\rm \pi} /2,{\rm \pi} /2]$
 .
4.2. Resolution
Resolving Stage 1 is then achieved through the following steps:
(i) Eliminate $v_2$
everywhere by extracting its value from (3.1).(ii) Eliminate $B_2$
everywhere by extracting its value from (3.2).(iii) Use the resulting (3.4) to eliminate $T_e$
.(iv) At this juncture, we are left with $n_2$
, $\theta _2$ and $\xi _2$ as unknowns. Parameter $\xi _2$ can be eliminated (defining $X2\equiv \tan \xi _2$). We finally obtain two equations for $r=n_2/n_1$ and $T2 = \tan \theta _2$.


The equation for $T2$ reads

with

The equation for $r$ reads

where

Equation (4.2) is a polynomial yielding various $T2$ branches as solutions. Scanning them, and using (4.4), allows the derivation of the density jump. Note that one value of $T2$
 gives one single value of $r$
 .
Equation (4.2) clearly displays two main branches:
(i) $T2 \cos \theta _1-\sin \theta _1 = 0$
, that is, $\theta _2=\theta _1$. Inserting in (4.4) gives $r=1$. This is the continuity solution.(ii) $\varLambda =0$
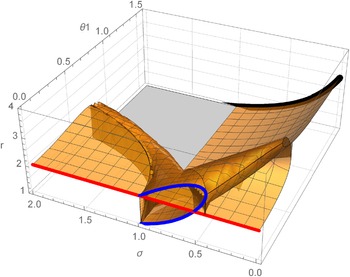
. The values of the density ratio $r$ so defined are represented in figure 3 in terms of ($\sigma,\theta _1$). For $\theta _1=0$, we recover the solutions found in Bret & Narayan (Reference Bret and Narayan2018, Reference Bret and Narayan2022). For $\theta _1={\rm \pi} /2$, we recover the solutions found in Bret & Narayan (Reference Bret and Narayan2019).


Values of the density ratio $r$ for Stage 1, with $\theta _2$
 given by $\varLambda =0$
 as defined by (4.2). The red curve was studied in Bret & Narayan (Reference Bret and Narayan2018). The blue one was studied in Bret & Narayan (Reference Bret and Narayan2022). The blue curve has $\theta _2>0$
 . The red one has $\theta _2 = 0$
 . The thick black curve at $\theta _1={\rm \pi} /2$
 was studied in Bret & Narayan (Reference Bret and Narayan2019).

All these Stage 1 solutions do not make their way to the end state of the downstream since some are unstable. We need now to assess the stability of Stage 1.
4.3. Stability of Stage 1
From (2.6) and (2.8), we see that assessing the stability of Stage 1 requires computing its anisotropy $A_2$ and its $\beta _{2\parallel }$
 parameter. The anisotropy for Stage 1 is straightforwardly given by (4.1) as

The $\beta _{\parallel 2}$ parameter is given by

Using (4.6) and (4.7) we can then numerically assess the firehose or mirror instability of Stage 1. Depending on the result, Stage 1 will be the end state of the downstream, or else it will migrate to Stage-2-firehose or Stage-2-mirror, on the corresponding instability thresholds.
5. Study of Stage-2-firehose
In the case where Stage 1 is firehose unstable, it will migrate to the firehose stability threshold. In order to determine its properties, we need now to impose condition (2.6) to the system (3.1)–(3.6) instead of the temperature prescriptions (4.1).
The resolution strategy is similar to that for Stage 1. Now $T2=\tan \theta _2$ is given solving

with

Then the density jump reads

Again, one value of $T2$ corresponds to one and only one value of $r$
 .
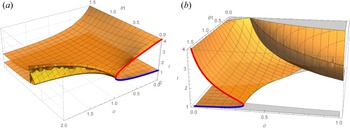
The density jump so defined is plotted in figure 4(a) in terms of $(\sigma,\theta _1)$ . For $\theta _1=0$
 , the red arc joining $(\sigma =0,r=4)$
 to $(\sigma =1,r=2)$
 fits exactly what was found in Bret & Narayan (Reference Bret and Narayan2018). In Bret & Narayan (Reference Bret and Narayan2018), we argued that the blue arc, joining $(\sigma =0,r=1)$
 to $(\sigma =1,r=2)$
 , was not a shock solution since it reaches $r=1$
 for $\sigma =0$
 . In fact, these blue solutions are discarded on an even simpler physical ground: they have $A_2 < 0$
 . For Stage-2-firehose, the anisotropy is no longer given by (4.6) but by

When computing this quantity for the lower, blue arc, and indeed for the whole lower surface in figure 4(a), $A_2 < 0$ is found. This property will be useful when putting Stages 1 and 2 together in § 7.
(a) Values of $r$ for Stage-2-firehose, where $\theta _2$
 is given by (5.1). The blue and red curves were studied in Bret & Narayan (Reference Bret and Narayan2018). The blue one has temperature anisotropy $A_2<0$
 and is therefore non-physical. (b) Values of $r$
 for Stage-2-mirror. The blue and red curves were studied in Bret & Narayan (Reference Bret and Narayan2019). The blue one has $A_2<0$
 .

6. Study of Stage-2-mirror
If Stage 1 is mirror unstable we need to impose relation (2.8) to the conservation equations. The quantity $T2$ is still a solution of the polynomial equation (5.1), where the coefficients are now

Then the density jump becomes

The results are plotted in figure 4(b) in terms of $(\sigma,\theta _1)$ . A pattern similar to that of Stage-2-firehose emerges here. When treating the $\theta _1={\rm \pi} /2$
 problem in Bret & Narayan (Reference Bret and Narayan2019), we discarded the lower branch in blue at $\theta _1={\rm \pi} /2$
 , arguing that it is not a shock solution since it reaches $r=1$
 for $\sigma =0$
 . It turns out that this branch again has anisotropy $A_2 < 0$
 . For Stage-2-mirror, this quantity reads

and is found negative on the blue arc in figure 4(b), as well as along the lower surface that extends from this arc.
7. Putting Stages 1 and 2 together
We finally come to the point where we can assemble Stages 1 and 2. This has been performed in MATLAB according to the following algorithm:
(a) Solve $\varLambda =0$
in (4.2) for $T2$ in Stage 1, and record all the branches of the solutions.(b) Then scan each Stage 1 branch. If a Stage 1 state is found stable, then this is the end state of the downstream.
(c) If a Stage 1 state is found firehose unstable, then switch to Stage-2-firehose, end state of the downstream.
(d) If a Stage 1 state is found mirror unstable, then switch to Stage-2-mirror, end state of the downstream.


Steps (c) and (d) can be non-trivial when, for an unstable Stage 1 state $(\sigma,\theta _1)$ , there are more than one Stage 2 states with the same $(\sigma,\theta _1)$
 . Some criteria are needed in order to select one Stage 2 state among the possible solutions. We apply the following ones:
(a) Discard Stage 2 states with $A_2<0$
since they represent non-physical solutions to the equations.(b) In the case where degeneracy persists, select the Stage 2 state which has $\theta _2$
closest to the unstable Stage 1.


We now check how this method retrieves our previous result, before applying it to any intermediate angle $\theta _1$ .
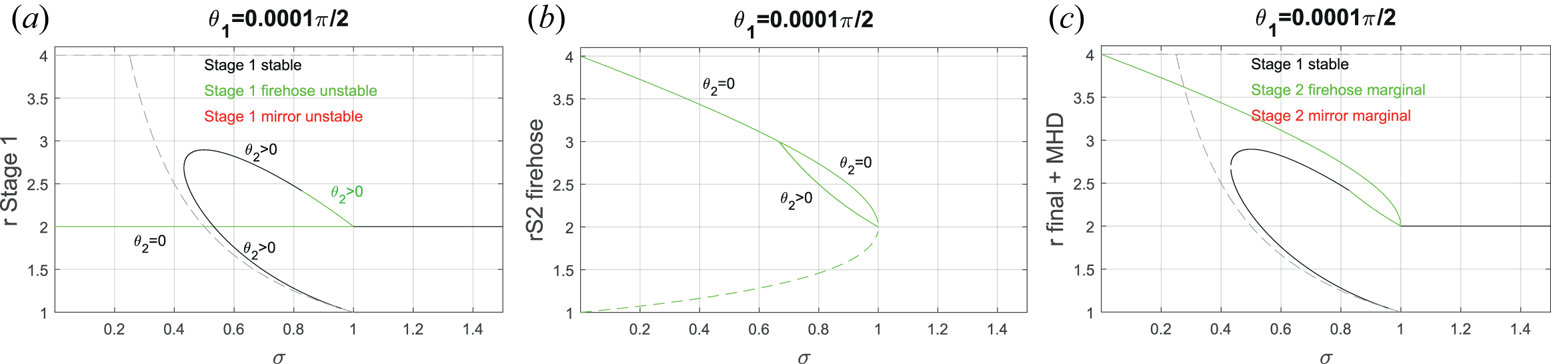
7.1. Case $\theta _1 \sim 0$

The case $\theta _1 \sim 0$ is pictured in figure 5. Figure 5(a) shows all Stage 1 solutions. Black means they are stable, green means they are firehose unstable. Red would mean mirror unstable, but, for the selected $\theta _1$
 , there are no such cases. The solution $r=2$
 has $\theta _1=\theta _2\sim 0$
 . It pertains to the parallel case which was studied in Bret & Narayan (Reference Bret and Narayan2018). The other solutions, which draw an open loop, pertain to the switch-on case studied in Bret & Narayan (Reference Bret and Narayan2022). They have $\theta _2 > 0$
 . These switch-on solutions are physical, namely they have $A_2 > 0$
 (see figure 4a of Bret & Narayan Reference Bret and Narayan2022).
(a) All solutions of Stage 1 for $\theta _1$ close to zero, colour-coded according to their stability (none is mirror unstable). (b) All Stage-2-firehose solutions. Dashed line indicates $A_2<0$
 (non-physical). (c) End result. The grey dashed lines show the MHD solutions.

Figure 5(b) shows all solutions for Stage-2-firehose. We see that an unstable Stage 1 state with $\sigma = 0.9$ , for example, can in principle go to three Stage-2-firehose states. Out of these three, one has $A_2<0$
 , as indicated by the dashed line in figure 5(b). Among the two remaining options, the upper one has $\theta _2=0$
 while the lower one has $\theta _2>0$
 . Therefore, choosing the Stage 2 state which has closest $\theta _2$
 to the unstable Stage 1, leaves only one possible option.
Figure 5(c) shows the end result. We recover the result of the parallel case, with a marginal firehose jump going from $r=4$ to 2 for $0 < \sigma < 1$
 , and then Stage 1 stable with $r=2$
 for $\sigma > 1$
 (Bret & Narayan Reference Bret and Narayan2018). Also recovered are the two switch-on solutions found in Bret & Narayan (Reference Bret and Narayan2022), with a portion of the upper one being replaced by its Stage-2-firehose counterpart.
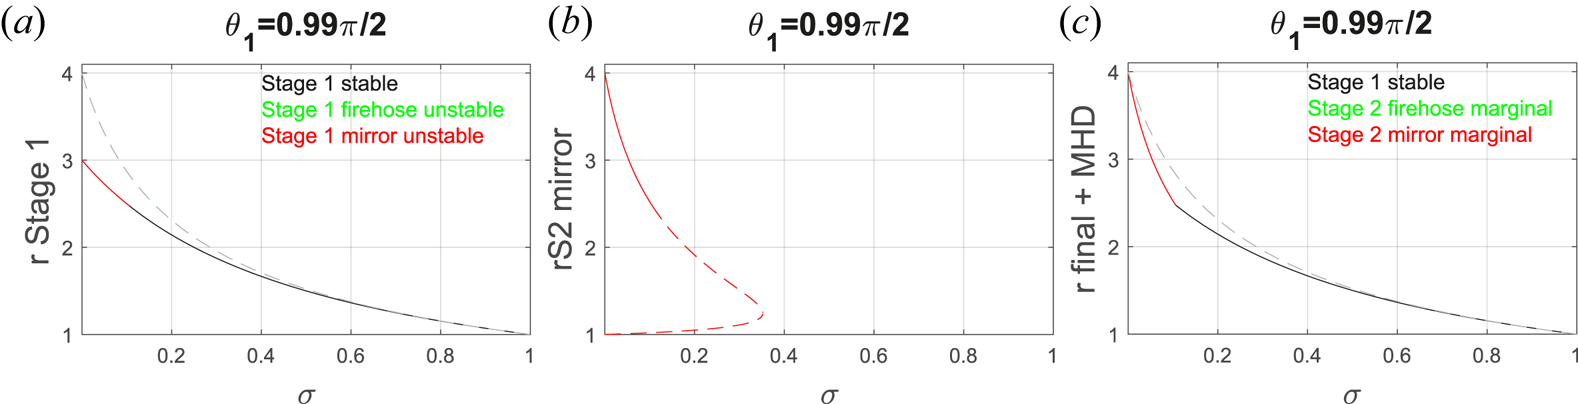
7.2. Case $\theta _1 \sim {\rm \pi}/2$

We here check the conformity of the present calculations with the results previously derived in Bret & Narayan (Reference Bret and Narayan2019) for the perpendicular case.
Figure 6(a) shows Stage 1 solutions. There is but one branch solution, mirror unstable for $\sigma < \sigma _c$ , where $\sigma _c=0.106$
 .
(a) All solutions of Stage 1 for $\theta _1$ close to ${\rm \pi} /2$
 , colour-coded according to their stability (none is firehose unstable). (b) All Stage-2-mirror solutions. Dashed line indicates $A_2<0$
 (non-physical). (c) End result. The grey dashed lines show the MHD solutions.

Figure 6(b) shows all Stage-2-mirror branches. There is but one, with $A_2 < 0$ below $r \sim 2.47$
 , which is reached for $\sigma =\sigma _c'$
 . We checked numerically, up to the 13th digit, that $\sigma _c = \sigma _c'$
 .
As a consequence, figure 6(c), which features the end result, has no gap. It fits exactly the result of Bret & Narayan (Reference Bret and Narayan2019). For $\sigma < \sigma _c$ , Stage 1 is mirror unstable and the end state is Stage-2-mirror. Then for $\sigma > \sigma _c$
 , Stage 1 is stable and gives the density jump of the end state.
7.3. General oblique case
Figure 7 pictures the situation for an intermediate angle $\theta _1 = 0.3 {\rm \pi}/2$ . Figure 7(a) shows all of Stage 1 solutions. Here, some are mirror unstable while others are firehose unstable. Looking at figures 7(c) and 7(b) we can see that there is always a Stage 2 solution when Stage 1 is unstable. For some values of $\sigma$
 , for example 0.1 or 1.25, there are various unstable Stage 1 solutions. As a consequence, figure 7(d) displays various solutions for the end state corresponding to these $\sigma$
 .
(a) All Stage 1 solutions for $\theta _1 = 0.3 {\rm \pi}/2$ , colour-coded according to their stability. (b) All Stage-2-firehose solutions. Dashed line when $A_2 < 0$
 (non-physical). (c) All Stage-2-mirror solutions. Dashed line when $A_2 < 0$
 (non-physical). (d) End result. The grey dashed lines show the MHD solutions.

Notice also how our solutions mimic the MHD solutions (dashed grey lines) at low $\sigma$ and high $\sigma$
 .
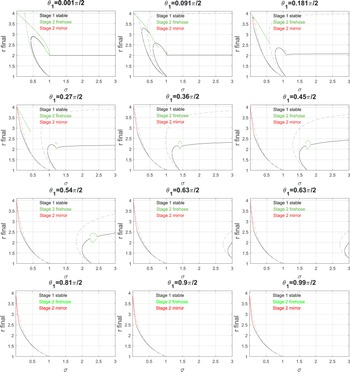
Finally, figure 8 presents a series of plots similar to figure 7(d), for various values of $\theta _1 \in [0, {\rm \pi}/2]$ .
Similar to figure 7(d), but for various values of $\theta _1 \in [0, {\rm \pi}/2]$ . The grey dashed lines show the MHD solutions.

8. Conclusion
In a series of recent articles, we elaborated a model of collisionless shocks. Having treated the parallel, the perpendicular and the switch-on cases (Bret & Narayan Reference Bret and Narayan2018, Reference Bret and Narayan2019, Reference Bret and Narayan2022), with our model for the parallel case being successfully tested against PIC simulations (Haggerty et al. Reference Haggerty, Bret and Caprioli2022), we here treated the general oblique case.
The MHD conservation equations for the general oblique case tend to be involved. The MHD conservation equations for anisotropic temperatures are even more involved. And our model adds temperature prescriptions to these equations. As a result, its resolution is lengthy and requires extensive use of Mathematica, to symbolically derive the key equations, and of MATLAB, to numerically solve them. The present work was devoted to the exposition of the mathematical solutions offered by our model. Their physics will be assessed in a forthcoming article.
In this respect, our model frequently offers various solutions for the same value of $\sigma$ . Yet, figure 5(a,c) shows that such is also the case in MHD. This is also visible in figure 7(a–d) and in most of figure 8. In MHD, the solution selected depends on its physical relevance (see second-to-last paragraph of the introduction), or on the initial conditions of the shock formation like, for example, which initial states of a Riemann problem it is supposed to connect. In general, this second issue, namely connecting two different states, requires a succession of shocks rather than one single shock (see e.g. Ryu & Jones Reference Ryu and Jones1995). In our model, the choice of the solution when various are offered will most probably depend on the same factors. This topic will be addressed in a forthcoming paper.
Even though only the case of a cold upstream has been solved here, the formalism allows in principle for an anisotropic upstream.
Although we treated the field obliquity as an arbitrary parameter, this study remains limited in various ways:
(a) A pair plasma is considered.
(b) Velocities are non-relativistic.
(c) The upstream pressure is assumed zero.
(d) The shock is coplanar, namely upstream and downstream fields and velocities share a common plane.
Regarding limitation (a), PIC simulations could be used to test the relevance of our model to electron–ion plasmas, provided the $\sigma$ parameter in (3.9a–c) is defined using the ion mass.
Tackling the other limitations altogether is clearly out of reach. At any rate, further testing of our model is envisioned through PIC simulations or comparison with in situ measurements at interplanetary shocks, by spacecrafts like Advanced Composition Explorer, Wind or the Parker Solar Probe (see e.g. David et al. Reference David, Fraschetti, Giacalone, Wimmer-Schweingruber, Berger and Lario2022).
As evidenced in figure 8, deviations from MHD are more pronounced for quasi-parallel shocks and $\sigma > 1$ . This is therefore the domain where our model should preferably be compared with PIC simulations or in situ measurements.
Acknowledgements
Thanks are due to Roberto Piriz for enriching discussions.
Editor Luís O. Silva thanks the referees for their advice in evaluating this article.
Funding
A.B. acknowledges support from the Ministerio de Economía y Competitividad of Spain (Grant No. PID2021-125550OB-I00). R.N. acknowledges support from NSF Grant No. AST-1816420. R.N. and A.B. thank the Black Hole Initiative at Harvard University for support. The BHI is funded by grants from the John Templeton Foundation and the Gordon and Betty Moore Foundation.
Declaration of interests
The authors report no conflict of interest.