1. INTRODUCTION
One of the essential features of a traditional synchrotron with radio frequency (RF) cavities is that it accelerates charged particle beams while confining the beam longitudinally due to the well-known principle of phase stability. However, for heavy-ion inertial fusion (HIF), very short high-intensity beams are required for effective ignition. Induction cells provide the feasibility of compressing the beam and increasing the beam intensity as well demonstrated by the Neutralized Drift Compression Experiment (Friedman et al., Reference Friedman, Barnard, Cohen, Grote, Lund, Sharp, Faltens, Henestroza, Jung, Kwan, Lee, Leitner, Logan, Vay, Waldron, Davidson, Dorf, Gilson and Kaganovich2010; Waldron et al., Reference Waldron, Abraham, Arbelaez, Friedman, Galvin, Gilson, Greenway, Grote, Jung, Kwan, Leitner, Lidia, Lipton, Reginato, Regis, Roy, Sharp, Stettler, Takakuwa, Volmering and Vytla2014).The concept of the induction synchrotron (Takayama & Kishiro, Reference Takayama and Kishiro2000) was motivated by an idea that the acceleration and longitudinal confinement of a charged particle beam in a synchrotron could be separated by introducing induction cells which are 1:1 pulse transformers. These induction cells are driven by switching power supply devices (Wake et al., Reference Wake, Arakida, Koseki, Shimosaki, Takayama, Torikai, Jiang, Nakahiro, Tokuchi and Sugiyama2007) to generate the required voltage pulses, which use solid-state switching elements such as MOSFETs. In principle, there is no limitation on the revolution frequency in a circular ring. As a result, any ions can be accelerated from sonic velocity to relativistic velocity in a single circular accelerator without a large-scale injector (Takayama et al., Reference Takayama, Arakida, Iwashita, Shimosaki, Dixit and Torikai2007). In addition, an intrinsic nature in this voltage pulse generation leads to a wide range of freedom in longitudinal beam manipulation (Liu et al., Reference Liu, Takayama, Adachi and Harada2011; Yoshimoto et al., Reference Yoshimoto, Barata, Iwashita, Harada, Arakawa, Arai, Liu, Adachi, Asao, Kadokura, Kawakubo, Kubo, Leo, Nakanishi, Okada, Okamura, Okazaki, Someya, Takayama and Wake2014). These techniques developed along with the induction synchrotron could be applied to HIF which requires complicated beam manipulation.
An ion beam with A/Q = 4, where A and Q are particle mass number and charge state, respectively, has been successfully accelerated from 500 keV/u at injection to a few tens of MeV/u (Takayama et al., Reference Takayama, Yoshimoto, Barata, Wah, Xingguang, Iwashita, Harada, Adachi, Arai, Arakawa, Asao, Kadokura, Kawakubo, Nakanishi, Okada, Okamura, Okazaki, Takagi, Takano and Wake2014; Yoshimoto et al., Reference Yoshimoto, Barata, Iwashita, Harada, Arakawa, Arai, Liu, Adachi, Asao, Kadokura, Kawakubo, Kubo, Leo, Nakanishi, Okada, Okamura, Okazaki, Someya, Takayama and Wake2014). The A/Q = 4 beam can be categorized into the medium charge state ion beam. In this paper, the injection and test acceleration of the Ar3+ beam, A/Q ≈ 13, which represents low charge-state ions (metal ion in most cases), are described. Specifically, the paper will focus on the free running of a single bunch under the static magnetic field, longitudinal confinement under the static magnetic field, and beam acceleration and longitudinal confinement under a ramping magnetic field.
So far, two approaches for HIF have been proposed (Bangerter, Reference Bangerter1993; Hofmann, Reference Hofmann1998). Related R&D has continued since their early days of proposal. These approaches have been presented at the series of the International Symposium on HIF. It should be emphasized that the induction synchrotron and heavy-ion beam handling here are closely related to the European scheme (Hofmann, Reference Hofmann1998), where there is a large-scale RF linac of a booster accelerator at the early stage of acceleration, storage rings used for beam stacking and acceleration, and a large induction linac at the last stage for beam handling. According to the recent proposal by Takayama (Reference Takayama2013), most of the RF linac and storage rings could be replaced by an induction synchrotron if distinct abilities such as long beam acceleration, flexible longitudinal beam manipulation, and wide A/Q accommodation are realized. It should be strongly emphasized that the present activities and heavy-ion beam experiments using the Digital Accelerator of the High-Energy Accelerator Research Organization (KEK-DA) mimic some parts of a future HIF driver.
2. FACILITY AND BEAM
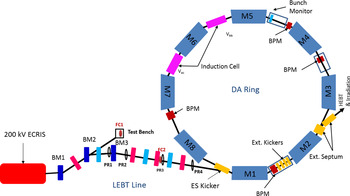
The KEK-DA as a compact heavy-ion accelerator facility consists of the necessary components from ion source to beam dump. Figure 1 shows a schematic view of this facility.
Schematic view of the KEK-DA.

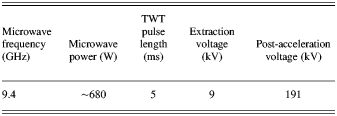
The main parameters of the electron cyclotron resonance ion source (ECRIS), which is embedded in the high-voltage platform of ~200 kV and generates the Ar3+ ion beam for the present experiment, are listed in Table 1.
ECRIS parameters for Ar3+ ion production
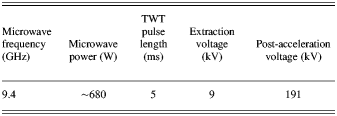
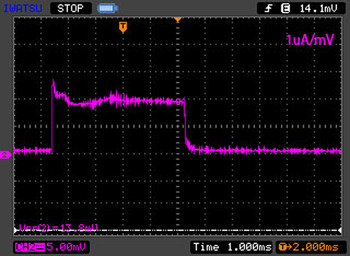
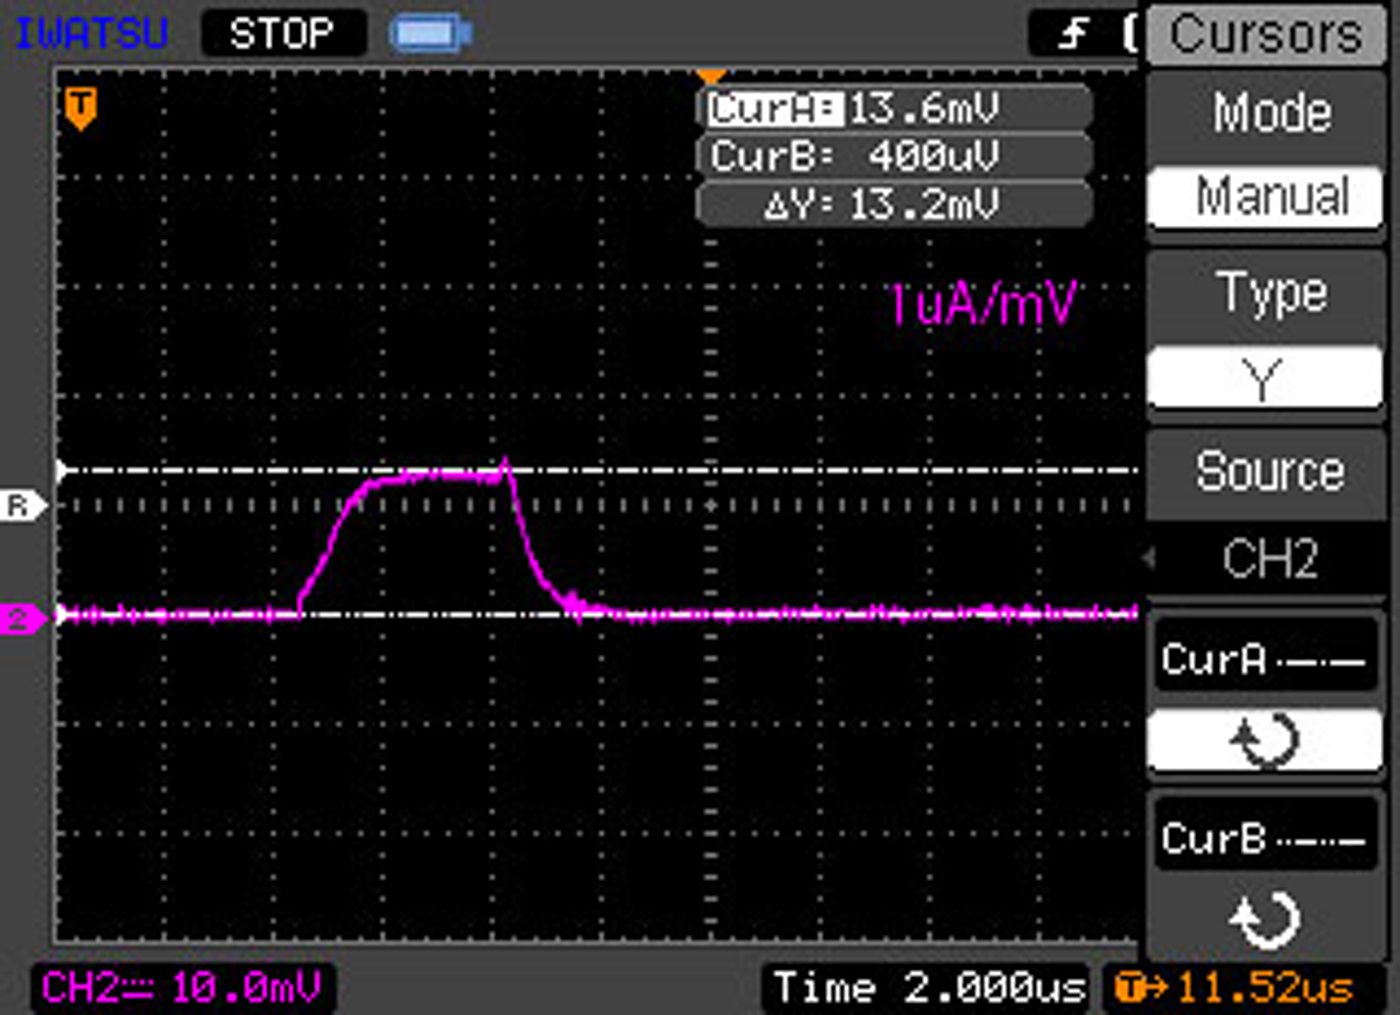
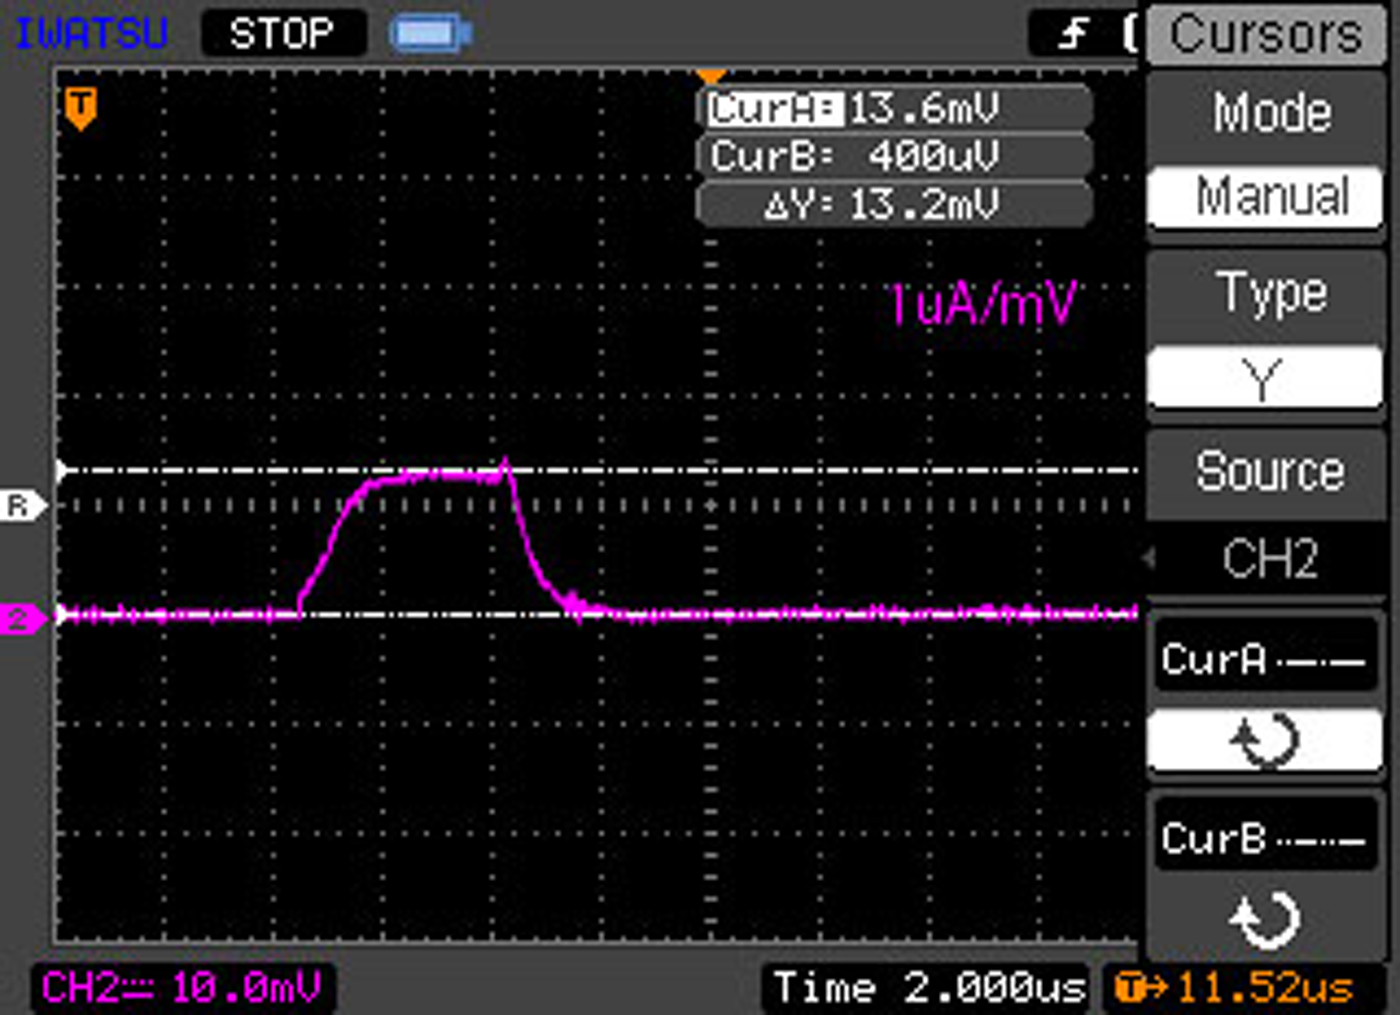
Though the microwave pulse length is set to be 5 ms, the KEK-DA can only accept a several μs-long beam (usually, 2–4 μs) for injection. The Einzel lens, which is installed between the extraction region and post-acceleration region to focus the beam transversely, works as a chopper device by controlling the voltage on the middle electrode with a solid-state Marx generator (Adachi et al., Reference Adachi, Arai, Leo, Takayama and Tokuchi2011), as well as a focusing device. A Faraday cup (FC1) is installed at the test bench (Fig. 1) for beam parameter measurements. Figure 2 shows the original long Ar3+ beam from the ECRIS, while the chopped bunch measured at another FC2 on the low-energy beam transport (LEBT) line with a peak current of 13 μA is shown in Figure 3.
The original 5 ms long beam delivered from the ECRIS tested at FC1 (CH2, 5 mV/div, 1 μA/mV).

The chopped 4 μs beam (CH2, 10 mV/div, 1 μA/mV).
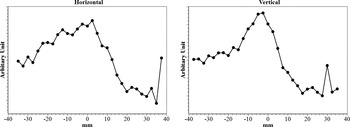
Four wire monitors are installed on the LEBT line for beam profile measurements. Figure 4 shows the horizontal and vertical beam profiles observed at the location of PR2 (Fig. 1).
Ar3+ beam profile at PR2.

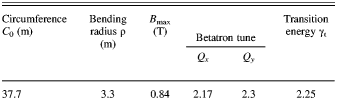
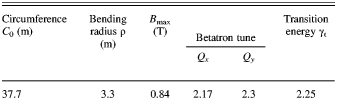
The beam propagates through the LEBT line and is then injected into the ring by the electrostatic injection kicker (Adachi & Kawakubo, Reference Adachi and Kawakubo2013), which is turned off immediately after beam injection in order to prevent from kicking the injected beam again when it arrives at the injection region. Table 2 shows the machine parameters of the KEK-DA ring and its magnets, which are all combined-function magnets.
Machine parameters of the KEK-DA ring
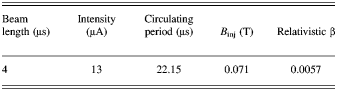
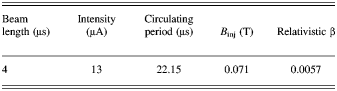
The parameters for the injected Ar3+ beam at 15 keV/u are listed in Table 3. The beam length chosen fills about one-fifth of the ring at injection. The initial velocity of the beam is very low. The relativistic β is only about 0.006, which suggests that the present beam is highly space charge dominated. After acceleration in the ring, the beam is kicked out by the extraction kickers and transported through the extraction septum to the high-energy beam transport line for dumping the beam or other experiments.
Injected beam parameters
3. EXPERIMENTAL RESULTS AND DISCUSSION
3.1. Free Running Under a Static Magnetic Field
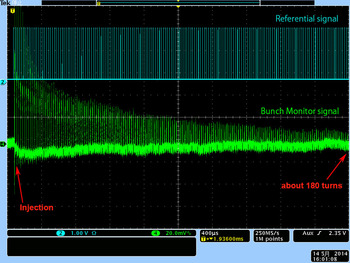
Figure 5 shows the temporal evolution of the bunch monitor signal, after the 4 μs long beam has entered the ring under the static magnetic field. CH4 (green color in Fig. 5) represents the Ar3+ bunch signals measured with the Bunch Monitor, from which one can see the bunch structure sustains over 4 ms (or about 180 turns). CH2 represents the computer-generated turn-by-turn referential signals, which are used to indicate the start of each turn.
Temporal evolution of the Ar3+ beam signals taken with the Bunch Monitor under the static injection magnetic field (CH4) and turn by turn referential signals (CH2).

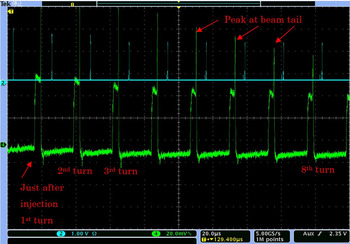
Figure 6 shows a better bunch structure evolution process for the Ar3+ beam for the first few turns just after injection (CH4, green) with the referential signals (CH2, light blue). It obviously shows that a peak emerges at the beam tail (marked out with arrows in Fig. 6). This is known to be caused by the momentum modulation effects of the Einzel Lens when it works as a beam chopper (Leo et al., Reference Leo, Adachi, Arai and Takayama2013).
The Bunch Monitor signals (CH4) for the first few turns just after injection with a sharp peak at the bunch tail. CH2 shows the referential signals for each turn.

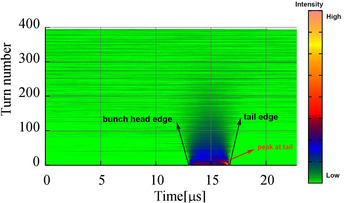
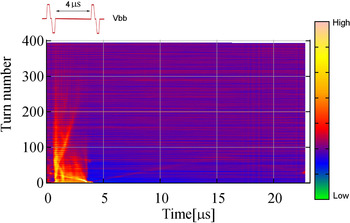
While Figure 5 directly shows the intensity change over the time and picture as Figure 6 shows the bunch structure evolution, a plot like in Figure 7 proves to be more useful for practical use. In Figure 7, the horizontal axis is the time, corresponding to a revolution period (about 22 μs here) and the vertical axis corresponds to turn number. The color scale in Figure 7 is used to reflect the beam intensity amplitude. Referential signals in Figures 5 and 6 (CH2) are used to separate each turn's bunch signal then these signals are plotted based turn after turn as shown in Figure 7. From Figure 7, one can see that the beam intensity drops rapidly when the beam circulates inside the ring. This is partly due to beam loss which will be briefly discussed later. It is also due to the fact that the beam becomes longer due to the momentum spread and space charge repulsion (which is small in this case because of low intensity). Two black arrows in Figure 7 are plotted to show the bunch head edge and tail edge, from which one can see that the beam spreads out in the longitudinal direction. From Figure 7, one can also see the peak at the beam tail and its evolution track. It travels toward the beam head which indicates that it has a negative momentum deviation compared with the beam center (Leo et al., Reference Leo, Adachi, Arai and Takayama2013).
Bunch signals under the static magnetic field.

3.2. Longitudinal Confinement Experiment
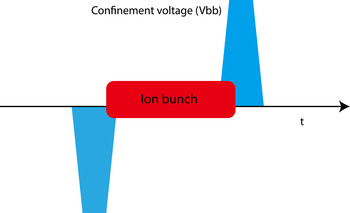
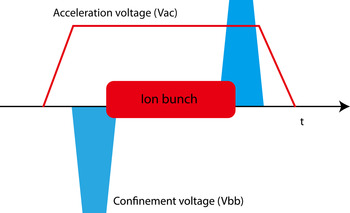
One of the notable features of the induction synchrotron is that the longitudinal confinement is separated from the acceleration. Two voltage pulses are implemented for this purpose to prevent the beam from spreading longitudinally as illustrated in Figure 8. In the KEK-DA, the induction cells used for confinement are located at the straight section between M5 and M6 as shown in Figure 1. These voltage pulses are triggered every turn to confine the beam longitudinally. Besides, the distance between the two pairs of pulses is kept to be the same as the beam length at injection.
Schematic view of the longitudinal confinement of the beam in the KEK-DA.

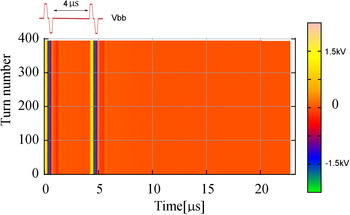
In the actual experiment, instead of two voltage pulses showed in Figure 8, two pairs of pulses are generated as shown on the top left of Figure 9. Each pair has a positive pulse and a negative pulse so that the induction cells get reset properly. Figure 9 plots the voltage pulses used for confinement in the same way as Figure 7, with the only difference here that the color scale represents the amplitude of the voltage pulse. The voltage pulses used for this experiment are 1.5 kV for the amplitude, 150 ns for the flattop width, and 80 ns for the rise/fall time. In this figure, the yellow and blue colors stand for the set (positive) and reset (negative) voltage pulses, respectively.
Confinement pulse voltages used for the Ar3+ confinement experiment under the static injection magnetic field.

Figure 10 shows a typical experimental result of longitudinal confinement. The beam is confined between the barrier voltage pulses and the beam structure is visible over a longer time compared with the free running case as shown in Figure 7.
Ar3+ beam confined by the pulse voltages.

3.3. Induction Acceleration Experiment
Under the ramping magnetic fields, acceleration is essential to keep the beam on the design orbit, while the confinement voltage pulses are still necessary for longitudinal confinement. Figure 11 shows a schematic view of the combination of both of them, where the flattop of acceleration voltage pulse has to be long enough for the whole beam.
Induction acceleration with longitudinal confinement voltages.

The ramping magnetic field changes sinusoidally as:
 $$B(t) = \displaystyle{{{B_{{\rm max}}} + {B_{{\rm min}}}} \over 2} - \displaystyle{{{B_{{\rm max}}} - {B_{{\rm min}}}} \over 2}{\rm cos(}{\rm \omega} t{\rm )}$$
Here B min and B max are the magnetic flux density at injection and extraction, respectively. In this experiment B min is set to 0.071 T and B max is set to 0.3 T. ω is the angular frequency of the ramping magnetic field which is 10 Hz in this case. The required acceleration voltage at each turn is given by
 $$V = {\rm \rho} {C_0}\displaystyle{{dB} \over {dt}}$$
where ρ is the bending radius of the KEK-DA ring magnets and C 0 is the circumference of the KEK-DA ring. Theoretically, the acceleration required by the beam is different at each turn as known from this equation. However, output voltage of the present induction acceleration cell is fixed at a pre-defined voltage. It is impossible to change the output voltage for each turn but the trigger to output the voltage for each turn could be turned on/off easily with FPGA programming. As a result, when the required voltage determined from Eq. (2) is less than the pre-defined voltage, no voltage pulse for acceleration will be triggered. After several turns, when the “missed” required voltage accumulates to the pre-defined voltage, one acceleration pulse will be triggered to keep the beam on the right orbit. However, in the middle of acceleration cycle, almost every turn the acceleration will be triggered to accelerate the beam. We call this method as “pulse density control”, which was described in much more detail in previous publications (Dixit et al., Reference Dixit, Iwashita and Takayama2009; Iwashita et al., Reference Iwashita, Adachi, Takayama, Leo, Arai, Arakida, Hashimoto, Kadokura, Kawai, Kawakubo, Kubo, Koyama, Nakanishi, Okazaki, Okamura, Someya, Takagi, Tokuchi and Wake2011).
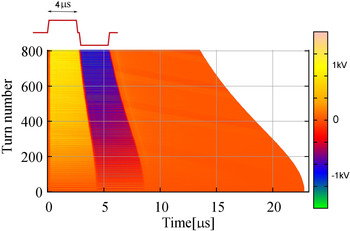
The acceleration voltage pulses used in the experiment are shown in Figure 12. Though only the positive voltage pulse (set) is needed to accelerate the beam, a negative voltage pulse (reset) is triggered followed by the positive pulse to reset the induction cell. Here only 1000 turns are plotted out because the beam does not survive too long in this case. In addition, the confinement voltage pulses are not shown for simplicity. Yellow represents the set voltage (1 kV), which is also the acceleration voltage pulse. Blue represents the reset voltage (−1 kV) required by the induction cell. Figure 12 also shows that before 200 turns, not too many pulses are triggered, while after 500 turns, the pulses are triggered much more frequently under the pulse density control scheme. Figure 12 also shows that the flattop of the acceleration causes/suitable term shrinking as time goes on. This is because we have kept the beam length fit within one-sixth of the revolution period. In fact, the beam length in the KEK-DA can be controlled simply by controlling the time delay between the confinement voltage pulses.
Voltage pulses generated for beam acceleration under the ramping magnetic field.

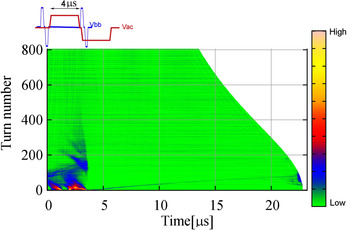
Under the effects of acceleration and longitudinal confinement, as shown in Figure 13, the beam profile changes dramatically along the way of acceleration. This will be investigated more when higher beam intensity is ready. As mentioned previously, the horizontal axis in the plot corresponds to the revolution period, so in Figures 12 and 13, the horizontal background shrinks as the acceleration proceeds under the ramping magnetic field.
Ar3+ beam accelerated and confined by induction cells under the ramping magnetic field.

3.4. Beam Lifetime
For such a low-energy beam, the beam lifetime is highly affected by the interaction between ionized particles and the residual gas: Coulomb scattering and electron striping/capture. Beam loss due to these effects can be reduced by increasing the vacuum level. In the KEK-DA, the vacuum in the ring has been improved from 10−7 to 10−8 Torr to alleviate this concern.
In addition, the KEK-DA has been upgraded from the original Booster ring for the KEK Proton Synchrotron, where the straight section with induction cells is not dispersionless. Therefore, synchro-beta coupling occurs during the process of acceleration, resulting in beam loss with mismatched transverse phase space (Takayama et al., Reference Takayama, Yoshimoto, Barata, Wah, Xingguang, Iwashita, Harada, Adachi, Arai, Arakawa, Asao, Kadokura, Kawakubo, Nakanishi, Okada, Okamura, Okazaki, Takagi, Takano and Wake2014).
4. SUMMARY AND FUTURE WORK
An Ar3+ beam has been injected into the KEK-DA at the injection energy of 15 keV/u and experimental results of free running under the static magnetic field, longitudinal confinement under the static magnetic field, and acceleration and longitudinal confinement experiment under a ramping field are discussed. However, because the intensity of the injected beam is only about 13 μA, it is hard to observe the beam signals after only a few hundred turns. The ECRIS is currently being optimized to increase the beam intensity. Furthermore, a laser ablation ion source (LAIS) is under development to be integrated into the KEK-DA for further study (Munemoto et al., Reference Munemoto, Takayama, Takano, Okamura and Kumaki2014). With the ECRIS and LAIS, the KEK-DA can provide many ion species with various A/Q values. In addition, this system is all digitally triggered, so the extracted beam's energy could be easily changed by setting the maximum of the ramping magnetic field. As a result, in addition to the flexibility of the beam acceleration and manipulation which are essential techniques for HIF, the KEK-DA could also play a role in HIF related studies like beam-plasma interaction.