Introduction
Remote sensing technologies for commercial research, academic study and precision agriculture (PA) use are entering a new phase. Affordable sensors, and the platforms they are mounted on, have driven the commercial advancement of remote sensing within the agricultural sector as a decision support tool (DST). It has been estimated that PA, particularly a combination of yield mapping, crop mapping and variable rate technologies, could provide an average savings of up to US$25 per acre (≈£8 ha−1) compared with conventional farming methods, although some farmers have reported savings of up to £17 ha−1 on some fields (Casswell Reference Casswell2014; Schimmelpfennig and Ebel Reference Schimmelpfennig and Ebel2016). At the same time, remote sensing technologies are allowing researchers to collect data on larger trials than ever before (Mackay et al., Reference Mackay, Ober and Hickey2015). These achievements have primarily been based on the use of digital cameras and multispectral sensors, technologies that have been in use since the 1980 s. Now, newer technology presents us opportunities for the specialisation of remote sensing within PA and research.
Platforms
The application of remote sensing to PA and research requires three components: a sensor, a platform to mount the sensor on, and image processing capability. Whilst the sensor and image processing will ultimately decide the quality of the information remote sensing can provide, the platform impacts the sensors effectiveness. In essence there are three types of sensor platforms: ground-based, air-based and satellite. Ground-based platforms can range from a simple trolley that is pushed by hand to a fully robotic system. These tools provide many benefits over traditional field walking: they are quicker, reduce worker fatigue, provide for more consistent measurements, and can capture numerous measurements. Robotic platforms can continuously collect data from the field, even at night if the type of measurement allows. Air-based platforms are either manned aerial vehicle (MAV) or unmanned aerial vehicle (UAV). Both platforms capture data from a large area quicker than ground-based platforms. As a result UAVs and MAVs offer more consistent measurements as environmental conditions are less likely to have changed between the first and last capture. On the other hand, UAVs, unlike ground-based platforms, cannot carry heavy sensor packages, and limited battery life means fewer measurements can be taken per flight. In addition, UAVs cannot operate well in rainy or windy conditions due to instability of the sensor platform, or the angle of attack required captures too much of the horizon on downward-facing cameras. With any platform, changing light levels and light quality can compromise measurements unless steps are taken to compensate for this potential source of error. For example, upwelling sensors can be used to measure incoming radiation at the same time reflected light is measured, or use of standard reflective surfaces on the ground can be used to correct for these changes.
MAVs are more flexible in their deployment and have the capacity to carry numerous sensors. As UAVs fly at a height above the canopy of the crop, naturally the image resolution is decreased in comparison to ground-based platforms. However, even standard, inexpensive cameras have resolved objects to the cm scale at an elevation of 50 m. MAVs that fly higher have an even lower resolution of ground features. Fixed wing aircraft have a minimum airspeed requirement to maintain lift; at altitudes lower than 500 m, the speed of data acquisition from the target area is exceeded using current instrumentation. Helicopters can avoid this limitation, but downwash from the rotors may affect the crop features of interest. Satellite-derived imagery can be useful to certain PA applications, as they can cover large areas in a short period of time. However, image resolution is further reduced compared with air and ground-based platforms and therefore insufficient for research based on typical field plot dimensions. Image resolution has improved from 30 m (Landsat 8) to 2 m (Sentinel-2) to 37 cm (WorldView3), and this trend appears to be continuing. In addition, once launched, the remote sensor packages on satellites cannot be changed easily. All three platforms have their benefits and limitations, and their deployment requires a good understanding of the task at hand and the capabilities of the various methods.
Current approaches
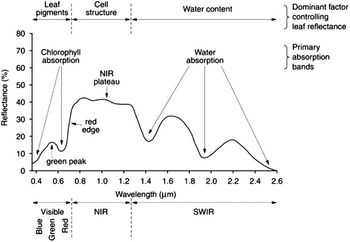
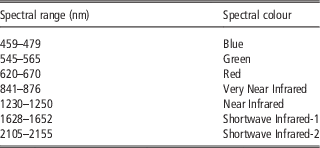
At present the two major tools used in PA are the digital camera and multispectral sensor. Traditionally the digital camera is used to identify visual traits within the field whilst multispectral sensors are used to produce indices that can assess plant growth and development. It is important to note that sensors can collect data in two distinct ways. Devices such as the RapidScan convert reflectance data to a voltage that is interpreted by a sensor, depending on its wavelength filter. Cameras produce an image which is viewed and interpreted as a picture, or processed and analysed to extract numerical information from the pixels. Commercially available digital cameras can provide rudimentary estimates of plant height, plant counts and crop cover. Unlike digital cameras, which capture bands of light within the visible spectrum (0.45–0.67 μm, Table 1, Figure 1), multispectral cameras capture extra bands of light within the near-infrared and infrared parts of the spectrum (Table 2, Figure 1). It is possible to convert digital cameras to capture multispectral images by removing their infra-red filter although this approach does not produce the high-resolution of specifically produced multispectral cameras.
Spectral reflectance of vegetation. Reflectance shown in the visible, near-infrared (NIR) and short-wave infrared wavelengths. Figure adapted from Keyworth et al. (Reference Keyworth, Jarman and Medcalf2009).

Spectral ranges of 7-bands captured by multispectral cameras. Adapted from Marshall et al. (Reference Marshall, Thenkabail, Biggs and Post2016)

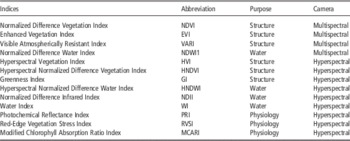
Selected subset of remote sensing multispectral and hyperspectral ratios. Adapted from Marshall et al. (Reference Marshall, Thenkabail, Biggs and Post2016)

From multispectral images it is possible to produce numerous vegetation indices by comparing the bands captured (Table 2, reviewed in Marshall et al., Reference Marshall, Thenkabail, Biggs and Post2016). These indices, particularly NDVI, are more effective at identifying green plant material than a simple digital camera. As a result multispectral cameras are better at predicting plant height, crop cover and plant counts than the digital camera (Torres-Sánchez et al., Reference Torres-Sánchez, López-Granados and Peña2015). Usually the analysis of crop height using digital elevation models derived from photogrammetry requires two flights and geodetic targets or ground control points (GCPs) (Richards Reference Richards1999). GCPs are in essence references for every flight. Before the first flight the latitude, longitude, elevation, and position relative to photo-identifiable elements of each GCP is accurately measured using GPS and subsequent height measurements are calculated relative to the GCPs. An initial bare earth flight conducted as soon after drilling as possible establishes the baseline topography of the field. It is then possible to analyse the elevation models and estimate the crop height by subtracting the bare earth elevation from the canopy heights identified in later flights. Remote sensing plant counts requires an area of non-green pixels between the plants allowing image processing programs to segment the number of areas of connected green pixels, thus giving a plant count (Guijarro et al., Reference Guijarro, Pajares, Riomoros, Herrera, Burgos-Artizzu and Ribeiro2011). If the leaves of the plants are overlapping in the crop post-image processing cannot distinguish between plants. As with identifying plant counts, crop cover is calculated by comparing green pixels verse non-green pixels within a certain area but is expressed as a percentage. In addition to these measurements, the indices produced by the multispectral camera can be used to predict crop N-status, photosynthetic activity, crop stress, damage, and senescence (Table 2, Marshall et al., Reference Marshall, Thenkabail, Biggs and Post2016). Mapping these traits can be used to identify areas with high weed cover, identify N stress, and reduce costs by £8 ha−1 (Schimmelpfennig and Ebel Reference Schimmelpfennig and Ebel2016). By combining information provided by these indices and weather data it is possible to produce yield prediction models, although these are still limited by the accuracy and reach of weather forecasts. In research the identification of differences in N-status, photosynthetic activity, weed cover, crop stress/disease, damage, and senescence could give important information about the performance of experimental varieties in the field.
Potential advancements
Remote sensing has reached a stage where it can provide reliable agronomical trait measurements to PA users and researchers alike. As platforms and new sensors become cheaper and more readily available, PA users and researchers will be able to develop specialised tools for identification of specific traits. Initially, these developments will be driven by hyperspectral cameras. A hyperspectral camera captures numerous spectral bands (up to 220 contiguous bands of widths typically 2 nm) covering a small range of the electromagnetic spectrum 0.4–2.5 μm, as compared to the five to ten broad bands (0.4–2.3 μm) collected by the multispectral camera (NASA 2016; USGS 2016). It has already been shown that more specific traits can be identified using specific combinations of multiple narrow bands (Table 2). For example, specific diseases, instead of overall plant stress, have been identified using hyperspectral cameras (Mahlein Reference Mahlein2016). This is particularly exciting as it provides the potential for a high-throughput, non-invasive identification of diseases and plant chemical content. Such advances could allow more in depth analysis of crops in the field. Hyperspectral cameras could also be used to identify disease in the pre-symptomatic phase, allowing for pre-emptive spraying (Mahlein Reference Mahlein2016). N-status could be quantified across a field to allow for more selective N application. Hyperspectral cameras could also be used to identify soil traits such as texture, compaction, and nutrient status, allowing farmers to monitor the health of their soil year to year and change their treatment strategies accordingly.
Other technologies will also enhance the effectiveness of remote sensing. LiDAR (Light Detection and Ranging) is already being used to provide improved plant height measurements, and more detailed data on the crop canopy than traditional digital and multispectral cameras can supply. Used in conjunction, digital, multispectral and LiDAR technology could provide a very effective overall view of the whole crop canopy structure, including weeds present below the crop canopy (Zhang and Grift Reference Zhang and Grift2012; Andújar et al., Reference Andújar, Rueda-Ayala, Moreno, Rosell-Polo, Escolá, Valero, Gerhards, Fernández-Quintanilla, Dorado and Griepentrog2013). Using the same process that identifies plant height it is also possible to identify the height variance across a set area. This is of particularly useful in breeding as it aids in the identification of segregation or purity within a plot.
Thermal cameras are very effective tool for identifying the presence and absence of diseases and crop stress (particularly drought) (Li et al., Reference Li, Zhang and Huang2014) . These traits would be of particular interest to farmers, agronomists and researchers trying to identify drought tolerant or disease resistant varieties. At present, the deployment of thermal cameras for PA has been delayed by the size and cooling requirement of the sensor. As a result, few high resolution thermal cameras are capable of being mounted on UAVs, although some are being mounted on MAVs and ground-based tools. At the current speed of technological advancement it will not be long before these cameras are available for UAVs. The second major obstacle is the time required to collect data from fields or trials. To capture data with a thermal camera mounted on a UAV for a >1 ha field can take more than 15 minutes between the acquisition of the first image and the last. During this time, especially in the UK, weather conditions can change over the field. A breeze can blow through the crop or a cloud can pass over. Both these events can drop the temperature of the crop by 1°C or more which can sometimes mask the higher temperature of the parts of the crop that are under stress. This is a particular problem when stitching the numerous captured images together to form an overview of the whole field during post-flight processing. As this requires two neighbouring images to overlap the plants that appear in both images must be of the same temperature. If a breeze is blowing through the crop during the second image and not the first then it will be very difficult to overlap the images.
Potential future uses of remote sensing technology
The application of current agricultural remote sensing technologies is particularly focused on providing decision support to the farming sector. In research these technologies are used to reduce labour by capturing traits that can be identified by eye. With the potential advancements, there is the possibility that these tools could identify traits not visible to the human eye. It is feasible, with current hyperspectral technology, that a researcher could develop a tool for identifying a specific trait or chemical present within the crop. In some cases this research will not be of direct benefit to the agricultural community but could still contribute to advancement in agricultural practices. Take for examples the study by Sahoo et al. (Reference Sahoo, Ray and Manjunath2015), where hyperspectral technology was used to separate out 70 different wheat genotypes within a field. This is of little benefit to farmers who have reasonably homogenous fields containing one or two varieties. For research into breeding it is particularly useful. The NIAB MAGIC population (Mackay et al., Reference Mackay, Bansept-Basler, Barber, Bentley, Cockram, Gosman, Greenland, Horsnell, Howells, O’Sullivan, Rose and Howell2014) consists of 1000+ lines which require purity analysis by field walking and genomics each generation. By applying an approach similar to (Sahoo et al., Reference Sahoo, Ray and Manjunath2015) it would be possible to identify any contaminated lines with only a couple of flights. This shows that not all remote sensing research should be focused on the development of practical tools for agriculture.
In a similar vein, new remote sensing tools can be developed that will primarily be of benefit to farmers and will be of little benefit to researchers. For example, it is possible to track the movement of workers within the field, a useful method for tracking productivity during harvest periods. Remote sensing technology can also be deployed by growers as a means of compliance with certain regulations. Monitoring of farmed area via satellite images is already being applied in Poland to ensure compliance with the Good Agricultural and Environmental Conditions aspect of the Single Area Payment from the Common Agricultural Policy (Pluto-Kossakowska et al., Reference Pluto-Kossakowska, Osińska-Skotak, Fijałkowska and Chmiel2013).
At present we are on the brink of wide scale deployment of the next generation of remote sensing technologies. This brings with it numerous opportunities but means we must also consider how remote sensing is applied to agriculture. PA providers will have to start considering the niches within the agricultural market as the technology with the ability to meet the differing needs of farmers, agronomist, regulators and researcher becomes available. There will always be some tools that will be applicable to all aspects of agriculture but tools specific to certain niches within the market will have to be developed if we are to move forward.
Decision Support Tools
As sensor technologies develop the amount of data provided will increase drastically. Even with current senor technology there are still concerns over the Big Data problems. These can vary from ownership of the data, to quality verses quantity of the data and how metadata is incorporated. For most end users it is not feasible to handle the data directly from the sensor. As a result the use of Decision Support Tools (DST) has become more appealing. In agriculture numerous DSTs have been used for many decades with varying success. Rose et al. (2016) define an agricultural DST as “an information source” but in the context of remote sensing a DST is software that can take data from a sensor and combine it with other information (soil data, weather data, other sensor data, yield data) to provide support on major agricultural decisions throughout the season. Seed rates and variable rate fertiliser applications are the most common examples of this but DST can also be used to assist in variable rate pesticide application and timing of spraying. What most DSTs currently lack is the ability to incorporate historic sensor data. This information combined with historic weather, yield mapping, fertiliser application, soil quality and pesticide application data to provide a field-by-field performance map. This would allow farmers to perform long term precision agricultural planning for fields, not just in-season PA. It is also feasible to imagine chemical companies being able to move towards a field-by-field ‘prescription’ agriculture approach, instead of a blanket spray or prophylactic approach.
Rose et al. (2016) performed an extensive survey into the needs/desires of farmers with regard to DST. A 15 point plan was produced outlining what farmers desired from a DST. These points range from the privacy of data once it is uploaded to a DST to the simplicity of the software. The survey also looked at factors affecting the uptake of DST (age, education) and why previous DSTs have failed in the past (became overly complicated, lacked updates). Such information should be a valuable resource to DST developers.
Conclusion
Current remote sensing technologies, such as multispectral cameras, provide useful agronomic information to both researchers and the end users of PA. Such technologies are readily available and can easily be provided by numerous commercial firms or developed within academic institutions. As the next generation of sensors become more readily available it is feasible to imagine a diversification of the tools provided by remote sensing to suit the needs of the end user, such as a tool to identify a specific chemical within a plant for researchers or tools for compliance with regulations for farmers. Whilst these two lines of development may not be directly applicable to each other they will both be of benefit to agriculture as a whole. How the data provided by these new tools will be delivered to the end user will also need to be developed. In most current cases DST focus on providing assistance for the current growing season. In the future it would be best if historic data could be combined with current data to allow farmers to plan for the long term health and productivity of their fields.
Acknowledgements
BBSRC, KWS, RAGT, Limagrain and Elsoms funding for the GplusE project started in February 2015.