


Introduction
Health inequality forms a crucial strand of inquiry for scholars of population and public health and a rich literature has emerged over the past 50 years.Footnote 1 Urban living, socio-economic advantage and their impact on life expectancy are central to both modern and historic analyses and this study adopts such methods. Taking registered infant deaths pre-1900 and mapping them to Dublin city permits an examination of how urban life influenced health outcomes for children in lower socio-economic groups and a discussion of the prevailing public health threats. Infant mortality rates (IMR) gained credence as a reliable national wealth indicator during the nineteenth century and by the 1890s it was viewed ‘as the most sensitive test of the health of a given population’.Footnote 2 Although instruments for measuring infant mortality varied and national infrastructures for gathering statistics were uneven and unreliable, Table 1 shows that Europe had a serious problem at the turn of the century. But belying Ireland's appearance of a relatively healthy state were very high rates of urban IMR, especially in the ‘old-world’ city of Dublin, where high-density inner-city living was common and municipal and social change was slower than in other cities in the United Kingdom.Footnote 3
Infant mortality per 1,000 births, 1896–1905

Source: Public Health and Social Conditions, 1909 [Cd 4671], 15; Ireland's data from W.E. Vaughan and A.J. Fitzpatrick, Irish Historical Statistics, Population, 1821–1971 (Dublin, 1978), 244–5; full references for the Irish ARRG from 1864 to 1910 are provided in the Appendix.
Historic vital registration data is of ‘varying reliability’ and does not lend itself readily to analysis but that should not be a deterrent to scholars; we argue that it is still a worthy challenge.Footnote 4 Like several other scholars, we view vital statistics as indicative and it is not our intention to provide any form of correction to the accuracy of these data; rather, it is to use them to analyse cause, place and age at death. For instance, Irvine Loudon, in his comprehensive study of maternal and infant mortality, takes international mortality returns at face value.Footnote 5 It is important to acknowledge that civil registration returns are deficient in international terms. They are inaccurate for Dublin from 1864 to 1879 and well into the twentieth century in some rural areas. Despite their shortcomings, these data have the potential to reveal far more about the localization or indeed ghettoization of public health problems in Dublin than has been acknowledged to date. After 1879, they are far more accurate for a variety of reasons: infant life protection became an area of increasing concern in the era we examine and Dublin was subject to intense surveillance from the Dublin Metropolitan Police, the medical authorities, clergy of all denominations, health visitors, public health nurses (from 1876) and at community and kinship level. Furthermore, we point to the comprehensive maternity services in Dublin and the high rate of births in institutions, which were more likely to be registered than those without. Registered births were more likely to be followed by registered deaths.
Official statistics provided in Table 1 gives the impression that Ireland had a low IMR. Table 1 also highlights that compared to cities in England and Wales Dublin fared badly. With a low industrial base and a struggling, largely agrarian, economy the urban/rural disparity in IMR for Ireland was remarkable. In the next section, we make the case for the study of metropolitan Dublin by tracing its socio-economic and political development, which gave rise to an inner-city population that was overwhelmingly working class. In 1910, when returns were more complete, the overall reported Irish IMR was 94.6 per 1,000 of registered live births: 123.1 per 1,000 for towns over 10,000 people and 75.5 per 1,000 in remaining areas.Footnote 6 Thomas Wrigley Grimshaw, registrar general of Ireland (1879–1900), found in 1889 that Dublin's average infant mortality rate for 1879–88 was 184 per 1,000 live births compared to 149 for Belfast, 152 for London, 177 for Manchester and 180 for Liverpool.Footnote 7 In starker terms, infant mortality in Dublin city, according to our research on original death registers, ranged from 13 to 20 per cent of registered live births. Unemployment and underemployment cannot account for the high rates; IMR in ‘mining and industrial counties’ in Britain were also elevated, which suggests that insidious disease and poor sanitation factors were at play.Footnote 8 Luckin and Mooney contend that London's ‘epidemiological record. . .was significantly less traumatic than common sense might initially suggest’ because of early interventions like sewerage works and suburbanization, which caused a mortality decline.Footnote 9 Virulent disease and poor sanitation can explain most infant deaths discussed here but general living conditions (the so-called ‘urban penalty’), undernourished mothers and the resulting low birth weights undoubtedly contributed to Dublin's elevated IMR.Footnote 10 Unfortunately, the anthropometrical evidence to advance such assertions is lacking.
Studies to date of the history of mortality in Dublin have relied exclusively on aggregate returns, which do not provide breakdowns to registration district level until 1911.Footnote 11 Aggregate returns were published in the form of the Annual Reports of the Registrar General (ARRG) from 1864 and they provided details of vital registration and marriages to Superintendent Registrar District (SRD) level. We created a dataset from a sample of pre-1900 original registers (upon which the aggregate statistics are based) so we could adopt a combination of demographic, urban and social history approaches to isolate and examine trends in Dublin city's high IMR.Footnote 12 Civil registration data have their idiosyncrasies and none more so than those gathered in an erstwhile capital; in our methodology section we describe the records and how we chose to capture and analyse them. In the following sections, we provide a detailed analysis of infant mortality per district for three pre-census years (1870, 1880 and 1890), which permits us to map the precise location of deaths, and conduct an informed discussion of the purported causes of the high IMR in Dublin. Our concluding section offers a summary of our findings and suggests further research avenues. Underpinned by a robust disaggregated dataset, this article challenges popular geospatial perceptions about social and health inequalities in what are colloquially known as ‘the Northside’ and ‘the Southside’.
Dear, dirty DublinFootnote 13
Thus, James Joyce personified Dublin in 1907. In a little over a century, it had suffered a dramatic fall from grace, having lost its status as one of the most important cities of the British empire. As a capital city, it had prospered during the eighteenth century and an unprecedented level of housing development occurred on both sides of the Liffey but it was to cater for wealthier tenants. The development of two estates formed the basis of the property boom, the Gardiner estate in the city's Northside and Fitzwilliam to the south. The former was developed into rows of townhouses forming streets like Sackville (now O'Connell), Henrietta and Gardiner and squares like Rutland (now Parnell) and Mountjoy.Footnote 14 According to Christine Casey, the construction of Kildare House (now the Oireachtas, the Houses of Irish Parliament) in the 1740s provided the impetus for the Southside development.Footnote 15 Merrion and Fitzwilliam squares were constructed to create new and fashionable places for the rising mercantile classes to reside. These housing developments were helped in no small part by the formation of the Wide and Convenient Streets Commission in 1757, which paved the way for urban planning, and made some enduring choices about the connectivity of the city. Corruption was inevitable, and Rob Goodbody contends that the lines between the Commission and Luke Gardiner's development of the Northside blurred.Footnote 16 Simultaneously, major infrastructural developments were underway. The Grand Canal, which linked Dublin with the Shannon in the west, was constructed between 1756 and 1804Footnote 17 and the Royal Canal construction commenced in the 1790s.Footnote 18 The foundations of the North and South Circular Roads were enabled initially by an act in 1763 and further legislation facilitated the laying of the route and its subsequent extensions.Footnote 19
Dublin was an important industrial and commercial base, and the city prospered until the Act of Union in 1800 shifted political power from Dublin to Westminster.Footnote 20 Alvin Jackson argues that the act was ‘incomplete’ and gave rise to ‘the ambiguous nature of the island's constitutional position’.Footnote 21 The act served to alter the city's social composition completely as elite rate-paying families relocated to London or the Dublin suburbs. Despite evidence of Irish economic convergence, or catch-up, in relation to the rest of the United Kingdom, during the nineteenth century, other factors mitigated against Dublin's fortunes.Footnote 22 Wider economic pressures associated with the Napoleonic Wars and later laissez-faire economics had serious implications for the fate of the city, which was gradually overtaken by Belfast during the nineteenth century in commercial and industrial terms.Footnote 23 Dublin's import/export trade declined to such an extent that the Custom House in the Northside fell into a state of disrepair. According to Dickson, by the 1830s Dame Street and College Green contained most of the city's financial, stockbroking, insurance and solicitors firms.Footnote 24 The lure of tax and nuisance avoidance caused the middle classes to seep into the suburban townships both north and south of the Liffey. Those to the south enjoyed natural proximity to the new centres of business and commerce – Pembroke (established in 1867), Rathmines (established in 1847)Footnote 25 and Rathgar – and quickly earned the cachet of being more exclusive than the Northside equivalents of Clontarf and Howth.Footnote 26 Fixed-rail tram development of 11 routes in the 1870s allowed swift access from the wealtheir southern suburbs to the city; only two Northside lines (connecting Glasnevin, Drumcondra and Clontarf) emerged.Footnote 27
Christine Casey aligns the rise of inner-city tenement living to the more general and rapid ‘economic decline’ in the second half of the nineteenth century. She traces the vacation of the large Georgian houses at Summerhill in the Northside to the mid-1840s and their repurposing as tenements to 1868. She describes Summerhill and Gloucester Street (behind Trinity College Dublin) on the Southside as ‘solidly tenement’ by 1900.Footnote 28
The remit of Dublin CorporationFootnote 29 was first outlined in 1759 and the metropolitan boundaries were redefined in 1861 using the North and South Circular Roads and the Royal and Grand Canals as markers.Footnote 30 Containing a total area of 3,808Footnote 31 acres, a municipal population of 249,733 in 1861 and relatively no new building projects, overcrowding in the, by then, dilapidated Georgian townhouses was endemic.Footnote 32 It should be noted that this limited space was also shared by slaughterhouses (104 in 1879, reduced to 56 by 1900),Footnote 33 cattle markets and smoke emissions from various factories.Footnote 34 Dublin Corporation's solvency was called into question in the late 1870s and a municipal boundary commission was held to consider the ways in which wealthier outlying townships could contribute to municipal rates for services from which their populations undoubtedly benefited. The report, published in 1881, presented damning statistics about condemned housing stock and diseased meat confiscated by sanitation officers. Among its striking statistics was the fact that while the municipal area housed 65 persons per acre, the townships of Rathmines and Pembroke housed 14 and 15 respectively.Footnote 35 In 1877, the commissioners of both townships joined forces to secure permission by statute to develop separate water and sanitation networks.Footnote 36 What ensued was not a successful endeavour but their actions bolstered arguments to keep certain rates separate until consolidation occurred under the Local Government Act of 1898.Footnote 37
The city and the outlying townships were dependent on the Royal Canal for its water supply from 1777 and the burden was shared with the Grand Canal after 1809 and, as Dickson states, it was a politically charged matter.Footnote 38 Major progress in terms of public health was made through the Vartry Water works scheme, which provided clean and high-pressured water to the city from 1863,Footnote 39 but despite the best efforts of Charles A. Cameron, Dublin's tireless medical officer for health (he held various offices from 1862 to 1921), a matching comprehensive sewerage scheme did not materialize until 1906.Footnote 40 The Vartry scheme caused pipes to burst and, coupled with an arcane public sewer system, Dublin had to deal with problems associated with the saturation of subsoil.Footnote 41 Ó Gráda cites various reasons for the inevitable public health problems: the corporation's membership was heavy with tenement owners, and their general refusal to pay higher rates meant there was no money to implement new schemes. Further to these internal problems, central government refused to pay for municipal development, which delayed improvements to water quality and caused the failure to implement proper waste disposal until the early twentieth century.Footnote 42 By 1900, ‘dear, dirty Dublin's’ tenements were deemed to be among the worst in Europe and it is little wonder that infant mortality was higher there than elsewhere in the United Kingdom.Footnote 43 The 1911 census noted how 20,564 families lived in 5,322 one-roomed tenements and ‘the deprivation of the underclass was revealed in 1913 as never before, but with a new focus on the north side’.Footnote 44
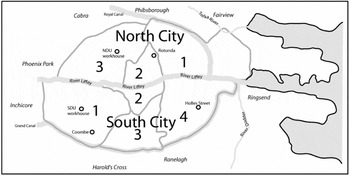
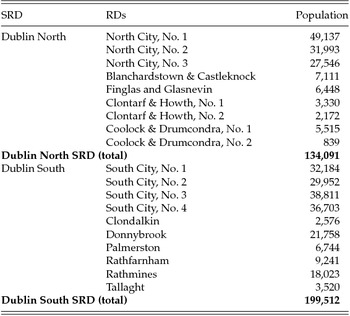
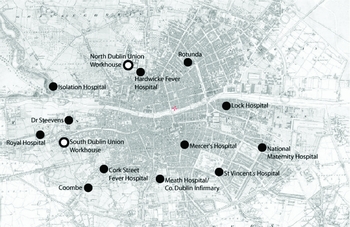
The 1863 Civil Registration Act divided Ireland into eight large ‘Divisions’, which were composed of Superintendent Registrar Districts (SRDs) and these aligned to the Poor Law Unions (PLUs) set out initially in 1838. We have explained the architecture of the General Register Office (GRO) in greater detail elsewhere,Footnote 45 but re-emphasize here that grafting Irish civil registration to the Poor Law in 1864 was perhaps ill advised given the recent history of the Great Famine and deprivation.Footnote 46 The district registrars were the local dispensary doctors, whose clinical practices formed part of the local PLU dispensary system. The links between the PLU and the GRO had implications for informants of all classes especially until the Public Health Acts of 1878 and 1879.Footnote 47 Dublin city was covered by two SRDs, Dublin North and Dublin South, but both encompassed extensive rural areas also. The SRDs were further sub-divided into registrars’ districts (RDs), which were based on PLU dispensary districts – Dublin North SRD was initially divided into 9 RDs, while Dublin South SRD contained 10. 7 of these 19 RDs were within the canals and the circular roads – Dublin North 1, 2 and 3, and Dublin South 1, 2, 3 and 4 (see Figure 1) – thus excluding the relatively wealthy suburbs of Rathmines and Pembroke from the taxation net. In population terms, both SRDs were primarily urban; the proportion of urban-dwellers in Dublin North SRD's three urban RDs were 81 per cent, 80.7 per cent and 78.5 per cent in 1870, 1880 and 1890 respectively, while the equivalent rates for Dublin South SRD's four urban RDs were 69 per cent, 66.4 per cent and 68.3 per cent.Footnote 48 The administrative ordering within the two central Dublin SRDs in 1870 is shown in Table 2.
Map of Dublin city and metropolitan RDs

RDs in Dublin North and Dublin South SRDs, 1871

Source: Eighth annual ARRG, 1871, 56.
Methodology
Each year, the registrar general's office published aggregate death statistics in the ARRG, where the deaths by sex of all children under one year of age are available for all years from 1864, at national, division, SRD, province and county level. This is not sufficiently disaggregated to conduct a study of IMR so we compiled a database to register district level from the original death register returns of all infant deaths occurring in the metropolitan area of Dublin in 1870, 1880 and 1890 (hereafter cited as GRO dataset). Fortunately, the historic definition of IMR is coterminous with the current definition of the probability of death for an infant aged under one year per 1,000 live births.Footnote 49 We remained true to the original data and did not ‘correct’ errors. For each death, 11 discrete items of information were sought from the informant; though we captured all items, our main interests were the categories of ‘age last birthday’, ‘place of death’ and ‘cause of death’. Historic age data recording is problematic and it is widely accepted that in census forms it was notoriously inaccurate. No direct financial benefit accrued from falsifying ages on a census form (until after the introduction of the Old Age Pensions Act in January 1909) but for GRO entries late registration penalties could be avoided if false information regarding dates of birth or death were given.Footnote 50 Therefore, allowances must be made for the fact that calculations for the duration of infant life are slightly inaccurate.
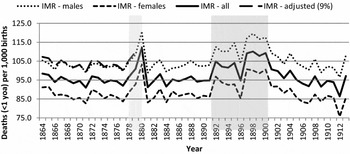
This study focuses on registered deaths but we acknowledge that underregistration of life events in infancy is something to be mindful of. The reliability of Irish civil registration data has been called into question by a number of scholars. Jacques Verrière, citing the ARRGs, points to the 1860s as a problematic period for estimations of infant mortality. He uses census returns to argue that births and infant deaths were underestimated for Connaught (a largely rural province in the West of Ireland) up until 1911.Footnote 51 He makes valiant attempts to adjust national figures using the decennial census and emigration returns and had mixed results, but it should be noted that both of his adjusting datasets were themselves incomplete. We do not attempt to make any form of adjustment using census or other data and reiterate the fact that death registration in Dublin improved significantly after the passage of the 1878 Public Health Act, which required the registrar of Burial Boards to provide written details of burials to the GRO.Footnote 52 Subsequently, the registrar general, Thomas Wrigley Grimshaw, used the burial lists to ‘correct’ the underreporting of deaths in Dublin city, a discrepancy that he calculated as being at 9 per cent.Footnote 53 Figure 2 shows the national rate from 1864 to 1913, the gendered breakdown and, incorporating Grimshaw's estimate, a further line showing what the national rate would look like were an adjustment of 9 per cent made for the period between 1864 and 1879.Footnote 54 Matters improved for Dublin after 1879 but outside the metropolis, as Dean and Mulvihill have shown, underreporting remained an issue a century later in elderly cohorts. The number of deaths which were registered but not certified by a doctor remained high. They found that Connaught ‘consistently returned the highest proportion of uncertified deaths’ and that counties Leitrim, Mayo, Kerry, Donegal, Galway, Longford and Roscommon had the highest number of uncertified deaths in 1968.Footnote 55 Dean and Mulvihill argue that the prevalence of uncertified deaths was closely associated with lower income status where proof of death was not requisite for succession, inheritance or insurance purposes. Like Grimshaw, a century earlier, they used burial lists (acquired from the parish priest in Ballyhaunis for 1966–69) and traced a sample of 337 burials to civil registration records to ascertain the proportion of registered but certified deaths (87 per cent), registered but not certified (4.3) and found that 8.7 per cent were not registered at all. A wider sample using 19 Roman Catholic and 3 Church of Ireland parishes was constructed and similar patterns emerged. It found that the majority, or 79 per cent, of the registered but uncertified deaths pertained to elderly people over the age of 80.Footnote 56 But it is important to stress that in all of these studies, infant and child cohorts were not identified as problem groups.
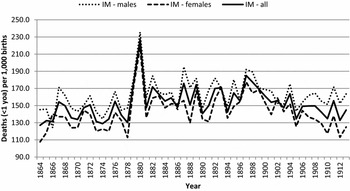
National IMR (per 1,000 births), 1864–1913

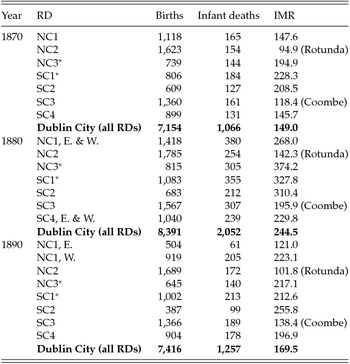
To examine infant mortality at RD level, we identified the deaths of all children whose ages were recorded as under one year old in the urban parts of Dublin North and Dublin South SRDs in the GRO records for the three years under scrutiny. This identified 1,066 infant deaths in Dublin's urban RDs in 1870, 2,052 in 1880 and 1,257 in 1890 – 4,375 infant deaths in all (Table 3). Irvine Loudon has advised that local studies are ‘more valuable’ when examining the effects of unemployment and deprivation on IMR.Footnote 57 Cormac Ó Gráda has used the 1911 census and the ARRG (which by then was more detailed) to conduct an analysis of IMR in the Dublin suburb of Pembroke and found occupational status and religion to be significant variables for his analysis.Footnote 58 As informant occupational status is inconsistently captured in the death registers, it cannot be included here, thus a correlation between employment status and IMR is not possible.
Births and deaths: Dublin's RDs

Note: * Workhouse location.
Source: ARRG, 1870, 1880, 1890, and GRO dataset.
We transcribed the data into a database, which permits a more careful study of age at death and a segregation of neonatal, up to one month of age, from post-neonatal deaths, occurring between 1 and 12 months. As econometric studies show, the latter deaths raise several other research questions about prevailing socio-economic conditions and, in the Irish case, the low returns of pervasive disease like tuberculosis are suspicious.Footnote 59 The GRO dataset also permits a cross reference of location of death with cause of death, thereby permitting new insights into risk factors for Dublin's urban poor, to street level in some instances.
Further to decennial, age cohort and locational hierarchies we rearranged the data in accordance with the prevailing nosographical guidelines. William Farr's Statistical Nosology, published by the English GRO in 1845 to standardize cause of death reporting, was reproduced verbatim and circulated to every registrar, medical practitioner and coroner in Ireland in 1864.Footnote 60 It classified 145 fatal diseases into three principal classes: zymotic diseases, sporadic diseases of uncertain or variable ‘seat’, and sporadic diseases of special systems and organs (see Table 6), in the case of infants, cause of death reporting did not change during our timeframe.Footnote 61 GRO register data contain rich detail organized chronologically by quarter: but when rearranged by region and cause of death some very interesting urban patterns emerge. Tables 7–13 present the data per individual year and in total for the three sample years; we ‘pooled’ the figures for 1870, 1880 and 1890 to facilitate a more general discussion of our focus: the cause of infant death.Footnote 62
Irish IMR, 1864–1913
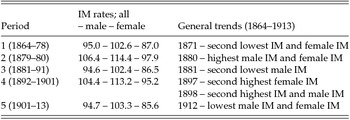
Figure 2 shows the registered IMR for Ireland, 1864–1913, and two obvious peaks occur. The first of these was the two-year period 1879–80 when the IMR exceeded the rate recorded since 1864 (during this period the level of non-conformance with the law was higher). The second period of elevated infant mortality was more prolonged and in an era when mortality recording was more complete. In the decade between 1892 and 1901, the IMR exceeded 100 per 1,000 live births in all years except in 1896 when the rate dropped to 94.8.
Five distinct periods are evident in Irish infant mortality trends during the first 50 years of registration. These periods are synopsized in Table 4, and offer a template against which our sample years for infant mortality in Dublin can be contextualized.
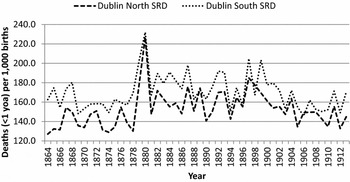
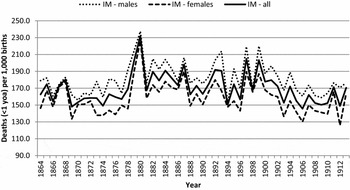
The IMR shown in Figure 2 and Table 3 may not seem excessive when Russia's 10 year average of 268 (1892–1901) is considered (see Table 1), but regional variations need to be taken into consideration. Ireland's average mortality rate for the half century between 1864 and 1913 was a relatively modest 97.0 deaths per 1,000 live births, but when Dublin city figures are isolated some unusual, if predictable, patterns emerge. The trend for IMR within the urban areas of the Dublin's SRDs (Figures 3, 4 and 5) are similar to those recorded at the national level (Figure 2) but the rates, determined from the number of births recorded within each SRD, ran at a higher level. In Dublin North, the official IMR was 153.0 for the period 1864–1913, and in Dublin South SRD, it was higher again, at 170.4, almost double the national rate (Figure 3). Clearly evident in the Dublin SRDs mortality statistics is the 1879–80 national crisis following three summers of bad weather and successive failed harvests. In 1880, the reported IMR in both SRDs reached all-time peaks of 227.1 per 1,000 live births in Dublin North SRD and 232.0 in Dublin South SRD. What is most compelling is the scale of the difference between the national and urban rates. Even when the urban IMR were lowest they still exceeded the disastrous national rate reported for 1880.
IMR, Dublin North and Dublin South SRDs, 1864–1913

IMR (per 1,000 births), Dublin North SRD, 1864–1907

IMR (per 1,000 births), Dublin South SRD, 1864–1907

The first notable element in the Dublin rates is that infant mortality was consistently higher in Dublin South SRD than in Dublin North (see Figure 3). In 47 of the 50 years between 1864 and 1913 the infant mortality rate in Dublin South exceeded the northern rate, often by significant margins, and in 12 of those years the differential exceeded 25 deaths per 1,000 live births. The greatest differential was in 1865, when 132.4 deaths per 1,000 live births occurred in Dublin North, compared with 174.4 in Dublin South. Only in the years 1889, 1898 and 1906 did infant mortality north of the Liffey exceed the Dublin South rate, and in each case the difference was small.
Another feature of the national infant mortality data is that the male exceeded the female rate by a noticeable margin; the former was 105.1 per 1,000 live male births and the latter was 88.5 per 1,000 female live births in the period 1864–1913 (Figure 2). The pattern of excess male infant deaths over female was consistent in the first five decades of civil registration, and is in keeping with Drevenstedt et al.’s findings.Footnote 63
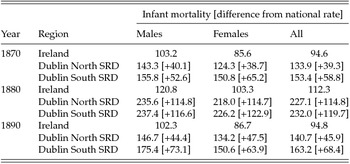
These sex differentials held in Dublin city, too. For the period 1864–1913 in Dublin North the male rate was 162.7 per 1,000 live male births, compared to a female rate of 142.8, and in Dublin South the levels were even higher, at 181.6 for males against 158.6 for females. During 1880, the crisis year, the male IMR in both SRDs exceeded 235 per 1,000 live male births (meaning that almost one in four male babies died) and the female rate was not far behind, at 218.0 in Dublin North, and 226.2 south of the river (see Table 5). Urban Dublin was clearly a very dangerous place for infants in the period 1864–1913.
National IMR, 1864–1907

Source: ARRG, 1864–1913.
GRO dataset
The three pre-census years (1870, 1880 and 1890) used here fall neatly within the first three phases of national infant mortality trends outlined in Table 4 and their integration with census data may offer future research potentials. The dispersion of the IMR across the RDs is illustrated in Table 3. This shows the number of births recorded in the GRO dataset in each urban RD, extracted from the ARRGs, and the number of infant deaths in each RD, extracted from the individual GRO entries. From these, the IMR per RD can be calculated for each sample year.
IMR Ireland, Dublin North and Dublin South SRDs

Source: Seventh ARRG, 1870, 96–7; Seventeenth ARRG, 1880, 96–7; Twenty-seventh ARRG, 1890, 130–1.
North City, No. 2 (NC2) district, bounded by the Liffey, roughly comprised an area that stretched north to the Rotunda Lying-in Hospital and west to the Hardwicke Fever hospital (see Figure 6) and it emerges as the RD with the lowest IMR, with rates ranging from 94.9 per 1,000 births in 1870, to 142.3 per 1,000 births during the crisis year of 1880. South City No. 3 (SC3), the location of the Coombe Hospital, was the RD with the second lowest IMR in 1870 and 1880. In 1900, the registrar general observed that South City No. 1 (SC1) SC1, SC2 and NC2 were areas of higher overall mortality ‘for Dublin as a whole’ and pointed to phthisis as the main cause.Footnote 64 We caution that particular care must be taken for RDs containing large public residential institutions as they can distort birth and death rates. Furthermore, vital events were more likely to be recorded if they occurred in a public institution. Luckin and Mooney note how failure to reallocate deaths to ‘normal place of residence’ caused distortion in their study of London.Footnote 65 Similar distortions occur in Dublin, for instance, IMR in SC3 and NC2 are depressed by an excess of births recorded in the two RDs born to non-residents. It stands to reason that the RD containing the Rotunda (where the majority were in-patients, which, in the absence of puerperal fever, was a safer birthing and neonatal environment) would have a lower IMR than that of the Coombe (where the majority were out-patients). In the year ending 31 March 1871, more than 8 in 10 of all patients attending the Rotunda were in-patients, but more than 7 out of 10 of the Coombe's patients were out-patients.Footnote 66 By 1880, the Rotunda was operating a comprehensive external maternity service and it tended to 997 domiciliary cases as against 1,369 admissions to the Lying-in Hospital.Footnote 67 If the IMR relative to the birth rate in these two RDs (especially in NC2) were artificially reduced by virtue of non-resident women coming in to give birth, then the IMR in the mother's RD of origin were consequently increased. Thus, the IMR of 228.3 in SC1 in 1870, 374.2 in NC3, in 1880 and 255.8 in SC2 in 1890 were, likely, somewhat above the real rate. Nonetheless, the highest mortality rates in 1870 and 1880 were in the RDs that contained the North Dublin and South Dublin Union (SDU) workhouses. Sisters of Mercy oversaw nursing and the nursery at SDU workhouse from 1881.Footnote 68 By 1894, the North Dublin Union (NDU) was also taken over by ‘nursing nuns’, which may have provided a certain degree of indemnification from bad publicity.Footnote 69 Spikes in the IMR could not be ignored and newspapers periodically published articles on them. For instance, in the NDU workhouse ‘wasting due to tubercular and other diseases, improper feeding and ill treatment before admission’ were blamed for the total of 487 deaths in children under two from 1895 to 1900.Footnote 70 The Freeman's Journal criticized the overcrowding of the flimsy NDU nursery, which was a wooden building constructed on a former burial ground that had recently had a rat infestation, as the main factors in its elevated IMR in October 1904.Footnote 71 In August 1905, the Irish Times reported a possible disease outbreak in the SDU nursery where 15 of the resident 58 infants died the previous month.Footnote 72
Public institutions, Dublin, 1870–1890

Reading the GRO dataset through Farr's Statistical Nosology
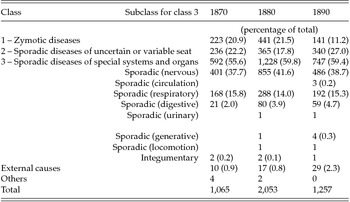
Where possible, we distributed the recorded causes of death for the infants across Farr's classifications, and applied the recommended names to diseases, if ‘synonymes’ or colloquial names were recorded. Our rationale for doing so was to correlate cause, place and age at death in order to find possible epidemiological patterns. The GRO data are challenging: often more than one cause of death is recorded; in such instances, we used the recommended approach for medical certificates and viewed the first listed as the primary disease.Footnote 73 For instance, ‘convulsions and bronchitis’ was entered as convulsions (disease of nervous system), but ‘bronchitis and convulsions’ was entered as bronchitis (disease of respiratory organs), and so on. A second challenge concerned the categorization of unspecific causes of death. ‘Disease of chest’, for example, was likely a respiratory illness, but the actual disease cannot be identified. In cases like this, we could only classify the death according to Farr's general classes. The distribution of deaths amongst Farr's mortality classes is shown in Table 6.
Dublin: urban RD deaths, by ‘class’ of disease

Source: GRO dataset.
In all three years, class 3 diseases, ‘sporadic diseases of special systems and organs’, were the most common death classification for infants, accounting for over 50 per cent of all deaths in 1870, and three in five deaths in 1880 and 1890. Class 2 diseases, ‘sporadic diseases of uncertain or variable seat’, were the second largest classification for infant deaths in 1870 and 1890, causing between one fifth and one sixth of all infant deaths, but were replaced by ‘zymotic diseases’ during the crisis years of 1880. ‘Zymotic diseases’ caused one in five infant deaths in 1870 and 1880, but by 1890 they had fallen to just over one tenth. Diseases of the nervous system caused 4 in 10 deaths in the pooled sample, while respiratory diseases comprised about one sixth of infant deaths.
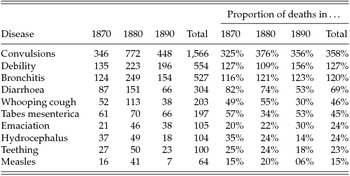
Table 7 shows the 10 most common causes of death among Dublin's infants in the three years under examination; each of these diseases accounted for more than 1.5 per cent of all aggregate infant deaths. The ‘nervous system’ subclass of ‘convulsions’ was disproportionately applied and was used as a ‘catch-all’ term when the precise illness was unknown. It may reflect limits to medical knowledge on the part of registrars but we draw attention to the fact that informants of deaths occurring outside clinical settings were not medically trained. In the case of uncertified deaths, informants described symptoms rather than diseases to the registrar, who in turn had to assign a cause of death. Certification improved over time; in 1870, 34.3 per cent of infant deaths were certified, but this rose to 47.3 per cent in 1880 and 66.2 per cent by 1890.Footnote 74 Convulsions, a symptom of any number of medical conditions, was a convenient way of categorizing uncertain causation. It may also have been an attempt on the part of registrars to exercise discretion and compassion towards very poor parents. Preston and Haines posit that dehydration arising from gastrointestinal illness was the most likely cause.Footnote 75 Our examination of coroners’ courts records show an array of conditions, from ‘congestion of the brain’ to whooping cough being translated in the death registers into more generic categories. Even heinous acts of violence were sanitized; for instance, in 1901, the mutilated body of a child was found in more than 200 pieces. It was ambiguously described in the GRO records as per the coroner's recommendation that there was ‘no evidence as to whether it was born alive or that mutilation was the cause of death’.Footnote 76
Principal causes of death

Source: GRO dataset.
Contemporary medical journals published articles voicing the increasing discomfort of doctors with using ‘catch-all’ terms, which obscured disease outbreaks. Change was not exacted for some decades and well after the fourth edition of the Nomenclature (which listed 1,211 causes of death) was published in 1906.Footnote 77 More than a third of all infant deaths in the three years (1,566 out of 4,375 total deaths; see Table 7) were recorded against convulsions. In 1870, 346 of the 1,065 recorded infant deaths 32.5 per cent were assigned to convulsions, and this proportion rose to 37.6 per cent (772 of 2,053 deaths) in 1880, and 35.6 per cent (448 of 1,257 deaths) in 1890. By contrast, Preston and Haines note that the equivalent rate in America (albeit with incomplete data) was about 5 per cent.Footnote 78
An equally ambiguous term, ‘debility’, was used with abandon; it caused 554 infant deaths or 12.7 per cent in the GRO dataset. Like convulsions, debility was a broad term ‘generally used to designate the unknown cause of the deaths occurring shortly after birth’.Footnote 79 Bronchitis came third, nudging ahead of debility, during the crisis year of 1880. The next causes of death diarrhoea, whooping cough, tabes mesenterica (here we include incidences of marasmus and cachexia as per the advice given in Farr's Nosology), teething and measles occur in lower numbers (Table 7).Footnote 80
An area of real concern for us is the limited expression of TB in infant cohorts; tabes mesenterica is a sinister form that attacks the lymphatic system, and can give rise to body wasting (termed marasmus in the registers). It was not fully recognized in infants until post mortem examinations became more commonplace, and indeed it may have caused convulsions when the body through inanition went into the final rigours of organ failure and death. We discuss elsewhere how latent TB was culpable in late maternal deaths using arguments put forward by Greta Jones, who claims that it was more than likely responsible for a higher proportion of stillbirths (which were unrecorded) and neonatal deaths than were reported.Footnote 81 It primarily affected lower socio-economic groups, which emphasizes the intrinsic links between economic status, environment and the everyday of life in Dublin's tenements.
Infant deaths in Dublin, 1870, 1880 and 1890 – variations by age
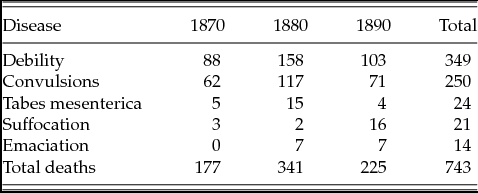
In the three years under examination, in aggregate terms, 743 children aged less than one week old died in Dublin's urban RDs (Table 8). Most of these deaths occurred in domestic settings. For example, of the 177 deaths recorded of children less than one week old in 1870 (Table 8) less than one third (51) occurred in institutions such as hospitals, workhouses or barracks. Although ‘convulsions’ was the most common cause of infant death in Dublin (Table 7), susceptibility to different diseases varied in accordance with life stage. Since debility was commonly employed to describe the death of children shortly after birth, it is unsurprising that it was the main cause of death of infants dying within one week of birth (47.0 per cent; 349 deaths; Table 8). ‘Convulsions’ was the second most common cause among infants less than one week old; it claimed 33.6 per cent or 250 lives. The lack of precision in cause of death reporting meant that the third most numerous, tabes mesenterica (including deaths from marasmus and cachexia), had merely 24 deaths assigned to it (3.2 per cent of all deaths; 21 of these deaths are recorded as cachexia and 3 as marasmus). Suffocation was another prominent cause of death: 21 deaths (2.8 per cent) in the under one week group, or two-thirds of the cases recorded in the GRO dataset. By contrast, bronchitis, the third most common cause of death of infants (Table 7) overall was assigned to two children less than one week old – one in 1870 and one in 1890.
Principal causes of death: infants under one week

Source: GRO dataset.
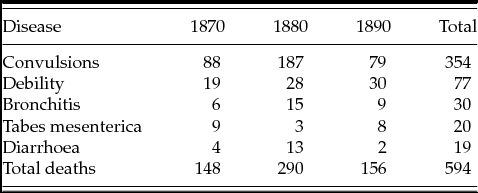
For children surviving the first week of life, a different range of diseases threatened. As Table 9 shows, there were 594 deaths of children in the age cohort between one week and one month over the three years. Debility, with only 77 deaths (13.0 per cent of total) assigned to it, was not as prominent a cause for infants aged between one week and one month, compared with 354 deaths (59.6 per cent) recorded against convulsions (Table 9). Digestive and respiratory diseases, rampant in Dublin's overcrowded tenement accommodation, affected these ‘later neonates’. The 30 deaths from bronchitis formed 5.1 per cent of all deaths occurring within this age group, and diarrhoea caused a further 19.
Principal causes of death: infants between one week and one month

Source: GRO dataset.
Children surviving into the post-neonatal period became increasingly susceptible to respiratory and digestive diseases as the rigours of life in Dublin's tenements strengthened its grasp, and mortality trends, which emerged during the latter parts of the neonatal period, continued during the remainder of the first year of life. As with the neonatal cohort, convulsions continued as the principal cause of death in the post-neonatal period, causing one third (962, or 31.7 per cent) of the 3,038 infant deaths within that age range (Table 10).Footnote 82 Two respiratory diseases, bronchitis and whooping cough, were the second and fourth main causes, together they caused almost a quarter of the total deaths. Tabes mesenterica remained a prime cause of infant death, but in fifth position for this age cohort.
Principal causes of death: infants between one month and one year

Source: GRO dataset.
Infant deaths GRO dataset – variations by location
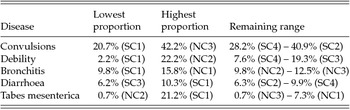
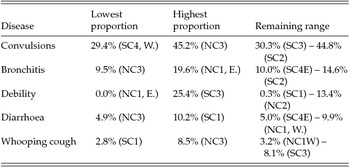
The aim of this research was to use original registers to disaggregate infant mortality returns and we have found some very distinctive variations in infant mortality trends by RD within Dublin city. Although we do recognize the strong possibilities of inaccurate or casual recording of cause of death rather than mortality variations by area (see Table 11), RDs emerge with characteristics that cannot be ignored. For example, the highest proportion of infant deaths (42.4 per cent) from convulsions in Dublin's RDs in 1870 was in NC3 a large area surrounding the NDU workhouse. Cause of death recording was undoubtedly influenced by the habits and discretion of registrars, for example, in North City, No. 3 Albert O. Speedy was a registrar of long-standing; he was the district's deputy registrar in 1870, and the registrar in 1880 and 1890. During this time, rapid advances were made in medical science with the move from miasma to germ theory but this was not reflected in Irish mortality reporting for some time.Footnote 83
Principal causes of infant deaths, 1870, by RD

Source: GRO dataset.
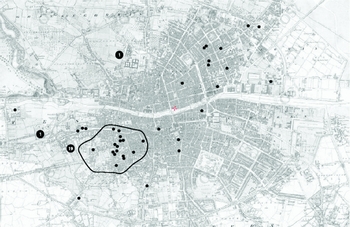
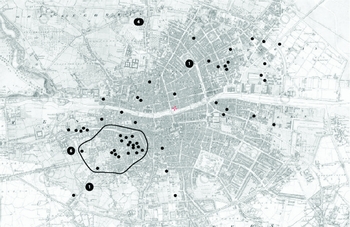
While Dublin's North City RDs were recording high rates, SC1 was reporting the lowest proportion of deaths of any of Dublin's RDs for three of the five main causes (convulsions, debility and bronchitis) in 1870, but the highest proportion of deaths for the other two (diarrhoea and tabes mesenterica); both were closely associated with poverty, unsanitary living conditions and poor hygiene. Nigel Morgan has made a strong case for studying the positioning of stables, horse manure and its association with flies and summer diarrhoea, but Dublin authorities claimed that ‘summer fever’ was not an issue.Footnote 84 With 39 of the city's 61 tabes mesenterica deaths and 13 of the 16 measles deaths being recorded in SC1, that district had a distinctive infant mortality profile in 1870. This profile was strongly influenced by the location of the workhouse. All 13 deaths from measles occurred between January and April of 1870, and all were of residents of the SDU workhouse, suggesting that once a contagious disease took hold in an institution it could wreak havoc among the vulnerable inhabitants. Conversely, it could also mean that that institution became the recourse for parents whose children were in the final rigours of the disease. Similarly, of the 39 deaths in SC1 caused by tabes mesenterica, 19 were of workhouse residents, and 11 of those occurred in the four months between January and April. Unfortunately, the SDU workhouse records have a very poor survival rate but our examination of the death register from 1910 shows a high rate of respiratory disease in all age cohorts. It is very likely that incidences of TB were masked through loosely classified respiratory disease. Of 103 infant deaths, for instance, 14 were caused by respiratory disease and 16 by tubercular diseases of various kinds.Footnote 85 In an adjacent area, colloquially named ‘The Liberties’, 16 other tabes mesenterica fatalities occurred. The Liberties is bounded by Thomas Street, Francis Street, Cork Street and Grand Canal Harbour (Figure 7), and despite the presence of major employers like Guinness's Brewery and the work carried out by Lord Iveagh to improve quality of life in the area, it was typified by squalid, overcrowded housing, poor sanitation and extreme poverty.Footnote 86
Tabes mesenterica deaths, Dublin city, 1870

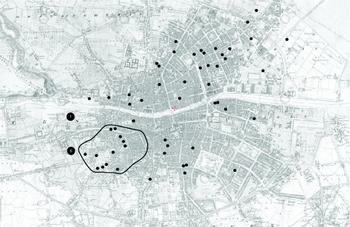
In 1880, the five principal causes of infant deaths mirrored those in 1870 (Table 11), except bronchitis caused more deaths than debility, and whooping cough replaced tabes mesenterica in fifth position (Table 12). Tabes mesenterica caused 70 infant deaths that year, but as in 1870, SC1 was overrepresented, with 38 deaths. The Liberties emerges as a problem area in the mortality figures, with 19 deaths falling within the broadly defined region (Figure 8). Deaths from tabes mesenterica were more widely scattered across the city than in 1870 with other poor areas to the north-east of the city, east of Sackville (now O'Connell) Street featuring.
Principal causes of infant deaths, 1880, by RD

Source: GRO dataset.
Tabes mesenterica deaths, Dublin city, 1880

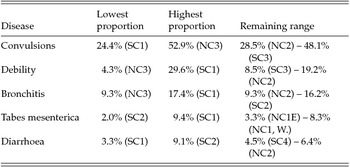
Table 13 shows that the five principal causes of infant deaths in Dublin in 1890 matched those of 1870 and 1880. Convulsions continued as the primary culprit, and in NC3 it caused more than half of all infant deaths compared to a quarter in SC1. At that stage, SC1 reported the lowest relative proportion of deaths from diarrhoea (3.3 per cent) which jars with what we know about the sanitary conditions of the area but it had the highest proportion of infant deaths from debility (29.6 per cent), bronchitis (17.4 per cent) and tabes mesenterica (9.4 per cent).
Principal causes of infant deaths, 1890, by RD

Source: GRO dataset.
Reports of tabes mesenterica deaths (Figure 9) were on the rise in The Liberties (12 deaths), but by 1890 this cause of death had become more prevalent throughout the city, particularly north of the river. In fact, with 28 deaths ascribed to it in non-institutional settings in north Dublin city, compared with 26 in the south of the city, 1890 was the only year of the three under study when tabes mesenterica deaths north of the river exceeded those to the south of it.
Tabes mesenterica deaths, Dublin city, 1890

Conclusion
We set out to analyse location and cause of infant death from original death registers and we contend that although the nosographical range of infantile diseases alters little in the timeframe under scrutiny there are several conclusions that can be drawn from this study. In the first instance, it is important to segregate national and civic regional figures. Shifting reliability of data notwithstanding, when compared to rural Ireland (where underreporting may have been more prevalent) and other UK cities, there is evidence over the entire period of an ‘urban penalty’ at play, which, with our data breakdown, can be localized to certain areas of the city, and, contrary to popular wisdom, the Southside RDs emerge as particularly disadvantaged. Contemporary observers cited poor water supply and inferior, overcrowded housing stock as the root causes of the problem and some efforts were made to ameliorate social conditions in the 1890s with various water improvement, nuisance removal and rehousing schemes.Footnote 87 Table 4 and Figure 2 show that marked improvements occurred in IMR after 1900 but Dublin's mortality decline was much later than in other cities of comparable size. Our study also shows that a separation of neonatal from post-neonatal deaths is essential in the examination of an urban IMR, particularly in areas containing lower socio-economic groups with patchy employment data. The dispersion of IMR in The Liberties stands in marked contrast with Ó Gráda's study of the wealthier suburb of Pembroke around 1911.Footnote 88
The ARRG do not draw attention to problematic RDs but from 1905 the newspapers often reported on the high levels of infant mortality in the Catholic-run PLU nurseries, which were in appalling states of repair. In as much as Ó Gráda and Mein Smith and Frost found peculiarities in suburbia, we found other dynamics at play in the high-density living quarters of Dublin's inner city.Footnote 89 Tabes mesenterica reporting increased gradually and expanded across the city in the period we examine, but we speculate that it is a potentially underrepresented category as TB among adults aged between 15 and 35 was very high. Its reporting emerges in spite of entrenched ideas surrounding cause of death, the dominance of miasma theory and ‘habitual’ citation of convulsions and debility. Jones cautions that we need to pay closer attention to the impact of TB in all its forms. Deaths assigned to convulsions were persistently high in the period we examine for the four week to one year cohort and the likelihood is that these deaths were associated with micro-epidemics such as TB and enteric fever, which were endemic in Dublin's tenements. It is neither wise nor entirely possible to engage in retrospective diagnosis but further research into late maternal mortality (after 42 days post-partum) and paternal mortality from infectious disease may help to shed light on the ambiguities of infant mortality causation and permit inferences at household level. The 1900 report on the health of Dublin city boasted that parasitic disease was insignificant yet the problematic RDs housed most of the city's horses and slaughterhouses. The truth was that the registrar general was relying on information that was classified conservatively. We conclude that diseases are notable by their absence in the returns pre-1900 and that is perhaps more telling about the state of health in urban Dublin.
Appendix A – Annual Reports of the Registrar General
First Annual Report of the Registrar-General of Marriages, Births and Deaths in Ireland, 1864 [4137], 1868–69, xvi (hereafter ARRG).
Second ARRG, 1865 [C 4], 1870, xvi.
Third ARRG, 1866 [C 130], 1870, xvi.
Fourth ARRG, 1867 [C 238], 1871, xv.
Fifth ARRG, 1868 [C 238], 1871, xv.
Sixth ARRG, 1869 [C 554], 1872, xvii.
Seventh ARRG, 1870 [C 785], 1873, xx.
Eighth ARRG, 1871 [C 968], 1874, xiv.
Ninth ARRG, 1872 [C 1099], 1874, xiv.
Tenth ARRG, 1873 [C 1376], 1876, xviii.
Eleventh ARRG, 1874 [C 1495], 1876, xviii.
Twelfth ARRG, 1875 [C 1617], 1876, xix.
Thirteenth ARRG, 1876 [C 1937], 1878, xxii.
Fourteenth ARRG, 1877 [C 2301], 1878–79, xix.
Fifteenth ARRG, 1878 [C 2388], 1878–79, xix.
Sixteenth ARRG, 1879 [C 2688], 1880, xvi.
Seventeenth ARRG, 1880 [C 3046], 1881, xxvii.
Eighteenth ARRG, 1881 [C 3368], 1882, xix.
Nineteenth ARRG, 1882 [C 3795], 1883, xx.
Twentieth ARRG, 1883 [C 4149], 1884, xx.
Twenty-first ARRG, 1884 [C 4538], 1884–85, xvii.
Twenty-second ARRG, 1885 [C 4801], 1886, xvii.
Twenty-third ARRG, 1886 [C 5153], 1887, xxiii.
Twenty-fourth ARRG, 1887 [C 5537], 1888, xxx.
Twenty-fifth ARRG, 1888 [C 5844], 1889, xxv.
Twenty-sixth ARRG, 1889 [C 6147], 1890, xxiv.
Twenty-seventh ARRG, 1890 [C 6520], 1890–91, xxiii.
Twenty-eighth ARRG, 1891 [C 6787], 1892, xxiv.
Twenty-ninth ARRG, 1892 [C 7255], 1893–94, xxi.
Thirtieth ARRG, 1893 [C 7535], 1894, xxv.
Thirty-first ARRG, 1894 [C 7800], 1895, xxiii.
Thirty-second ARRG, 1895 [C 8236], 1896, xxiii.
Thirty-third ARRG, 1896 [C 8560], 1897, xxii.
Thirty-fourth ARRG, 1897 [C 8949], 1898, xviii.
Thirty-fifth ARRG, 1898 [C 9491], 1899, xvi.
Thirty-sixth ARRG, 1899 [Cd 295], 1900, xv.
Thirty-seventh ARRG, 1900 [Cd 697], 1901, xv.
Thirty-eighth ARRG, 1901 [Cd 1225], 1902, xviii.
Thirty-ninth ARRG, 1902 [Cd 1711], 1903, xvi.
Fortieth ARRG, 1903 [Cd 2222], 1904, xiv.
Forty-first ARRG, 1904 [Cd 2673], 1905, xvii.
Forty-second ARRG, 1905 [Cd 3123], 1906, xx.
Forty-third ARRG, 1906 [Cd 3663], 1907, xvi.
Forty-fourth ARRG, 1907 [Cd 4233], 1908, xvii.
Forty-fifth ARRG, 1908 [Cd 4769], 1909, xi.
Forty-sixth ARRG, 1909 [Cd 5265], 1910, x.
Forty-seventh ARRG, 1910 [Cd 5783], 1911, xi.
Forty-eighth ARRG, 1911 [Cd 6313], 1912–13, xiv.