


Introduction
The Antarctic Peninsula and the adjacent South Shetland Islands, which include King George Island (KGI), have been identified as regions with a significant atmospheric warming trend (Reference KingKing, 1994; Reference Smith, Stammerjohn, Baker, Ross, Hofmann and QuentinSmith and others, 1996; Reference Harangozo, Colwell and KingHarangozo and others, 1997; Reference Skvarca, Rack, Rott and Ibarzabal y DonangeloSkvarka and others, 1998). The spectacular disintegration of ice shelves on both sides of the Antarctic Peninsula in the last decade has raised public interest in and drawn scientific attention to the area (Reference Rott, Skvarca and NaglerRott and others, 1996, Reference Rott, Rack, Nagler and Skvarca1998; Reference Doake, Corr, Rott, Skvarca and YoungDoake and others, 1998; Reference Lucchitta and RosanovaLucchitta and Rosanova, 1998). These collapses may be due to the weakening of the ice shelves caused by extreme surface melting during several consecutive extraordinarily warm ablation seasons in recent years (Hulbe, http://naturalscience.com/ns/articles/01–06/nsxlh.html).
This link between meltwater production and the retreat of ice shelves outlines the importance of knowledge of the spatial distribution of snowmelt patterns. Furthermore, information on albation patterns improves understanding of glacier and ice-cap mass balance (Reference BintanjaBintanja, 1995). Rising air temperatures lead to an extension of ablation areas as well as of the ablation periods, as demonstrated by Reference Fox and CooperFox and Cooper (1998) for the northern Marguerite Bay area. Furthermore, changing precipitation characteristics accompanying the warming will modify the accumulation patterns on the glacial systems (Reference Turner, Colwell and HarangozoTurner and others, 1997). However, more detailed meteorological, snow-hydrological and glaciological observations are required (a) to improve the monitoring of short-term glacier mass-balance variations, (b) to increase the accuracy of long-term predictions of glacier mass-balance changes, and (c) to further develop glacier mass-balance models. These observations include monitoring of snowmelt patterns, snowline positions and glacier mass-balance terms. Since most study sites in Antarctica are difficult to reach, remote-sensing techniques can complement ground observations and fill spatial and temporal data gaps.
Weather-independent synthetic-aperture radar (SAR) systems are particularly helpful in regions of frequent cloud coverage and low sun azimuths during winter. The high potential of SAR data for mapping snowmelt patterns and snow-cover properties has been demonstrated by different authors (e.g. Reference Jiancheng and DozierShi and Dozier, 1993; Reference WunderleWunderle, 1996; Reference Smith, Forster, Isacks and HallSmith and others, 1997; Reference BindschadlerBindschadler, 1998; Reference PartingtonPartington, 1998; Reference Rau and SaurerRau and Saurer, 1998, in press).
In this paper, we present a case study of the small KGI ice cap (Fig. 1), using seven European remote-sensing satellite (ERS-2) SAR images acquired between October 1996 and February 1997. The temporal and spatial evolution of the snowmelt patterns on the ice cap is monitored, and the position of the snowline at the end of the ablation season is derived. The analysis is supported by meteorological records of the adjacent Brazilian station Ferraz (Fig. 1) and snow data obtained during field campaigns in 1992,1995/96 and 1997/98.
Map of the western part of KGI. The areas of interest (AOIs) for the calculation of the backscatter profiles are narked in black. Place names mentioned in the text are indicated.

The KGI Ice Gap (62° S, 58° W)
In contrast to the deeply incised southern part of the KGI ice cap, the gentle north-facing slopes yield an ideal study area for radar remote sensing, since relief-induced distortions are negligible on low-gradient slopes and flat surfaces. Furthermore, changes in the size of the ablation area are more easily detected using satellite image analysis on moderately inclined slopes than on steep slopes (Reference BindschadlerBindschadler, 1998). The study area can be subdivided into a large ice cap, which covers the high elevations, and two smaller-sized ice fields, the Warszawa Icefield and the Bellingshausen Dome (Fig. 1).
The South Shetland Islands are subject to a maritime climate characterized by the rapid succession of low-pressure centers (Reference BintanjaBintanja, 1995). Snowmelt can occur at any time during the year due to the advection of warm, humid air masses (Reference RachlewiczRachlewicz, 1997). The influence of warm and cold fronts on the snowpack has been clearly documented by Reference Wunderle, Grossmann and SaurerWunderle and others (1994) for 1992.
Previous mass-balance approaches yield contradictory results for the KGI ice cap. Surface energy-balance calculations (Reference BintanjaBintanja, 1995) and applications of an ice-flow model (Reference Knap, Oerlemans and CadéeKnap and others, 1996) revealed that the ice cap is highly sensitive to climatic changes. In fact, a massive retreat in the ice margins on the entire ice cap since 1956 was detected by Reference WunderleWunderle (1996), Reference Park, Chang, Yoon and ChungPark and others (1998) and Reference Simoes, Bremer, Aquino and FerronSimoes and others (1999). As predicted by ice-flow modeling (Reference Knap, Oerlemans and CadéeKnap and others, 1996), observed retreat rates were higher on the southern shore than on the northern coast (Reference Simoes, Bremer, Aquino and FerronSimoes and others, 1999). In contrast, Wen and others (1994, 1998) concluded from mass-balance measurements and an extrapolation based on meteorological records (1971/72–1991/92) that the small ice cap of Bellingshausen Dome was in a steady-state condition.
Sar Remote Sensing of Snow-Cover Properties
The backscatter signal received at the SAR sensor is affected by sensor parameters as well as by snow-cover parameters such as snow density, liquid-water content, grain-size, ice layers and surface roughness. Due to their sensitivity to liquid water within the snowpack, SAR data offer the possibility of distinguishing the actual zones of wet and dry snow on a glacier. Since SAR data furthermore provide information from deeper layers of a dry snowpack, a more detailed classification of the instantaneous distribution of snow zones on a glacier during image acquisition is facilitated. However, the spatial and temporal evolution as well as the delimitation of these snow zones identifiable in SAR images do not necessarily coincide with the characteristics of the glaciological snow zones on a glacier (Reference PatersonPaterson, 1994; Reference BensonBenson, 1996). These classical glacier facies or glacier snow zones are based upon properties integrated over time periods of years (Reference BensonBenson, 1996). In contrast, snow zones observable in SAR images are dynamic on a time-scale of days to weeks and show remarkable interannual variations. As such, they should be referred to as radar glacier zones (Reference Forster, Isacks and DasForster and others, 1996; Reference Smith, Forster, Isacks and HallSmith and others, 1997; Rau and others, in press).
A classification of radar glacier snow zones given by Reference Smith, Forster, Isacks and HallSmith and others (1997) from the Stikine icefields, Canada, comprises dry, melt, phase 2 melt (P2) and bare-ice radar glacier zones. However, this terminology leads to ambiguities, as the proposed dry radar glacier zone (Reference Smith, Forster, Isacks and HallSmith and others, 1997) is assigned to a winterly frozen snowpack, which evidently is subject to periodic melting during the ablation season. Therefore, we refer in this paper to a modified classification scheme proposed by Rau and others (in press) that includes dry-snow, frozen-percolation, wet-snow and bare-ice radar zones as the major radar glacier zones, described below.
The dry-snow radar zone is restricted to high areas where temperatures never rise above the melting point. Due to high penetration depth and dominant volume scattering, the dry-snow radar zone is characterized by low backscatter values.
In the frozen-percolation radar zone, frequent or occasional melt-freeze cycles lead to the formation of numerous ice layers and large grain-sizes in the snowpack. Both ice layers and large snow grains act as strong scatterers of the radar beam. This results in high backscatter values in the SAR images.
The development of the wet-snow radar zone can be identified by very low backscatter values. During the ablation season, melting increases the liquid-water content in the snowpack of the lower parts of the glaciers. Liquid water absorbs a large percentage of the radar beam.
In the snow-free bare-ice radar zone, which develops in the lowest parts of a glacier, surface scattering causes a relatively strong backscatter signal compared to the wet-snow radar zone.
More radar glacier zones have been identified by several authors. Reference Marshall, Rees, Dowdeswell and AskneMarshall and others (1995) identified the superimposed-ice zone by low backscatter values in comparison to the adjacent bare ice. The differences were attributed to the higher surface roughness of the bare glacier ice. Reference Smith, Forster, Isacks and HallSmith and others (1997) described high radar returns from a metamorphosed and roughened melting snow surface. The corresponding snow zone was labeled the P2 radar zone.
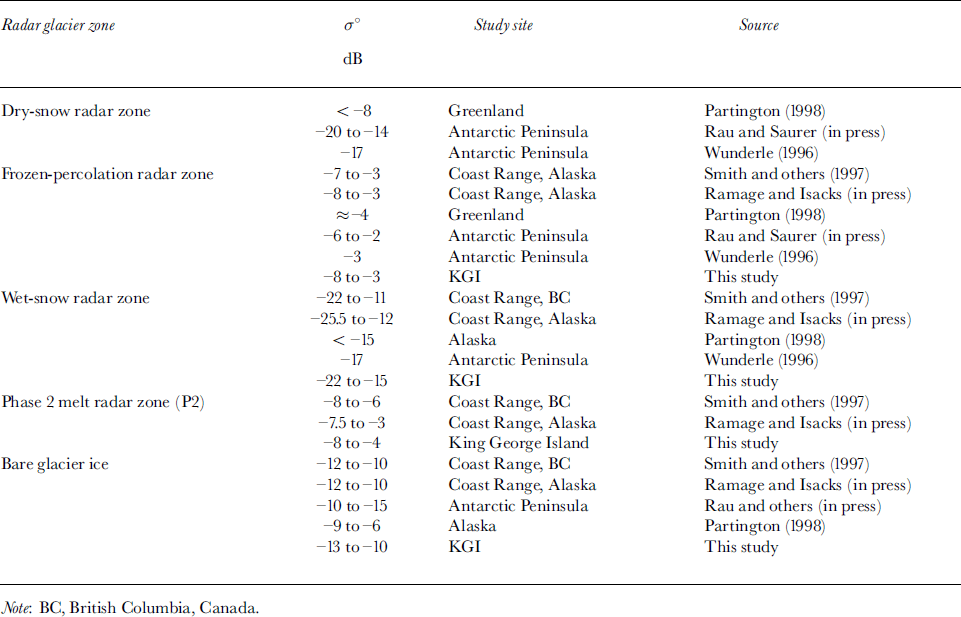
An overview of typical backscatter values of the radar glacier zones is given in Table 1. The backscatter mechanisms of each glacier snow zone are reviewed in detail by Reference PartingtonPartington (1998).
Overview on SAR backscatter coefficients (C-band) reported for different study sites
Satellite Data, Data Processing and Field Observations
The seven ERS-2 SAR images analyzed were acquired during October-November 1996 and January-February 1997 by the German Antarctic Receiving Station at the Chilean base O’Higgins, Antarctic Peninsula. Normalized backscatter coefficients (σ˚) were calculated for all images (after Reference Laur, Bally, Meadows, Sanchez, Schaettler and LopinoLaur and others, 1997). The images with a pixel spacing of 25 m were co-registered and geo-rectified to the Universal Transverse Mercator (UTM) coordinate system to provide the same geometry as a digital terrain model of the island. On the images, areas of interest (AOIs) covering 50 x50 pixels were selected along an altitudinal transect line between 85 and 620ma.s.l. (Figs 1 and 3). Mean normalized backscatter coefficients were then calculated for the AOIs in each image.
During several ground-truth campaigns in 1992,1995/96 and 1997/98, meteorological data as well as stratigraphic (eg. snow grain-size, ice layers) and hydrologic information (eg. liquid-water content) on the snow cover were collected on the KGI ice cap in order to facilitate the analysis of ERS-1/2 SAR images (e.g. Reference Wunderle, Grossmann and SaurerWunderle and others, 1994; Reference Braun and SchneiderBraun and Schneider, 2000). Due to the absence of simultaneous ground-truth data for the investigated time period, meteorological records (air temperature and humidity, precipitation, wind speed and direction) from the nearby Brazilian station, Commandante Ferraz (Fig. 1), were used to aid image interpretation.
Results and Discussion
Seasonal development of radar glacier zones on the KGI ice cap
The sequence of ERS-2 SAR images spans almost the entire 1996/97 ablation period (Fig. 2). On the KGI ice cap, all radar glacier zones except the dry-snow radar zone develop over the year depending on the prevailing meteorological conditions and altitude. Based on meteorological records, the dry-snow radar zone was calculated to be above an altitude of approximately 1950 ma.s.l. at the latitude of KGI, while the highest elevation on the island is 679 m a.s.l. (Reference WunderleWunderle, 1996).
Development of radar glacier zones on KGI revealed by ERS-2 SAR images, (a) Winter conditions with a frozen-percola-twn zone covering the entire island; (b) onset of snowmelt; (c-f) development of the different radar glacier zones during austral summer 1997. Dates are in dd/mm/yy. ESA, European Space Agency.

Winter conditions
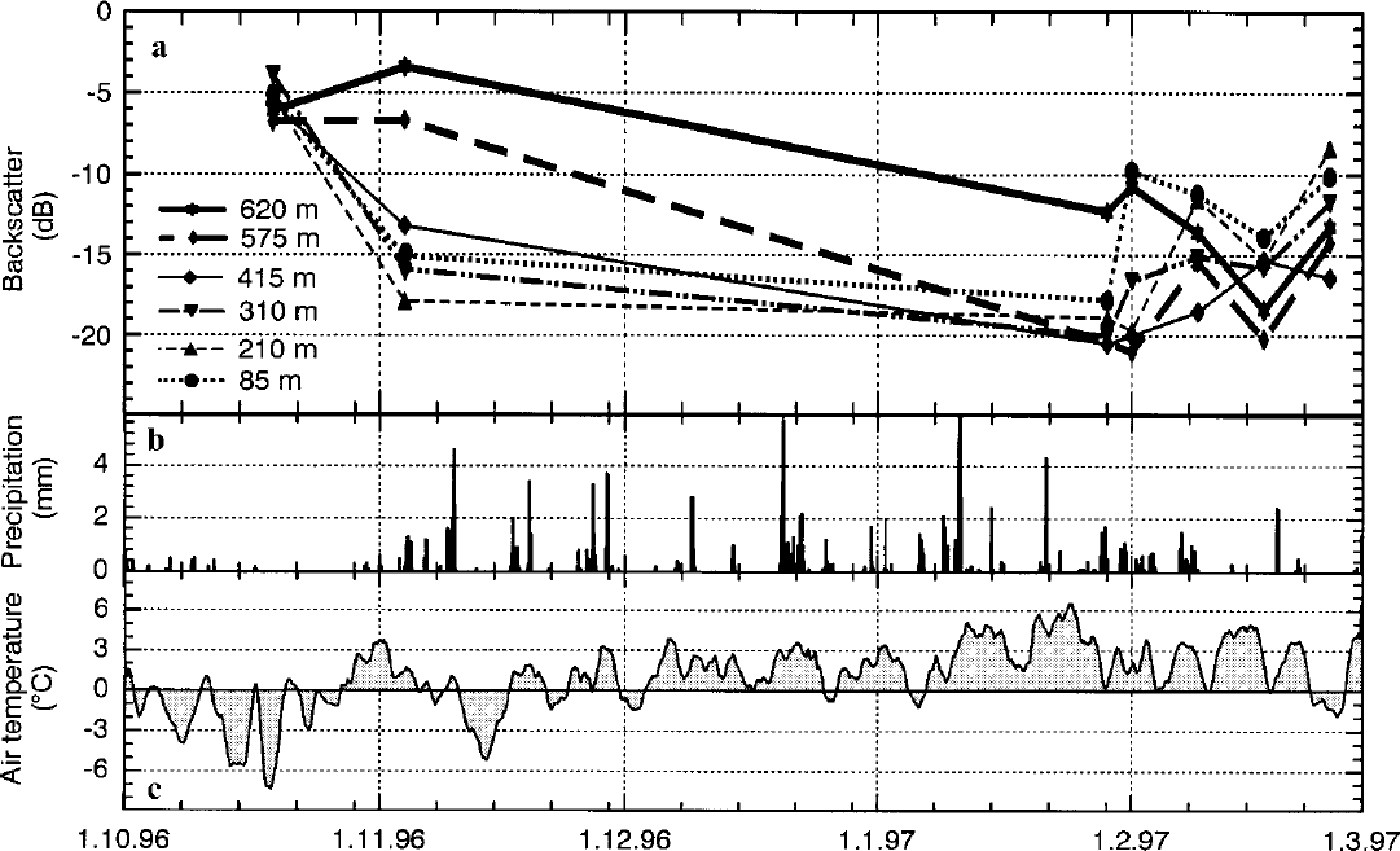
A typical late-winter situation is shown on the ERS-2 image from 19 October 1996 (Fig. 2a). The entire ice cap appeared bright, with σ° values ranging between –3 and –8 dB (Fig. 3). These values are characteristic of a frozen-percolation radar zone (Table 1).
Temporal evolution of backscatter values at the AOIs, and meteorological records of Ferraz station during the research period: (a) backscatter signal, ( b ) precipitation, (c) air temperature. Dates are in dd.mm.yy. Note that the 17 February snowstorm event is underrepresented in the precipitation records.
Onset of spring melt
The onset of spring snowmelt can be seen on the second image, which was taken on 4 November 1996 (Fig. 2b). While the frozen-percolation zone persisted above 530 m a.s.L, an extensive area of low σ° values developed in the lower parts of the ice cap. Backscatter values ranging from –15 to –18 dB at elevations between sea level and approximately 350 m a.s.l. indicate the existence of a wet-snow radar zone (Fig. 3). Between this and the frozen-percolation radar zones, a transition zone was characterized by increasing backscatter values with altitude, between –15 and ― 8 dB.
Summer situation
The following scenes represent different situations of the KGI ice cap during the summer ablation season (Figs 2c-f and 3). In the image taken on 29 January 1997, backscatter values below –18 dB can be attributed to the expansion of the wet-snow radar zone over most of the ice cap, excluding the highest areas. At AOI 620 m, the averaged σ° value decreased to –12 dB. On 1 February 1997, the backscatter value at AOI 85 m showed a significant increase from –18 to –lOdB.The latter value is characteristic of a bare-ice radar zone (Table 1). All the other AOIs displayed low variations in their σ° values referring to the previous acquisition date.
The situation changed drastically on 9 February 1997. The AOI 210 m was now included in the bare-ice radar zone. Between this snow-free area and the wet-snow radar zone, which meanwhile covered almost the entire upper parts of the ice cap a well-defined bright band with σ° values ranging between –4 and –8 dB was formed. It skirted the northwestern parts of the ice cap and was limited to an altitude of approximately 250 m a.s.l. One week later, the striking bright band disappeared. The backscatter values of almost all AOIs showed a remarkable decrease. All values were below –13 dB
Backscatter values of almost all AOIs increased again in the image from 25 February 1997. The bare-ice zone stretched up to approximately 250 m a.s.l, while the upper parts of the ice cap were characterized by a" values ranging between-13 and-17 dB.
Interpretation of SAR data based on meteorological records
Meteorological records from Ferraz station (Fig. 3) are used in the interpretation of the observed backscatter pattern on the KGI ice cap. Analyses show that the observed pattern of radar glacier zones is a direct consequence of the prevailing meteorological conditions prior to and during the image acquisition.
Negative temperatures dominated the time period prior to the acquisition of the ERS-2 image taken on 19 October 1996. Several minor events with positive air temperatures during the month did not lead to significant melting and so did not affect the backscatter behavior of the snow cover on 19 October. An entirely frozen snowpack can thus be assumed for the ice cap, which coincides with the observed high backscatter values of a frozen-percolation radar zone.
Advection of warm air masses starting on 27 October caused a progressive wetting of the snow surface and significantly reduced the snow-cover extent in the ice-free areas of the island (Reference Winkler, Schulz and KappenWinkler and others, 1998). Snowmelt was most intensive in the lowest areas of the ice cap, forming an extended wet-snow radar zone up to approximately 350 m a.s.l. (Fig. 2b). Decreasing liquid-water content resulted in higher backscatter returns with increasing altitude. Applying a mean temperature lapse rate of 6.5°C km–1, the maximum altitude of melting during this event was estimated to be approximately 540 m a.s.l. on 1 November. This is in good agreement with the observed lower limit of the frozen-percolation radar zone on 4 November, applying a threshold of ― 8 dB for determining the lower boundary of this radar zone (Table 1).
This melt event initiated the ablation season of the austral summer 1996/97 on the KGI ice cap. Although the temperatures again dropped below 0°C in mid-November, positive temperatures prevailed until the end of February. A prolonged, uninterrupted period with high air temperatures up to 6°C was recorded during January (Fig. 3). Therefore, it can be concluded from the meteorological records that during this period the snow cover of the entire ice cap, including the uppermost parts, was intensively wetted. However, short-time refreeze events occurred occasionally during the whole ablation season. Indications of these alternating melt and refreeze cycles can also be found in the SAR images. Prior to the image acquisition on 29 January, air temperatures at Ferraz station dropped to almost 0°C. At the highest elevations of the ice cap, refreezing of the formerly wet snow led to a reduction of the liquid-water content in the snowpack and therefore to an increase in backscatter values (AOI 620 m; Figs 2c and 3. This refreeze event is clearly evident in the air-temperature data and the ERS-2 image taken on 25 February (Figs 2f and 3).
Although no field data are available, the meteorological records indicate that at least the lower parts of the ice cap were snow-free at the end of January 1997. This assumption is supported by comparison of meteorological data and our own field observations from 1995/96 and 1997/98. However, in the image taken on 29 January, a homogeneously distributed wet-snow radar zone stretches over the ice cap from sea level to approximately 600 m a.s.l. This apparent contradiction can be explained by a snowfall event of 5.4 mm w.e. accompanied by low temperatures prior to the image acquisition. As a consequence, the formerly exposed glacier ice was covered by wet, fresh snow. In the following days, a drastic increase of σ° values at AOI 85 m, from –17 dB on 29January to –10 dB on 1 February, can be attributed to the removal of this wet-snow cover and the re-exposure of bare glacier ice as a consequence of high temperatures and rainfall prior to image acquisition. Due to the continuing high air temperatures and the resulting high ablation rates, the altitude of the transient snowline increased progressively. It can be located above 210 ma.s.l. as indicated by a steep rise of σ° values at AOI 210 m between 1 and 9 February. As a result of the high temperatures and the precipitation event prior to the image acquisition on 9 February, the wet-snow radar zone persisted in the higher parts of the ice cap. The weather conditions give no evidence about the processes leading to the formation of the bright band visible in the SAR image. Based on the analysis of the meteorological data, however, a temperature inversion that would have led to a dry, frozen snowpack at lower elevations can be excluded.
On 17 February, temperatures again dropped to the freezing point at Ferraz station, while at the same time a heavy snowstorm was reported from the island (personal communication from B. Winkler, 1999). A layer of presumably wet, fresh snow explains the observed decrease of backscatter values at all AOIs on this date. Furthermore, the disappearance of the bright band due to the fresh snow cover seems plausible.
During a warm period lasting until 22 February, the fresh snow cover could easily have been depleted. Subsequently, a period of 3 days with negative temperatures preceded the image acquisition on 25 February. Hence, a sequence of radar zones can be identified in the SAR image, including a bare-ice radar zone covering the lowermost 250ma.s.L, a wet-snow radar zone at intermediate altitudes and a refreezing snow cover in the highest parts of the ice.
High radar returns from a wet snowpack?
The observed backscatter values for the different radar glacier zones identified on the KGI ice cap are in good agreement with values reported from other regions (Table 1). Furthermore, the measured σ° values agree well with backscatter model results as presented by Reference Schneider, Wunderle and FriedrichSchneider and others (1997), Reference Smith, Forster, Isacks and HallSmith and others (1997) and Reference PartingtonPartington (1998).
The striking bright band on the SAR image taken on 9 February with a" values between –8 and –4dB can be regarded as an extra radar glacier zone. Although these backscatter returns are not unlike those from a frozen-percolation radar zone, meteorological records definitely indicate a melting snowpack below 300ma.s.l. prior to and during image acquisition. Since heavily dissected, bare glacier ice is absent in this area, multipath scattering from an irregular ice surface can also be excluded as a reasonable backscatter mechanism. Moreover, high returns from the superimposed-ice zone present on the KGI ice cap (Wen and others, 1998) can be ruled out as a plausible explanation. With local slope angles of ≤ 10° in the area of the bright band, the smooth surface of the superimposed ice is expected to cause low backscatter values due to high specular reflection from the surface (Reference Marshall, Rees, Dowdeswell and AskneMarshall and others, 1995; Reference PartingtonPartington, 1998).
So far, only a few studies have observed such a phenomenon (e.g. Reference Smith, Forster, Isacks and HallSmith and others, 1997; Ramage and Isacks, in press). Reference Smith, Forster, Isacks and HallSmith and others (1997) suggested the term P2 radar zone for such a high-backscatter area, which is interpreted as a rapidly melting first-year snow cover with a metamorphosed roughened surface. The high backscatter returns are hereby most likely explained by multipath scattering from a roughened, wet-snow surface (Reference Smith, Forster, Isacks and HallSmith and others, 1997; Ramage and Isacks, in press). The appearance of this P2 radar snow zone has been reported only from maritime climates in North America (Coast Range Mountains of Alaska and British Columbia) and now probably on the South Shetland Islands. However, no final answer can be given for the occurrence on the KGI ice cap, as ground-truth data collected simultaneously during image acquisition are lacking.
The late-summer snowline on the KGI ice cap 1996/97
For the monitoring of climatic variations and glacier mass-balance studies, knowledge of the equilibrium-line altitude (ELA) is especially important. In agreement with different authors (e.g. Reference Marshall, Rees, Dowdeswell and AskneMarshall and others, 1995; Reference Smith, Forster, Isacks and HallSmith and others, 1997; Rau and others, in press), the late-summer snowline can be regarded as an approximation of the ELA. It should be mentioned that both the presence of a superimposed-ice zone and the exposure of firn from previous years generally introduce uncertainties in the determination of the ELA from SAR imagery.
On the northwestern parts of the KGI ice cap, the transient snowline was determined as being at approximately 250 ma.s.l. at the end of February 1997. Due to the lack of direct field evidence from 1997, no estimation can be made of position differences between the late-summer snowline and the ELA.
The obtained value of the transient snowline at the end of the 1996/97 ablation season fits well within the altitude range of the ELA given in previous studies of glaciers of the South Shetland Islands. For the Bellingshausen Dome, KGI, Reference Orheim and GovorukhaOrheim and Govorukha (1982) reported ELAs of 140ma.s.l. (1969/70) and 170ma.s.l. (1970/71), while Wen and others (1998) measured 140–150 m a.s.l. in 1991/92. From analysis of multispectral Systeme probatoire pour 1’observa-tion de la terre (SPOT) imagery, Reference Simoes, Bremer, Aquino and FerronSimoes and others (1999) derived an altitude of 300–350 m a.s.l. for the late-summer snowline in 1988 on the southwestern KGI ice cap. An ELA of 110 m a.s.l. was reported for Nelson Island for the years 1985–89 (Ren and others, 1995). On Livingston Island, an ELA of 200–260 m a.s.l. (1965–93) was determined by radio-isotope measurements (personal communication from M. Pourchet, 1996).
Conclusion
In the presented time series of ERS-2 SAR images, ablation patterns on the KGI ice cap were identified by mapping the dynamic evolution of radar glacier zones described above, including the initial frozen-percolation radar zone and the subsequently developing wet-snow and bare-ice radar zones. A striking bright backscatter signature within the lower parts of the wet-snow radar zone on 9 February 1997 was interpreted as a P2 radar glacier zone, characterized by a roughened and metamorphosed melting snow surface. Generally, concurrent meteorological data proved to be essential for the interpretation of SAR images, especially in the absence of simultaneously acquired ground-truth information.
Ablation patterns on the KGI ice cap obviously depend on altitude, despite the maximum elevation of only 679 ma.s.l. The advection event at the end of October, which initiated melt onset, affected only elevations below 530 m a.s.l. A wet snowpack also covering the highest elevations can be deduced from a prolonged, uninterrupted period of high temperatures in January 1997. However, the uppermost parts of the ice cap were affected by occasional melt-freeze cycles throughout the ablation season. These results outline the potential of SAR data for the initialization and verification of snowmelt models.
On the KGI ice cap, the ELA was approximated to about 250 ma.s.l. in 1996/97 by mapping the transient snowline at the end of the ablation season. This value is within the wide range of ELA positions which have been reported previously from the South Shetland Islands. The high variability of ELAs derived from field measurements outlines the necessity of a yearly monitoring of this important mass-balance parameter. Analysis of SAR data offers the unique possibility for determining the approximated ELA in remote areas on a regional scale. However, in order to improve the explanations and to develop more sophisticated methods for interpreting SAR data, it is essential to collect more ground-truth information. Further field studies are planned in the near future and will hopefully bring new insights into the backscatter mechanisms of the P2 radar glacier zone.
Acknowledgements
This study was supported by the Deutsche Forschungs-gemeinschaft within the project KIGEIS (contract No. SA 694/1–1) and by the ESA project ˚Monitoring of Dynamic Processes in Antarctic Geosystems" (contract No. A02.D149). The authors would like to thank the Alfred-Wegener-Institut für Polar- und Meeresforschung, Bremerhaven, Germany the Brazilian Antarctic Program, and J. C. Simões and his colleagues from the Universidade Federal do Rio Grande do Sul, Brazil, for logistical and field assistance. We are grateful to A. Setzer and B. Winkler for providing the meteorological data, as well as to F.Weber and A. Morgan (Vancouver) for proofreading. Our thanks also to the two anonymous reviewers for their comments on the manuscript.



