The Devensian Lateglacial (sometimes referred to as the Late Glacial, Late glacial or late-glacial) is the interval between 14,700 cal. yr BP (14.7 ka) and 11,700 cal. yr BP (11.7 ka). In Scotland, proxy climate records show a rapid initial warming following the glacial conditions of the Last Cold Stage (Dimlington Stadial), with warmer temperatures during the Lateglacial (Windermere) Interstadial (14.7–12.9 ka) and the return to a climatic regime of arctic severity and renewed glaciation during the Loch Lomond Stadial (12.9–11.7 ka).
Although spanning a time interval of no more than ∼3 ka, the Lateglacial is one of the most intensively studied episodes in the entire Scottish Quaternary record. Reasons for this are not difficult to find. The proximity to the present means that the geomorphological evidence for glacier activity (relating both to ice-sheet wastage and glacier readvances) is extremely well-preserved and, hence, the glacial history of the Lateglacial can be reconstructed in remarkable detail (Golledge Reference Golledge2010; Bickerdike et al. Reference Bickerdike, Ó Cofaigh, Evans and Stokes2017). The same is the case for the record of non-glacial geomorphological activity (Ballantyne 2017, this volume), and also for land- and sea-level change (Smith et al. Reference Smith, Barlow, Bradley, Firth, Hall, Jordan and Long2017, this volume). But preserved within the Scottish landscape is also abundant evidence of other aspects of environment and landscape change. This is typically, although not exclusively, from both contemporary and infilled lake sites, both of which have yielded a range of biological data, including pollen, plant macrofossils, fossil Coleoptera (beetles) and chironomids (non-biting midges), as well as other sedimentological and geochemical proxies. Collectively, these diverse sources of evidence provide a basis for detailed reconstructions of the environment of Scotland during a period characterised by often rapid climate change and climatic instability.
An essential pre-requisite for environmental reconstruction is the establishment of a reliable time scale, and a number of geochronological methods have been applied to the Scottish Lateglacial. These include radiometric dating (radiocarbon dating and surface exposure dating), tephrochronology and varve chronology (see section 3 below).
Palaeoenvironmental and palaeoclimatic scenarios can therefore often be set within a temporal framework, and can be correlated with those from other areas of the N Atlantic region. There are, however, differences in the ways in which dates on proxy records are expressed. The abbreviation ‘ka’ is now widely used to denote ‘thousand years ago’, irrespective of the chronological method employed. In radiocarbon dating, the age estimates are given as years (yr) BP (before ‘present’; e.g., 14C yr BP), where BP represents a baseline year of AD 1950. Where radiocarbon ages have been calibrated to an independently-derived time scale using, for example, INTCAL-13, the dates are stated as ‘cal. 14C yr BP’ with 95 % age uncertainty errors. Surface exposure ages are quoted relative to the year in which the age measurement was made, while in ice core dating the baseline age is the year AD 2000, and this is denoted by the abbreviation b2k (i.e., before 2000).
It is important to stress at the outset that this contribution is not a conventional narrative of Lateglacial environmental changes. There have been a number of overviews of the Scottish Lateglacial record (e.g., Gray & Lowe Reference Gray, Lowe, Gray and Lowe1977; Walker Reference Walker1984; Tipping Reference Tipping, Barton, Roberts and Rose1991a; Walker & Lowe Reference Walker, Lowe and Gordon1997), and thus we have chosen not to add yet another. Here we focus our attention first on the stratigraphic signature of the Lateglacial in depositional sequences in Scotland, and its associated terminology. We then describe the various archives from which inferences about the Scottish Lateglacial environment can be drawn, examine the principal methods by which these environmental records can be dated and correlated, and discuss some of the difficulties in their interpretation. Finally, we consider recent work leading to the development of a Lateglacial event stratigraphy and propose a new provisional type sequence (stratotype) for the Lateglacial period in Scotland. The paper concludes with a discussion of the approaches that, in our view, should be central to future research on the Scottish Lateglacial. Throughout the paper, we explore the ways in which the Scottish scenario can be integrated with independent climate records from other regions, most notably the high-resolution event stratigraphy based on the isotopic signal in the Greenland ice cores.
1. Stratigraphic subdivision
1.1. The Lateglacial stratigraphic record
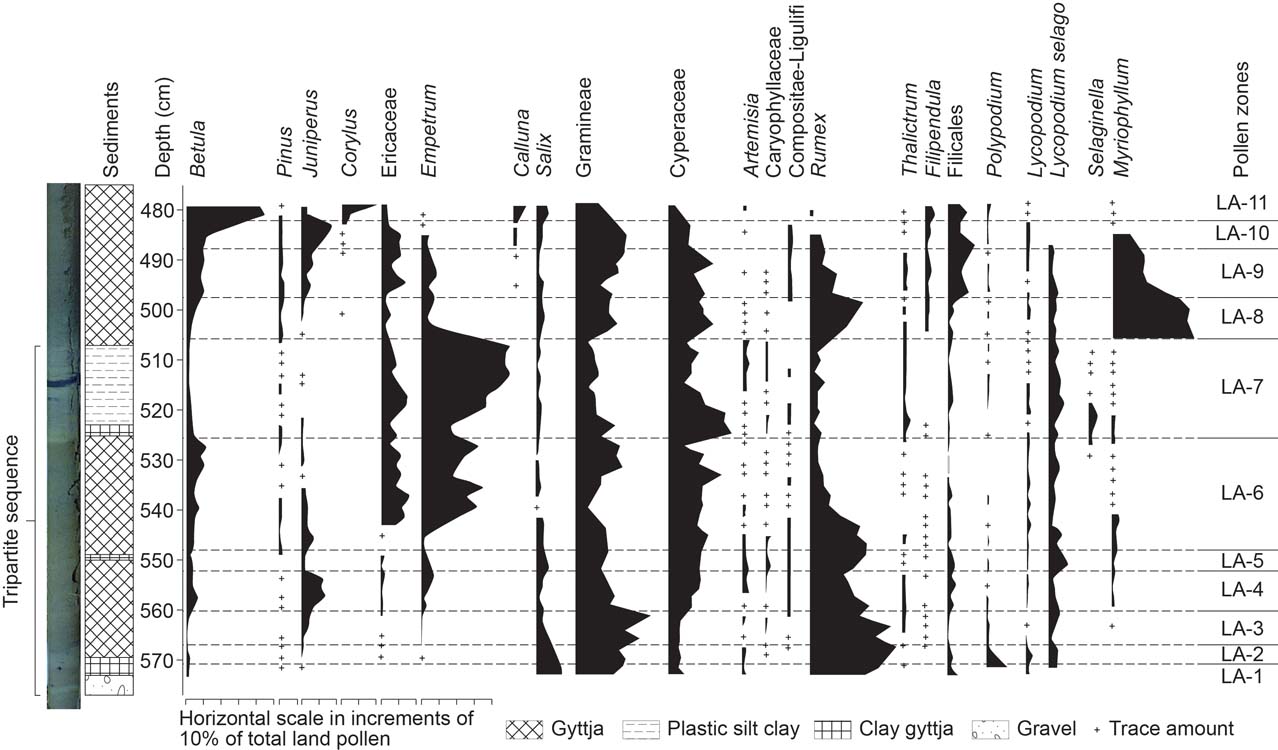
In lake sediment records, the characteristic lithostratigraphic signature of the Lateglacial is a ‘tripartite’ sequence consisting of a basal minerogenic unit representing deposits that accumulated at the end of the Dimlington Stadial, overlain by sediments of increasing organic content (Lateglacial/Windermere Interstadial), and followed by a further minerogenic unit that accumulated during the Loch Lomond Stadial (Fig. 1). The entire succession is overlain by organic sediments of Holocene age.
Lateglacial lithostratigraphic and pollen-stratigraphic sequence at Loch Ashik, Isle of Skye. The basal gravel, clay gyttja and gyttja deposits (base to c.523 cm) span the Lateglacial Interstadial, and the silty-clay sediments (523–508 cm) accumulated during the Loch Lomond Stadial. The black band in the middle of the Stadial unit is a visible layer of the Vedde Ash (section 3.4). (Adapted from Walker & Lowe Reference Walker and Lowe1990). For further detail, see text.

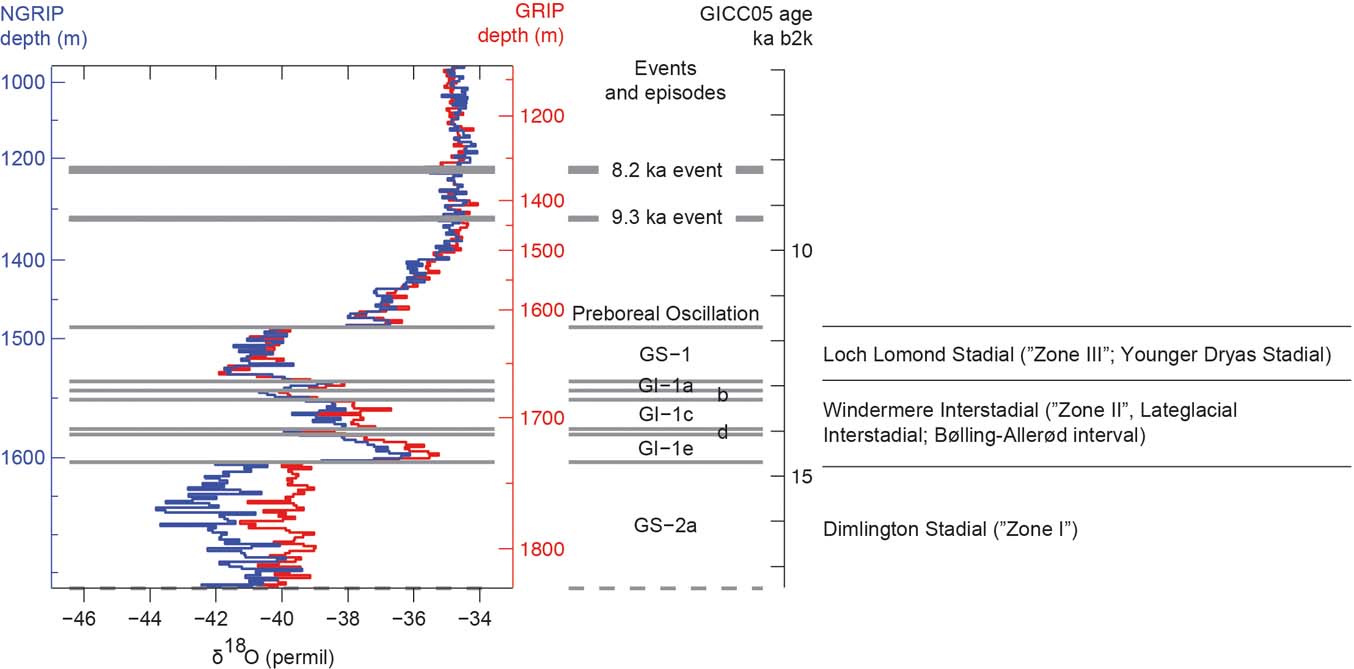
This typical Lateglacial stratigraphy was first recognised in Scotland at Whitrig Bog in Berwickshire (Mitchell Reference Mitchell1948), and an age assigned on the basis of comparisons with similar lithostratigraphic sequences in Ireland and Denmark (Jessen & Farrington Reference Jessen and Farrington1938; Iversen Reference Iversen1947). The tripartite sediment record was correlated with pollen zones I, II and III (see Fig. 2) of the scheme developed by Jessen (Reference Jessen1949) for sites in Ireland and, following the work of Donner (Reference Donner1957) in particular, this pollen biozone-based subdivision subsequently became widely applied in Scotland (Walker Reference Walker1984). Indeed, what is now more widely termed the Loch Lomond Stadial (or Loch Lomond Stade) was frequently referred to simply as ‘Zone III’ (or pollen zone III; e.g., Sissons Reference Sissons1972), and the readvance glaciers that developed during that time interval as ‘zone III’ glaciers (e.g., Sugden Reference Sugden1973). The tripartite sedimentary sequence was also correlated with records from NW Europe, pollen zone II being equated with the Bölling-Alleröd warmer episode and pollen zone III with the subsequent cold phase of the Younger Dryas Stadial (Iversen Reference Iversen1954).
The Greenland ice-core stratotype sequence of climatic events/episodes during the last glacial–interglacial transition, based on the stable oxygen isotope record, and underpinned by the GICC05 chronology (after Lowe et al. Reference Lowe, Rasmussen, Björck, Hoek, Steffensen, Walker and Yu2008b). On the right are the broadly corresponding stratigraphical terms employed in Britain and northwest Europe.

However, with the adoption of local (as opposed to regional) zonation schemes based on pollen assemblages, a trend that began in the 1970s (e.g., Pennington et al. Reference Pennington, Haworth, Bonny and Lishman1972; Birks Reference Birks1973), pollen biozones were no longer considered to be an adequate basis for stratigraphic subdivision, as it was acknowledged that the boundaries between regionally-defined biozones are invariably time-transgressive because they reflect slow and often spatially variable vegetational responses to climate change (Walker Reference Walker1995). Hence, the earlier pollen-based stratigraphy was gradually replaced by a scheme based on a range of climate proxies, of which pollen was but one. This climatostratigraphic approach, in which the Lateglacial is divided simply into interstadial and stadial episodes, found increasing favour not only with geoscientists in Scotland, but also with colleagues working elsewhere in Britain and NW Europe.
1.2. Lateglacial terminology
In the 1970s and 1980s, there was a suggestion that, in line with conventional geological practice, temporal subdivision of the Late Devensian/Late Weichselian stratigraphic record of the British Isles should, where possible, be related to type sites or stratotypes. Accordingly, it was proposed that the interstadial episode reflected by former pollen zone II should be termed the Windermere Interstadial (Fig. 2) with the type site at Low Wray Bay, Windermere in NW England (Coope & Pennington Reference Coope and Pennington1977); while the Late Devensian/Last Cold Stage (the earlier part of former pollen zone I: Fig. 2) should be termed the Dimlington Stadial and based on the type sequence at Dimlington, Holderness, eastern England (Rose Reference Rose1985). To date, no formal stratotype for the Loch Lomond Stadial/pollen zone III has been put forward, although west-central Scotland has been suggested as the potential type area (Rose Reference Rose, Rose and Schlüchter1989).
Despite these proposals, no further steps have since been taken to seek formalisation of the stratigraphic units that comprise the Lateglacial. This contrasts with other parts of the Quaternary record where, in recent years, there have been moves to adopt a more formal approach to stratigraphic subdivision. Prompted largely by the Subcommission on Quaternary Stratigraphy (of the International Commission on Stratigraphy), formal subdivisions (stages/ages; subseries/subepochs) of the Pleistocene and Holocene have been proposed that either have been, or will in due course be, formally ratified by the International Union of Geological Sciences (IUGS) and represented in the International Geological Time Scale (Head & Gibbard Reference Head and Gibbard2015). If the Lateglacial was to be formalised in this way, the Windermere Interstadial and Loch Lomond Stadial would likely be assigned the rank of ‘chron’ within the Late Pleistocene/Late Quaternary stage/age or subseries/subepoch, and linked to a defined regional stratotype. At present, there are no such formal proposals, however, and hence the terminology of the Lateglacial in Scotland, and indeed in the rest of the British Isles, remains essentially informal. This is reflected, for example, in the more widespread use of the term ‘Lateglacial Interstadial’ as opposed to ‘Windermere Interstadial’ in much of the Lateglacial literature.
1.3. The Greenland ice-core record
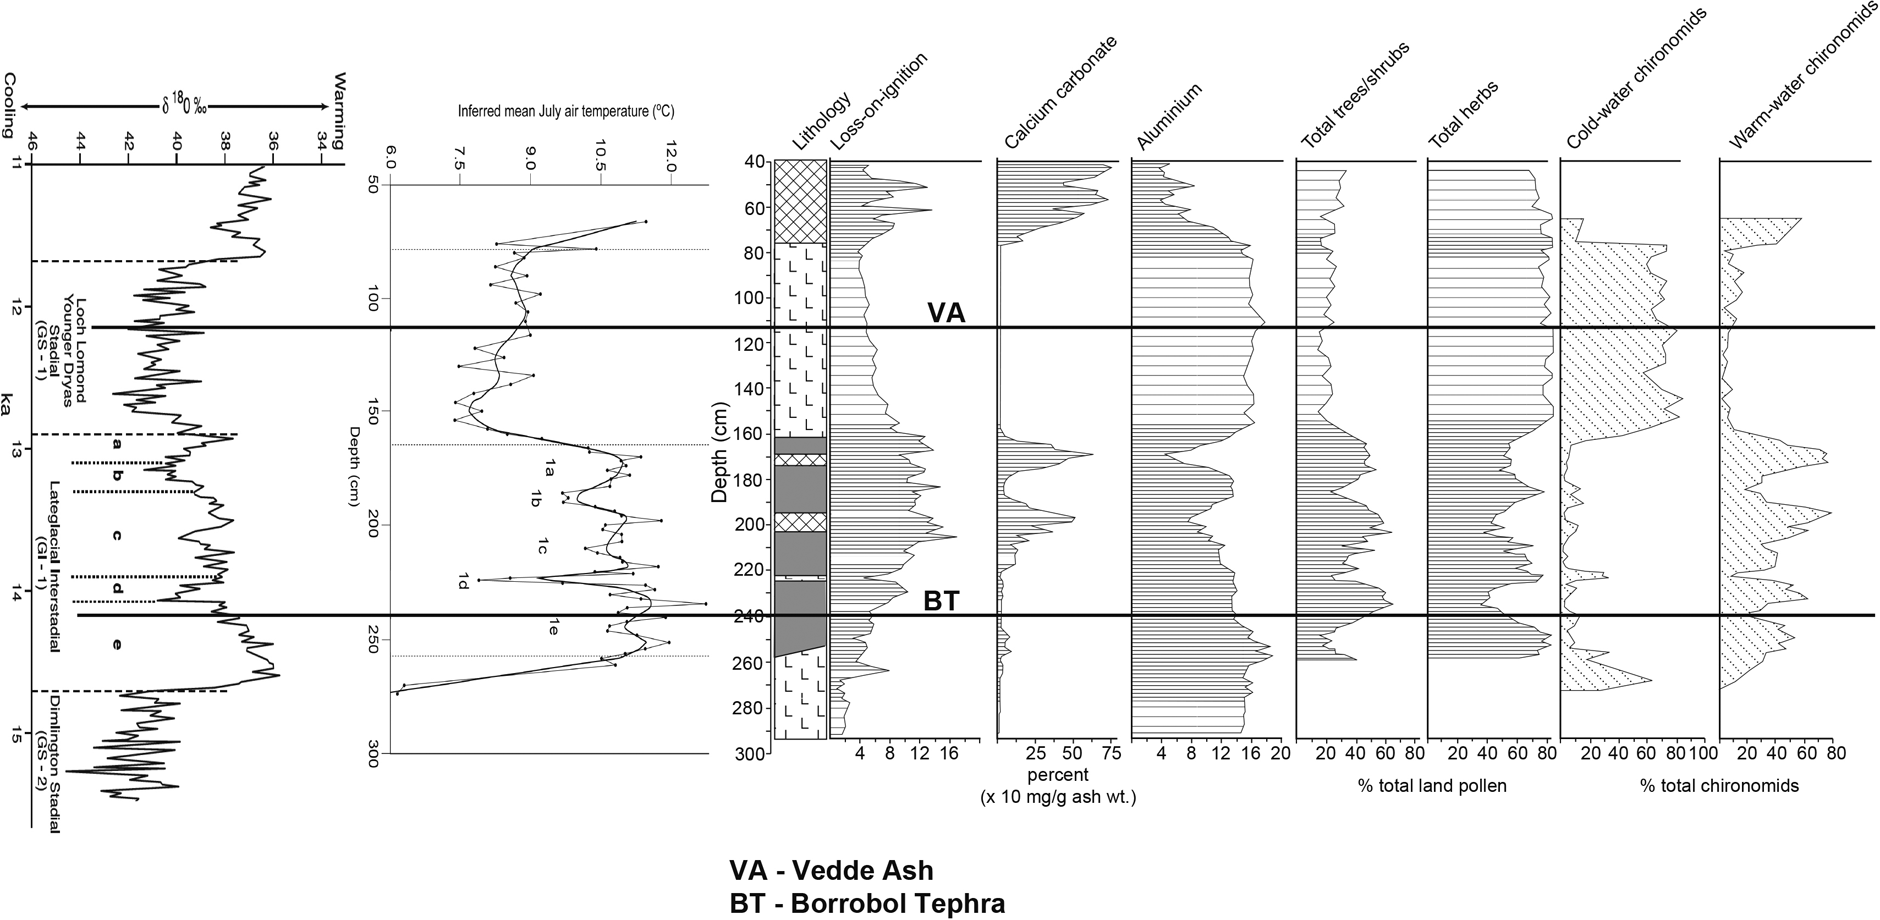
Over the last two decades, an alternative approach to the subdivision of the Lateglacial has been proposed based on the δ18O record in the Greenland ice cores (Björck et al. Reference Björck, Walker, Cwynar, Johnsen, Knudsen, Lowe and Wohlfarth1998; Walker et al. Reference Walker, Björck, Cwynar, Johnsen, Knudsen, Lowe and Wohlfarth1999; Rasmussen et al. Reference Rasmussen, Bigler, Blockley, Blunier, Buchardt, Clausen, Cvijanovic, Dahl-Jensen, Johnsen, Fischer, Gkinis, Guillevic, Hoek, Lowe, Pedro, Popp, Seierstad, Steffensen, Svensson, Vallelonga, Vinther, Walker, Wheatley and Winstrup2014). Stadial and interstadial (and sub-stadial and sub-interstadial) events are numbered backwards in time (Fig. 2) and can be dated precisely using the Greenland GICC05 time scale based on counting of annual ice layers (Rasmussen et al. Reference Rasmussen, Anderson, Svensson, Steffensen, Vinther, Clausen, Siggard-Andersen, Johnsen, Larsen, Bigler, Röthlisberger, Fischer, Goto-Azuma, Hansson and Ruth2006). Greenland Stadial 1 (GS-1: c.12.9–11.7 k yr b2k (before AD 2000)) is broadly equivalent to the Loch Lomond Stadial, while the preceding Greenland Interstadial (GI-1) is equivalent to the Lateglacial/Windermere Interstadial (c.14.7–12.9 k yr b2k), and is subdivided into five sub-interstadial episodes (GI-1e to GI-1a). The preceding GS-2 is equivalent to the Dimlington Stadial. Because the emphasis is on events as opposed to the boundaries between events, the problem of diachronism is less acute in this event-stratigraphical approach than in pollen-based, or indeed in climate-based (where climate is inferred from environmental or climate proxies) subdivisions. This ice-core-based event stratigraphy now provides the template for the Lateglacial throughout the N Atlantic province, and the Greenland ice-core record constitutes the stratotype for stratigraphic subdivision and correlation at the hemispherical scale (Lowe et al. Reference Lowe, Rasmussen, Björck, Hoek, Steffensen, Walker and Yu2008b; Walker et al. Reference Walker, Johnsen, Rasmussen, Popp, Steffensen, Gibbard, Hoek, Lowe, Andrews, Björck, Cwynar, Hughen, Kershaw, Kromer, Litt, Lowe, Nakagawa, Newnham and Schwander2009). Comparisons between the Scottish Lateglacial records and the Greenland sequence are discussed further in sections 4 and 5 (below).
2. Environmental archives
2.1. Pollen records
The first Scottish Lateglacial pollen record, from Garscadden Mains near Glasgow, was published more than 60 years ago (Mitchell Reference Mitchell1952), and since then pollen analysis has become the most widely used technique in reconstructing the spatial and temporal pattern of environmental change in Scotland during the Lateglacial. Some of the most influential of the early work was that by Joachim Donner who, in an extensive research campaign (Donner Reference Donner1957), reinvestigated the Garscadden Mains site and analysed new records from localities in the Oban area, around the margins of the southern Grampian Highlands (Donner Reference Donner1958), and from Garral Hill in Banffshire, the last-named being the first Lateglacial profile in Scotland to be radiocarbon dated (Godwin & Willis Reference Godwin and Willis1959). To the N and W of the Great Glen, the earliest Lateglacial site to be analysed was Loch Droma in Wester Ross (Kirk & Godwin Reference Kirk and Godwin1963), and the radiocarbon date from near the base of the sequence (12,810 ± 155 14C yr BP; c.15.3 k cal. 14C yr BP) is still one of the oldest to be obtained from a Scottish Lateglacial profile. Subsequently, Lateglacial records have been described from most parts of Scotland, and many have been radiocarbon dated. These range from the fringes of the southern uplands (Moar Reference Moar1969a), along the western seaboard to the islands of Mull and Skye (e.g., Lowe & Walker Reference Lowe and Walker1986; Walker & Lowe Reference Walker and Lowe1990; Tipping Reference Tipping1991b), to the far N and NW (e.g., Pennington et al. Reference Pennington, Haworth, Bonny and Lishman1972; Charman Reference Charman1994; Boomer et al. Reference Boomer, von Grafenstein and Moss2012), and to the Orkney and Shetland Islands (Moar Reference Moar1969b; Birnie Reference Birnie2008); and from the Grampian Highlands (e.g., Lowe & Walker Reference Lowe, Walker, Gray and Lowe1977; Birks & Mathewes Reference Birks and Mathewes1978) to the lowlands of eastern Scotland (e.g., Whittington et al. Reference Whittington, Fallick and Edwards1996; Edwards & Whittington Reference Edwards and Whittington2010). In all, around 100 Scottish Lateglacial pollen records have now been published.
Since the pioneering work of Donner, there have been important methodological developments in Lateglacial pollen analysis, many of which continue to have ramifications for pollen-based research at the present day. These include more refined laboratory techniques that have enabled pollen to be extracted from minerogenic sediments of low primary pollen content (e.g., Lowe & Walker Reference Lowe and Walker1986); increased taxonomic precision in pollen identifications (e.g., Birks Reference Birks1973); analysis of deteriorated pollen, which has allowed primary pollen to be distinguished from secondary or reworked grains in Lateglacial pollen assemblages (e.g., Lowe Reference Lowe1978); the division (zonation) of pollen diagrams on the basis of local assemblages as opposed to regionally-imposed schemes (see above); and the application of quantitative methods in pollen zonation (e.g., Pennington & Sackin Reference Pennington and Sackin1975). Over the last two decades, and as emphasised throughout this paper, it has become increasingly common for Lateglacial pollen records to be but one component of multi-proxy palaeoecological and palaeoenvironmental investigations involving, inter alia, fossil insect evidence, geochemical data, and stable isotope signals (e.g., Whittington et al. Reference Whittington, Fallick and Edwards1996; Mayle et al. Reference Mayle, Lowe and Sheldrick1997; Boomer et al. Reference Boomer, von Grafenstein and Moss2012; Brooks et al. Reference Brooks, Matthews, Birks and Birks2012a).
A number of distinctive features that characterise Scottish Lateglacial pollen records can be found in the diagram from Loch Ashik on the Isle of Skye (see Fig. 1). The profile is divided into eleven local pollen assemblage zones (LA-1 to LA-11) based on fluctuations in percentages of the principal pollen taxa. Zones LA-1 to LA-6 span the Lateglacial Interstadial, Zone LA-7 the Loch Lomond Stadial, and LA-8 to LA-11 the early Holocene (Walker & Lowe Reference Walker and Lowe1990; Lowe & Walker Reference Lowe, Walker, Ballantyne and Lowe2016). The earliest zones reflect colonisation of the landscape by open-ground pioneer plants, notably Rumex and Salix (LA-1 to LA-3). This is followed by the expansion of juniper scrub, the peak in Juniperus pollen being a characteristic feature in the early Interstadial across much of Europe (e.g., van Asch & Hoek Reference Van Asch and Hoek2012; Ammann et al. Reference Ammann, van Leeuw, van der Knaap and Tinner2013). During the later Interstadial (LA-6), the pollen record suggests that the landscape around the loch was dominated by ericaceous heath (Empetrum and Erica), perhaps with dwarf birch or isolated patches of tree birch. Open-ground taxa, especially Rumex, are much reduced during this phase. But perhaps of most interest are the changes in zone LA-5, with declines in Juniperus and Empetrum values that coincide with increases in Rumex, Caryophyllaceae, Salix and Lycopodium, a peak in deteriorated pollen (at around 550 cm depth in Figure 1) and reduction in organic carbon content, as the sediment changes from gyttja to clay-gyttja. These data reflect a short-lived climatic deterioration during the late Interstadial, which is considered further below.
In the Loch Lomond Stadial (zone LA-7), birch percentages decline to minimum values, and disturbed ground taxa (Artemisia, Lycopodium (now Huperzia) selago) are more strongly represented. Surprisingly, however, percentages for Empetrum increase significantly during this interval, reaching their highest values in the entire profile. However, many of the pollen grains exhibit signs of exine damage, particularly corrosion (Walker & Lowe Reference Walker and Lowe1990), and are therefore most likely to be of secondary derivation from eroding soils around the catchment. Indeed, up to 70 % of the total pollen grains in some of the spectra were badly damaged, suggesting a high proportion of the pollen in addition to Empetrum is reworked. This is a problem that is commonly encountered in Lateglacial deposits (e.g. Lowe & Walker Reference Lowe and Walker1986), and is exemplified by the Loch Ashik record.
The onset of the Holocene is clearly marked by an abrupt increase in the aquatic taxon Myriophyllum, suggesting a rapid rise in air and water temperatures. The marked reduction in percentages of Empetrum in zone LA-8 reflects stabilisation of catchment soils and a reduction in the influx of reworked material. Zones LA-8 and LA-9 are dominated by open-ground taxa, suggesting an initial Holocene vegetation cover of herb-rich grassland. This was replaced sequentially by Empetrum/Erica, Juniperus, Betula and Corylus scrub and woodland (zones LA-10 and LA-11), a pattern of vegetational succession that is characteristic of pollen profiles from Scotland during the early Holocene.
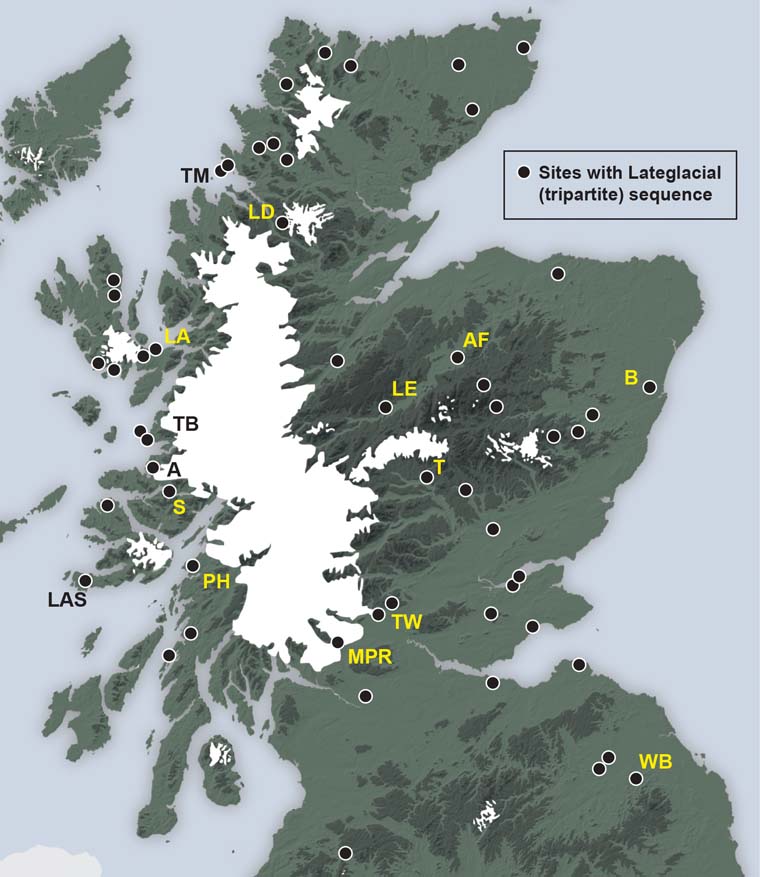
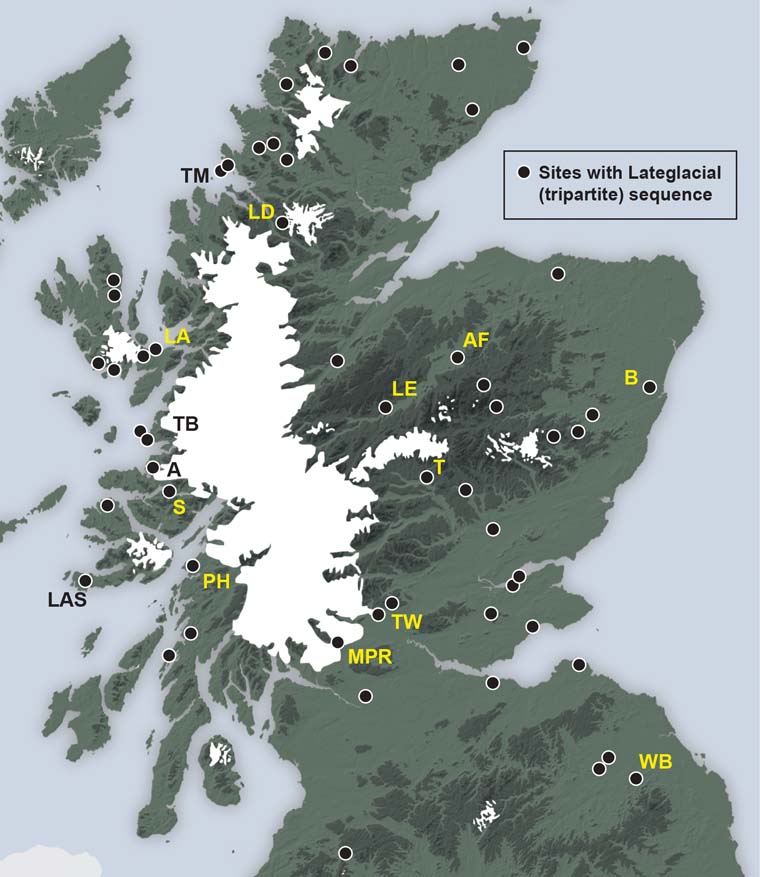
While pollen analytical data have been primarily employed in the reconstruction of Lateglacial plant communites and regional vegetation composition, they have also provided evidence for spatial and temporal patterns of climate change (e.g. Birks & Birks Reference Birks and Birks2014), as well as offering a basis for correlation between lake sediment sequences. In addition, pollen stratigraphic records have been used to constrain the limits of Loch Lomond Readvance glaciers (Fig. 3), working on the principle that a tripartite Lateglacial sediment sequence and associated pollen record will be preserved at sites beyond the ice limits, whereas only Holocene sediments will have accumulated in infilled lake basins inside those mapped limits (see, e.g., Donner Reference Donner1957; Sissons et al. Reference Sissons, Lowe, Thompson and Walker1973; Walker et al. Reference Walker, Ballantyne, Lowe and Sutherland1988; Benn et al. Reference Benn, Lowe and Walker1992).
Distribution of some of the c.100 sites in Scotland from which Lateglacial pollen records have been obtained. Also shown are the mapped limits of Loch Lomond Readvance glaciers (after McDougall Reference McDougall2013). No sites containing Lateglacial Interstadial deposits have yet been found within these glacier limits. Sites mentioned in the text: A = Ardtoe; AF = Abernethy Forest; B = Borrobol; LA = Loch Ashik; LAS = Loch an t'Suidhe; LD = Loch Droma; LE = Loch Etteridge; MPR = Muir Park Reservoir; PH = Pulpit Hill; S = Salen; T = Tirinie; TB = Torr a'Beithe; TM = Tanera Mor; TW = Tynaspirit West; WB = Whitrig Bog.
2.2. Plant macrofossil records
Plant macrofossils are also important sources of palaeoecological and palaeoclimatic data. Many Lateglacial pollen assemblages often contain an admixture of local and far-travelled pollen, while some appear to have no recognisable modern analogue and may have been derived from vegetation types that do not occur at the present day. By contrast, contemporaneous plant macrofossil assemblages can readily be interpreted in terms of modern vegetation communities, while the individual macrofossils are generally far less travelled than pollen. In addition, unlike many pollen grains, plant macrofossils can usually be identified to species level. Hence, plant macrofossil assemblages provide a more secure basis for reconstructing plant communities, as well as for validating climate reconstructions obtained from the pollen record (Birks & Birks Reference Birks and Birks2000; Birks Reference Birks2003). It is somewhat surprising therefore that, despite the fact that the earliest Lateglacial publications referred to above, Whitrig Bog and Garscadden Mains, both contained tabular records of the plant macrofossils from the two profiles (Mitchell Reference Mitchell1948, Reference Mitchell1952), relatively few Lateglacial profiles from Scotland have since been investigated for their plant macrofossil content. The reasons for this may partly be due to the fact that in many Lateglacial sedimentary sequences, plant macrofossils are either absent or scarce; moreover, most lake cores have been taken in open or deeper water where fewer macrofossils (by contrast with littoral locations) are preserved. However, it is also the case that relatively few plant macrofossil specialists have been attracted by Scottish Lateglacial records, with a greater focus being on Holocene profiles where macrofossils are often present in greater abundance. Those sites that have been investigated for their plant macrofossil content include Abernethy Forest in Speyside (Birks & Mathewes Reference Birks and Mathewes1978), Morrone in Aberdeenshire (Huntley Reference Huntley1994) and Lochan an Druim in NW Scotland (Birks Reference Birks, Haworth and Lund1984, Reference Birks2003).
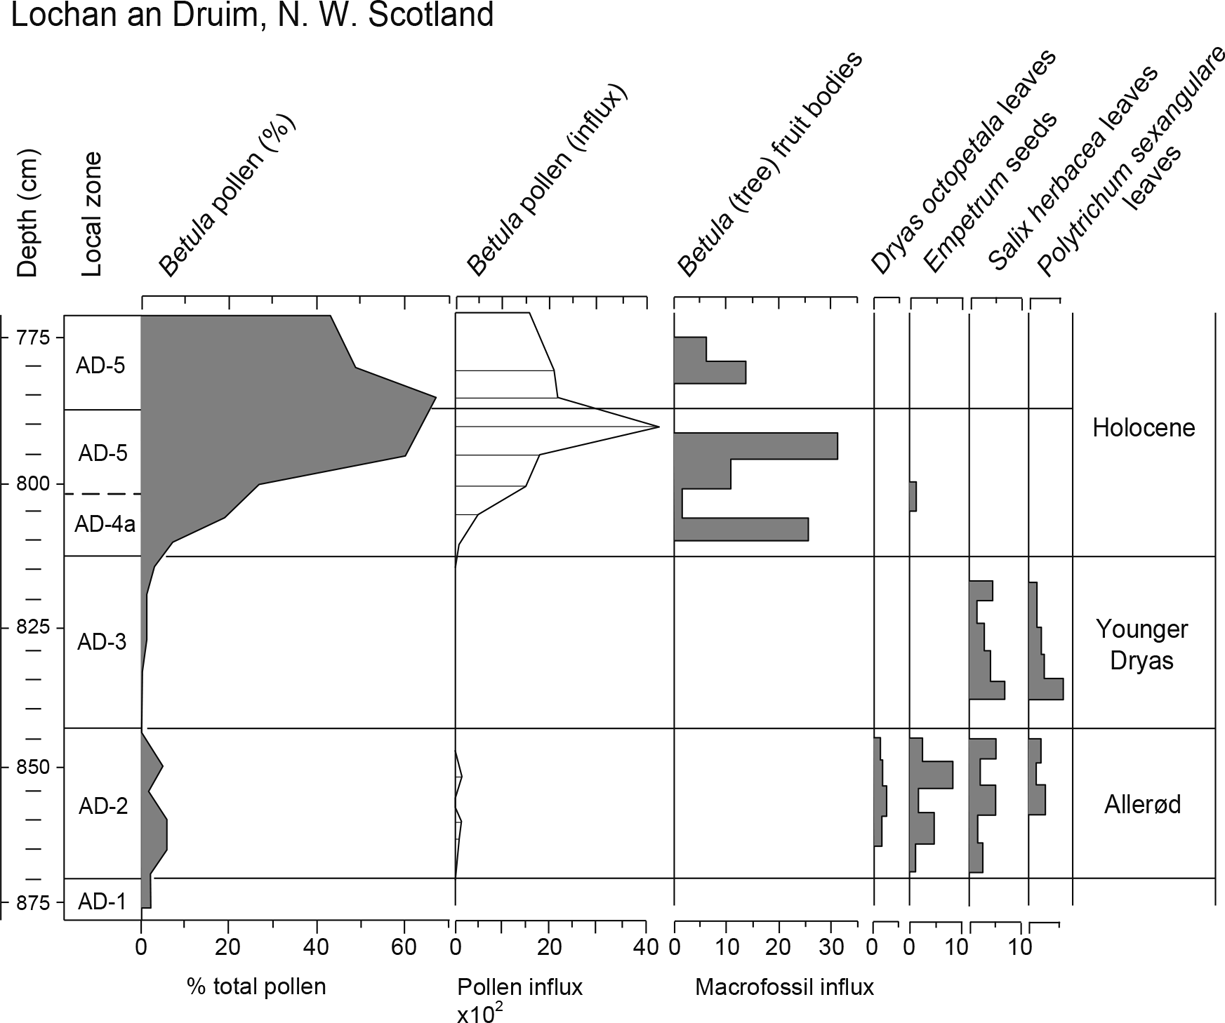
The Lochan an Druim profile (Fig. 4) provides an example of the value of plant macrofossil records in reconstructing former vegetation cover. Although there is a consistent record of Betula pollen throughout the Lateglacial Interstadial, no macrofossils of birch are recorded in sediments that accumulated during this period. At this site located in the far NW of Scotland, therefore, it seems likely that the Betula pollen signal is not reflecting the local presence of tree birch, but rather that the birch pollen originated some distance away to the south where birch woodland had gained a foothold during the Lateglacial. At the beginning of the Holocene, by contrast, abundant tree birch fruits accompany the rise in the birch pollen curve (zone AD-4), suggesting that by this time tree birch had become established locally.
Variations in influx of selected plant macrofossils in the Loch an Druim basin, NW Scotland during the Lateglacial period, compared with the record for birch pollen (from Birks Reference Birks2003).

A further aspect of plant macrofossils is that they can provide a more reliable basis for radiocarbon dating of Lateglacial sequences than bulk samples of sediment, for age estimates from the latter are frequently compromised by hard-water or mineral carbon error (see below). As a consequence, plant macrofossils, especially from terrestrial plants, are now the preferred dating medium in the construction of radiocarbon-based age models (e.g., MacLeod et al. Reference MacLeod, Palmer, Lowe, Rose, Bryant and Merritt2011; Matthews et al. Reference Matthews, Birks, Bourne, Brooks, Lowe, MacLeod and Pyne-O'Donnell2011).
2.3. Coleopteran records
Although fossil Coleoptera have been widely employed as a basis for reconstructing climatic changes during the Lateglacial in both Britain and NW Europe (e.g., Atkinson et al. Reference Atkinson, Briffa and Coope1987; Coope & Lemdahl Reference Coope and Lemdahl1995; Coope et al. Reference Coope, Lemdahl, Lowe and Walkling1998; Elias & Matthews Reference Elias and Matthews2014), the coleopteran record from Scotland is patchy in both space and time, and no published site contains a complete record from the beginning of the Lateglacial into the early Holocene (Buckland & Sadler Reference Buckland, Sadler, Edwards and Ralston1997). This is partly a reflection of the small number of beetle specialists that have worked on the Scottish Lateglacial, but is also due to the fact that substantial quantities of sediment (several kg) are required for coleopteran analysis, in order to produce an adequate sample size; hence open sections (as opposed to sediment cores) are needed and, to date, relatively few such sequences of Lateglacial age have been exposed.
The earliest beetle records from Scotland date from the end of the 19th Century, with discoveries by James Bennie of insect fossils of likely Lateglacial age at Burnhead, near Airdrie (Coope Reference Coope1962) and in Lateglacial sediments at Corstorphine near Edinburgh (Coope Reference Coope1968). The first systematic analysis of Lateglacial Coleoptera, however, was from sections in SW Scotland, at Roberthill, Redkirk Point and Bigholm Burn in the Solway lowlands, and Sanquhar to the N in Nithsdale (Bishop & Coope Reference Bishop, Coope, Gray and Lowe1977). A Lateglacial age for these four sites was confirmed on the basis of lithostratigraphic evidence, and corroborated at the first three by radiocarbon dates. Elsewhere in Scotland, a radiocarbon-dated Loch Lomond Stadial insect fauna was recovered from Croftamie on the eastern margin of the Loch Lomond basin (Coope & Rose Reference Coope and Rose2008), coleopteran assemblages of both Lateglacial Interstadial and Loch Lomond Stadial age have been described from Torrie near Callander in the Teith Valley, Perthshire (Merritt et al. Reference Merritt, Coope, Taylor and Walker1990), while in the far north a radiocarbon-dated coleopteran record has been obtained from deposits of Lateglacial and early Holocene age at Clettnadal, West Burra Island, Shetland (Whittington et al. Reference Whittington, Buckland, Edwards, Greenwood, Hall and Robinson2003).
Fossil coleopteran assemblages provide evidence of contemporaneous local habitats and co-dependent plants and animals (Elias Reference Elias and Elias2013), but perhaps their most important application is in the reconstruction of past climatic regimes. A number of species are stenothermic, which allows former thermal conditions, especially summer temperatures, to be inferred. For example, coleopteran records from sites in the Solway Lowlands indicate mean July temperatures of around 15°C during the early Lateglacial Interstadial, falling to 12°C during the later interstadial and to ∼10°C during the Loch Lomond Stadial (Bishop & Coope Reference Bishop, Coope, Gray and Lowe1977). Similar evidence from the Torrie site suggests mean July temperatures during the Loch Lomond Stadial of, or just below, 10°C (Merritt et al. Reference Merritt, Coope, Taylor and Walker1990); while fossil beetle data from Croftamie indicate mean annual temperatures at that time of around −5oC (Coope & Rose Reference Coope and Rose2008). On a broader scale, palaeotemperature estimates based on fossil beetle assemblages from a number of Scottish sites formed part of a reconstruction of thermal gradients across NW Europe during the Lateglacial and early Holocene. This showed that while at times the thermal climate was fairly uniform across the European landmass, at other times the temperature gradients were much steeper than they are at the present day (Coope et al. Reference Coope, Lemdahl, Lowe and Walkling1998); a trend that is reinforced by fossil chironomid data (Brooks & Langdon Reference Brooks and Langdon2014), and which is considered in the following section.
2.4. Chironomid records
Chironomids are non-biting midges that are often abundant over lakes and ponds; this is the adult (midge) stage in their life cycles, which usually only lasts a few days. They exist for much longer periods as larvae on the lake or pond bottom, and it is the head capsules of this larval stage that are preserved as fossils in lake sediments (Brooks et al. Reference Brooks, Langdon and Heiri2007). Most chironomid species are climate-sensitive, with varying tolerances to summer air temperature, and this provides a basis for reconstructing past temperature regimes (Brooks & Langdon Reference Brooks and Langdon2014). Large numbers of head capsules can be recovered from very small sediment samples (1 cm3 or less), which enables palaeotemperature records to be generated at a much higher stratigraphical and temporal resolution than is possible with, for example, beetle remains. The first chironomid-based stratigraphy from a Scottish Lateglacial site was obtained from Whitrig Bog in the Scottish Borders (Brooks et al. Reference Brooks, Mayle and Lowe1997a), and a palaeotemperature record (chironomid-inferred temperature record: C-IT record) was subsequently derived from this sequence (Brooks & Birks Reference Brooks and Birks2000). Since then, three more Lateglacial C-IT curves have been published: from Abernethy Forest in the Spey Valley (Matthews et al. Reference Matthews, Birks, Bourne, Brooks, Lowe, MacLeod and Pyne-O'Donnell2011); from Loch Ashik on the Isle of Skye (Brooks et al. Reference Brooks, Matthews, Birks and Birks2012a); and from Muir Park Reservoir near the southern margin of Loch Lomond (Brooks et al. Reference Brooks, Davies, Mather, Matthews and Lowe2016). These are discussed further in section 5.2.
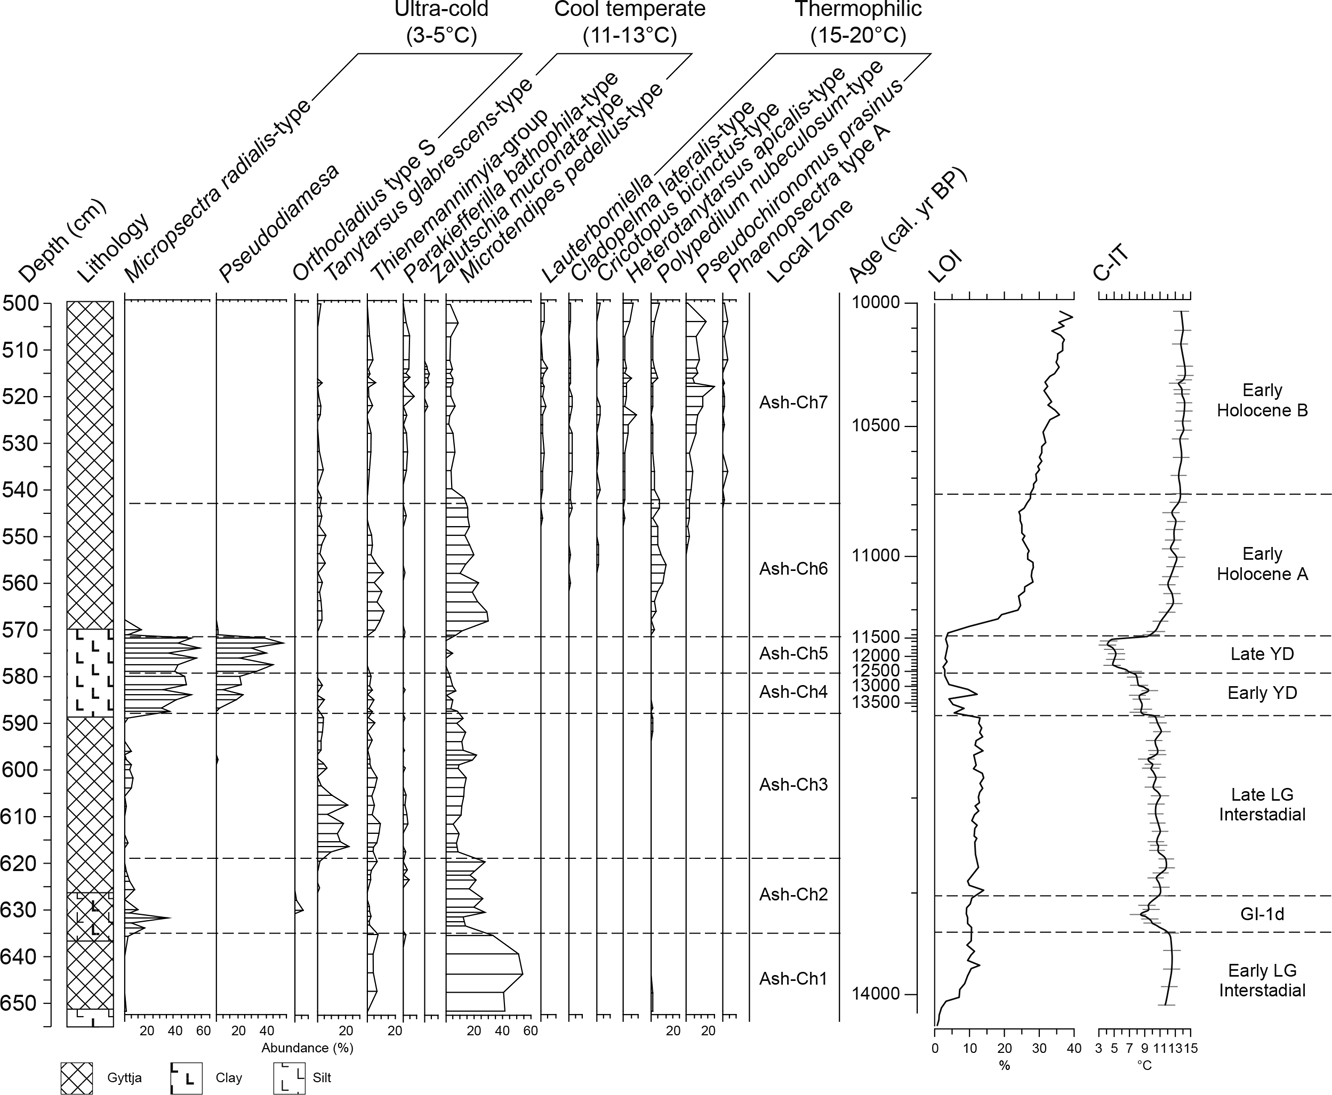
The Lateglacial–early Holocene sequence from Loch Ashik shows how high-resolution climatic reconstructions can be obtained from chironomid records. In the diagram (Fig. 5), selected climatic indicator taxa are classified as either ‘ultra-cold’ or ‘thermophilous’; the former dominate the assemblages at times when mean temperatures were no warmer than 3–5°C, while the latter reflect mean July temperatures of between ∼15°C and 20°C. Other taxa have intermediate thermal requirements, the data overall suggesting that cool temperate conditions (mean July temperatures of ∼11°C to 13°C) prevailed throughout most of the Lateglacial Interstadial, although there is a markedly colder event in zone Ash-Ch2 reflected, in particular, by a prominent peak in values for the ultra-cold species Micropsectra radialis-type. This coincides with the Interstadial oscillation in the pollen record (Fig. 1, pollen zone LA-5), noted above. Other palaeoclimatic inferences that can be drawn from these data are discussed in section 5.
Chironomid stratigraphy (selected taxa only), lithostratigraphy and quantified temperature reconstructions for the Lateglacial–early Holocene sediment sequence in Loch Ashik, Skye (modified from Brooks et al. Reference Brooks, Matthews, Birks and Birks2012a). Abbreviations: C-IT = chironomid-inferred temperatures (July mean); LG = Lateglacial; LOI = loss-on-ignition; YD = Younger Dryas/Loch Lomond Stadial. The timescale is based on ages of tephra isochrons (see below).

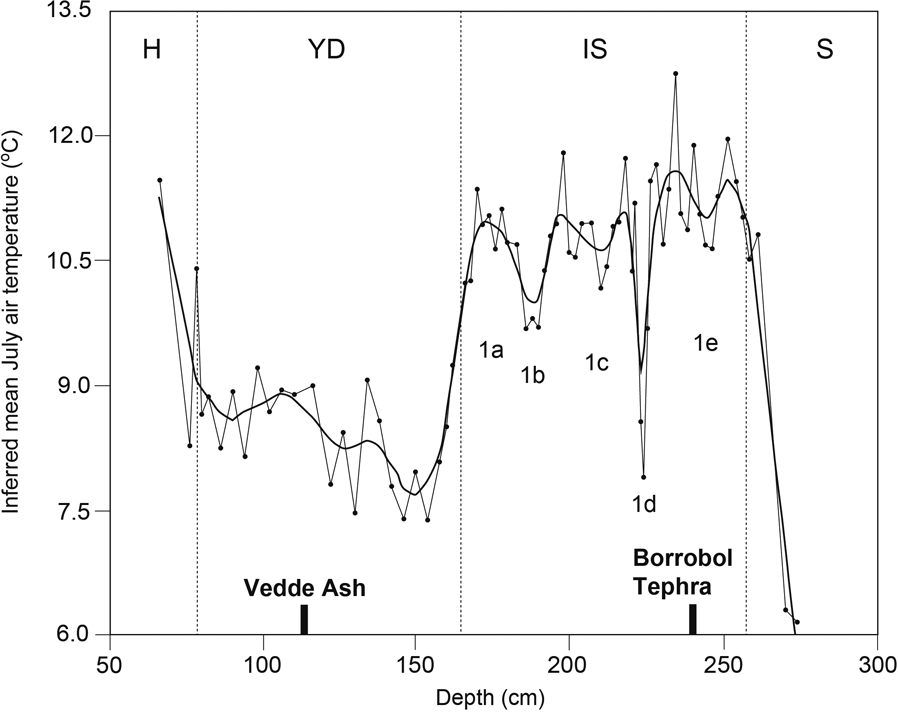
The most significant feature of the chironomid record, however, is the fall in temperatures during zones Ash-Ch4 and Ash-Ch5 (∼13,100–11,400 cal. 14C yr BP) which correspond to the Loch Lomond Stadial, and to the GS-1 (∼Younger Dryas) event in the Greenland stratotype sequence. Mean July temperatures initially decline gradually, then more abruptly, to reach lowest values (around or less than 5°C) during the later Stadial. The visible Vedde Ash layer (Fig. 1) lies close to, but just above, the boundary between these two climatic episodes. The Loch Lomond Stadial appears to have terminated abruptly, with a rise in mean July temperatures of around 6–8°C at the start of the Holocene (c.570 cm in the profile), after which temperatures remained relatively stable and consistently above 11°C. The Loch Lomond Stadial C-IT records are similar to palaeotemperature reconstructions based on glacier equilibrium line altitudes (ELAs), which suggest mean July sea-level temperatures on Skye of around 6°C (Ballantyne Reference Ballantyne1989).
The C-IT reconstructions from Scottish Lateglacial sites can be compared with climatic inferences obtained from fossil Coleoptera from sites in SW Scotland lying close to modern sea level (Bishop & Coope Reference Bishop, Coope, Gray and Lowe1977; Coope et al. Reference Coope, Lemdahl, Lowe and Walkling1998), and these reveal both similarities and differences between the two records. The coleopteran-based temperature data suggest an early Interstadial maximum in southern Scotland of 16–17°C, which is 3–4°C higher than maximum chironomid-inferred temperatures. Later in the Interstadial, however, coleopteran records indicate temperatures of 10–14°C, which falls within the error range for corresponding C-IT estimates (see Fig. 12). Overall, the decline in Lateglacial Interstadial temperatures recorded by the Coleoptera is not reflected in chironomid records (see section 5.1), but it is similar to the trend of falling temperatures implied by the isotopic record from the Greenland ice cores (Rasmussen et al. Reference Rasmussen, Bigler, Blockley, Blunier, Buchardt, Clausen, Cvijanovic, Dahl-Jensen, Johnsen, Fischer, Gkinis, Guillevic, Hoek, Lowe, Pedro, Popp, Seierstad, Steffensen, Svensson, Vallelonga, Vinther, Walker, Wheatley and Winstrup2014). During the Loch Lomond Stadial, coleopteran-based temperatures for southern Scotland are ∼8.5°C (i.e., 1–1.5°C warmer than the chironomid-inferred estimates for Whitrig Bog and Abernethy Forest, although still within the C-IT error estimates), but they are similar to the Loch Ashik reconstructions for the early Loch Lomond Stadial (Brooks et al. Reference Brooks, Matthews, Birks and Birks2012a). However, if the altitudes of Whitrig Bog (170 m) and Abernethy Forest (220 m) are taken into account, and an environmental lapse rate of 0.6–0.7°C 100 m–1 is applied, this yields a nominal sea-level temperature for the coldest part of the Loch Lomond Stadial at the two sites of ∼8.5°C (Benn & Ballantyne Reference Benn and Ballantyne2005), which is equivalent to the temperature estimates based on coleopteran evidence. It is also comparable with temperature reconstructions inferred from Loch Lomond Stadial glacier ELAs, which suggest temperatures for the SE Grampian Highlands of ∼4–5°C, or ∼6.5°C at sea level (Sissons Reference Sissons1974; Sissons & Sutherland Reference Sissons and Sutherland1976).
2.5. Diatoms
Diatoms are single-celled algae that are often abundant in freshwater planktonic and benthic biotic communities. Many species are highly sensitive to environmental changes, and thus are one of the most important proxies for monitoring water quality and chemistry (Moser et al. Reference Moser, MacDonald and Smol1996). Although a Lateglacial diatom record had earlier been obtained from Loch of Park in Aberdeenshire (Alhonen Reference Alhonen1968), the use of diatom assemblages for reconstructing lake histories in Scotland during the Lateglacial was essentially pioneered by Winifred Pennington and colleagues (Pennington et al. Reference Pennington, Haworth, Bonny and Lishman1972) in a multi-proxy study of the environmental history of lakes in northern Scotland. This work combined diatom data with the results of pollen and geochemical analyses, and the diatom succession from one of the sites, Loch Sionascaig in Ross-shire, was the first from a large deep-water lake in Scotland (Haworth Reference Haworth1976). Subsequently, diatom records have been obtained from Linton Loch in Roxburghshire in the Scottish Borders (Mannion Reference Mannion1978), and from Clettnadal in the Shetland Islands (Robinson Reference Robinson2004). These Scottish Lateglacial diatom assemblages are often impoverished in terms of both species diversity and abundance, and especially so during the Loch Lomond Stadial. It seems that this is largely a consequence of relatively high minerogenic inwash into the lake basins and the persistence of oligotrophic water bodies (low nutrient content and high oxygenation levels); conditions which resemble those in present-day alpine lakes (Haworth Reference Haworth1976).
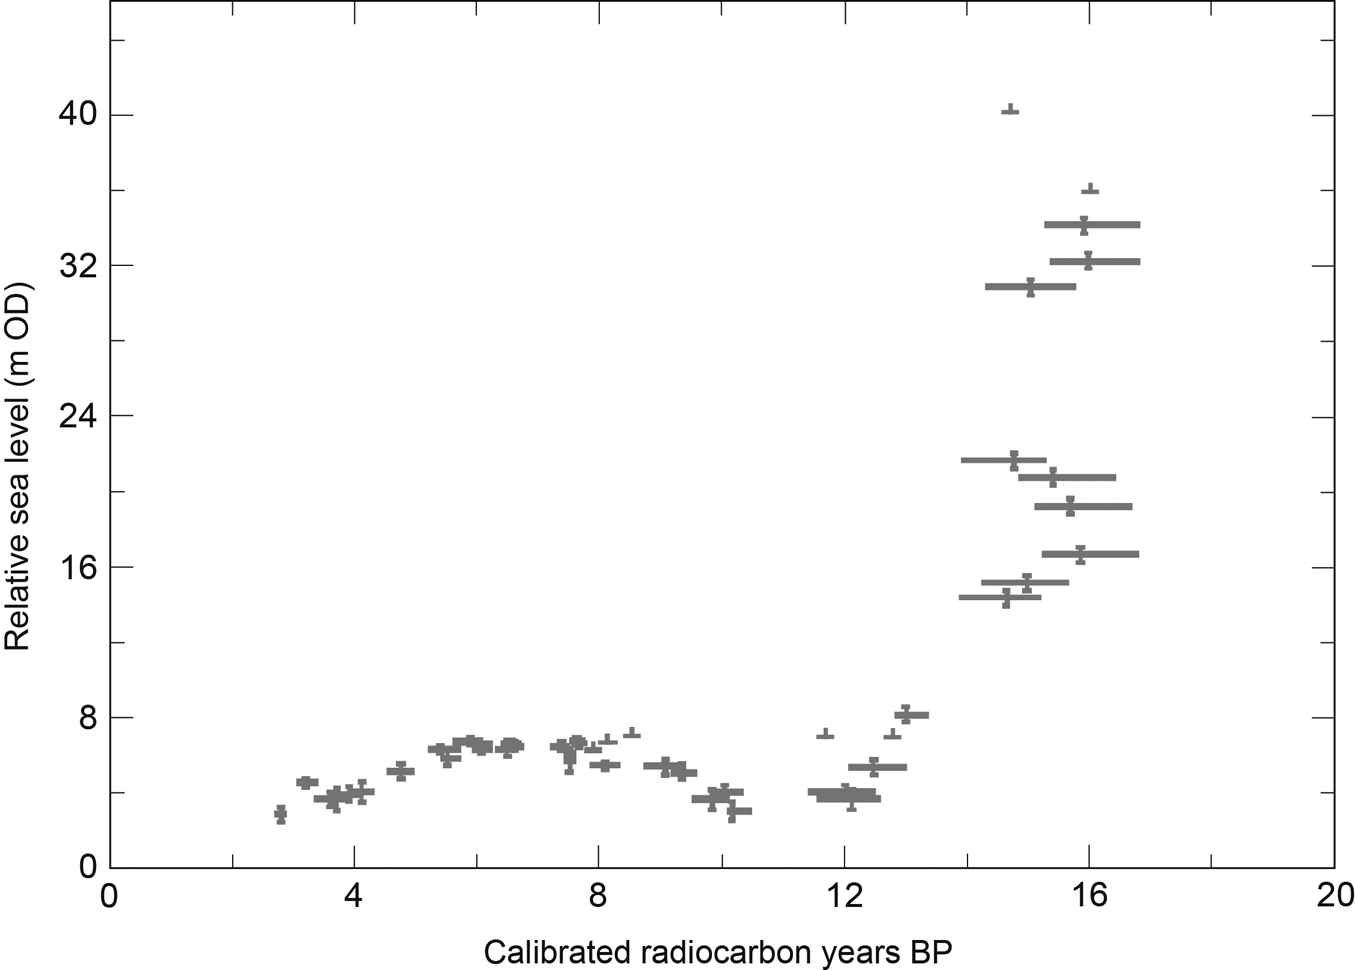
Diatoms are especially useful as palaeo-salinity indicators, for some species prefer saline conditions (polyhalobous species) while others (oligohalobous) are intolerant of even mildly saline water. By determining the dominant diatom species in Lateglacial sediments in lake basins lying close to the Scottish coastline, inferences can be made about the history of sea-level change following the recession of the last ice sheet. As littoral rock basins became exposed, some remained below local mean tide level, and hence were occupied by salt water. With further ice wastage, however, these basins eventually emerged from the sea, and became freshwater ponds or lakes. The change from predominantly saline to non-saline conditions, when the basin was isolated from the sea, can be determined on the basis of diatom stratigraphy (Shennan et al. Reference Shennan, Lambeck, Horton, Innes, Lloyd, McArthur, Purcell and Rutherford2000). By dating these isolation horizons in a number of sites, a detailed history of local sea-level variations throughout the Lateglacial period can be obtained (Fig. 6. The evidence from these ‘isolation basins’ therefore serves two purposes: it can provide minimal ages for local deglaciation, and also evidence for the magnitude of consequent isostatic response (Bradley et al. Reference Bradley, Milne, Shennan and Edwards2011).
Variations in mean sea level in the area around Arisaig, NW Scotland, between ∼16 ka and 4 ka, based on evidence from isolation basins and (in part) on diatom-inferred isolation horizons (modified from Bradley et al. Reference Bradley, Milne, Shennan and Edwards2011). Note the rapid isostatic recovery between 16 ka and 12 ka, and comparatively smaller changes in relative sea level thereafter.

2.6. Stable isotope records
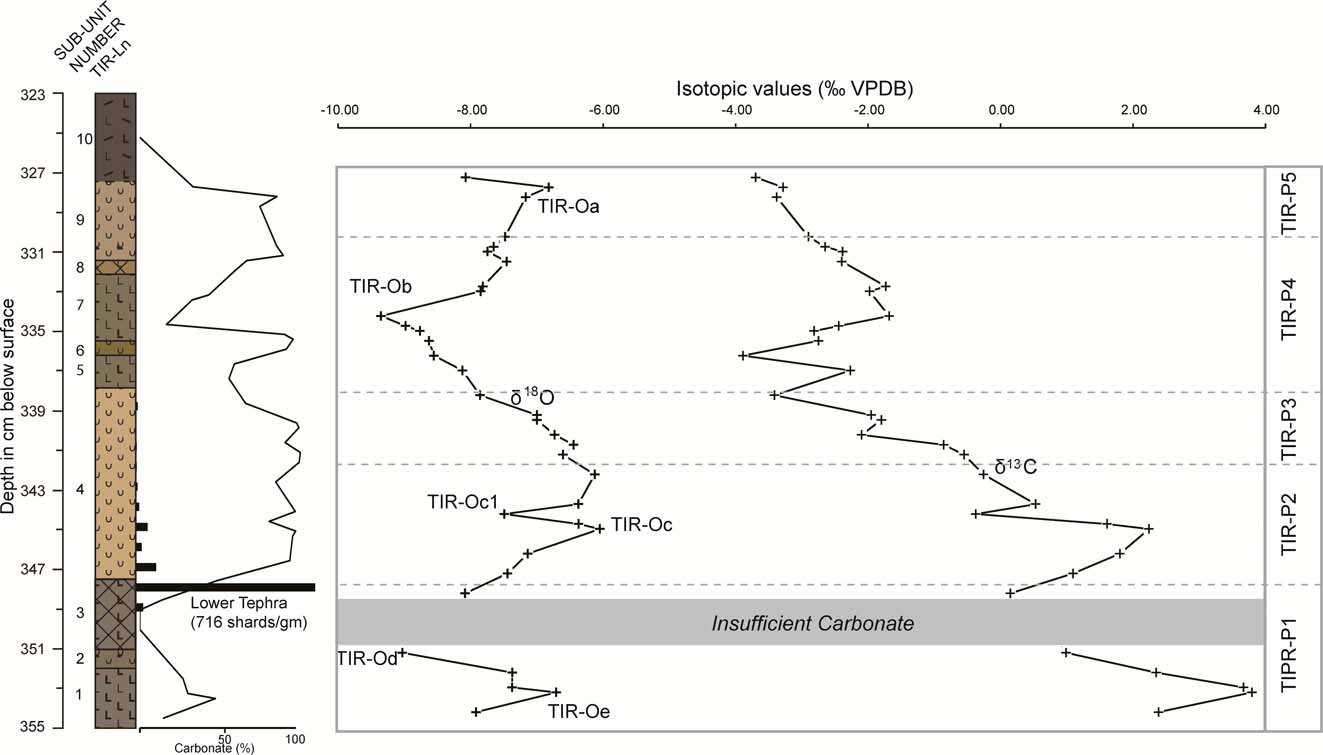
Measurements of the ratios of stable isotopes of oxygen and carbon in sediment sequences can provide independent proxies of former climatic conditions that can be compared with climatic inferences from biological evidence (Marshall et al. Reference Marshall, Jones, Crowley, Oldfield, Nash and Bedford2002; Leng & Marshall Reference Leng and Marshall2004). They are potentially extremely valuable as palaeoclimatic indicators for, as with chironomids, stable isotope values respond rapidly to shifts in climate. This contrasts with botanical data, where climatic-driven changes in plant communities are often slower and therefore less well marked in fossil records; hence short-lived and/or low amplitude climate changes may not be reflected in pollen and/or plant macrofossil stratigraphies (section 4.3). In Scotland, only three records of oxygen isotope variations during the Lateglacial have so far been published: Crudale Meadow on Mainland, Orkney (Whittington et al. Reference Whittington, Edwards, Zanchetta, Keene, Bunting, Fallick and Bryant2015); Lundin Tower in eastern Scotland (Whittington et al. Reference Whittington, Fallick and Edwards1996); and Tirinie in the eastern Grampian Highlands (Candy et al. Reference Candy, Abrook, Elliott, Lincoln, Matthews and Palmer2016); of which the last-named is the best resolved (Fig. 7). Although stable isotope data can be obtained from diatoms (Leng & Barker Reference Leng and Barker2006), no such diatom-based records have so far been recovered from sites in Scotland, and oxygen isotope profiles have been obtained only from calcareous deposits (marls). Crudale Meadow, Lundin Tower and Tirinie all contain marl, but these calcareous sediments accumulated only during the Lateglacial Interstadial and early Holocene when the climate was relatively mild; conditions were too cold for marl pecipitation during the Loch Lomond Stadial or in other shorter-lived cooler episodes (e.g., sub-unit 3 in the lower part of the sediment sequence in Figure 7), and hence there are no isotopic data from these levels in the profile.
Litho- and stable-isotope stratigraphy of the Lateglacial Interstadial sediments at Tirinie, Grampian Highlands, Scotland (from Candy et al. Reference Candy, Abrook, Elliott, Lincoln, Matthews and Palmer2016). For explanation, see text.

The δ18O record from Tirinie suggests that the Lateglacial Interstadial was characterised by three warm intervals (δ18O peaks TIR-Oe, TIR-Oc, TIR-Oa), separated by two colder episodes (δ18O declines TIR-Od, TIR-Ob); although a third cold interval (TIR-Oc1) may be recorded in TIR-Oc (Candy et al. Reference Candy, Abrook, Elliott, Lincoln, Matthews and Palmer2016). While the Crudale Meadow oxygen isotope record for the Interstadial is more compressed than that for Tirinie, it nevertheless shows a very similar sequence of climatic oscillations, including an equivalent to TIR-Oc1, the less well developed cold reversal (Whittington et al. Reference Whittington, Edwards, Zanchetta, Keene, Bunting, Fallick and Bryant2015). However, the amplitude of oxygen isotopic variations during the Interstadial is greater in the Tirinie record than in other δ18O records reported from the British Isles, possibly suggesting higher sensitivity to climatic variations in the eastern Grampians at that time. There is a degree of uncertainty here, however, since a range of other non-climatic factors (e.g., changes in lake level) are known to influence stable isotope ratios in lakes (Leng & Marshall Reference Leng and Marshall2004; Leng & Barker Reference Leng and Barker2006).
Less well understood are the possible connections between climatic parameters and variations in carbon isotope ratios in Lateglacial sediment sequences. While a broad correspondence between carbon and oxygen isotopes characterises the Crudale Meadow record (Whittington et al. Reference Whittington, Edwards, Zanchetta, Keene, Bunting, Fallick and Bryant2015), and there does appear to be a general correspondence between the δ18O and δ 13C ‰ records in Figure 7, the major changes in stable isotope values are not synchronous, and a test of co-variance on the Tirinie data generated a low r2 value (Candy et al. Reference Candy, Abrook, Elliott, Lincoln, Matthews and Palmer2016). Indeed, other studies have shown that the relationships between carbon and oxygen isotopes in bulk sediment samples are often inconsistent (Turney et al. Reference Turney, Beerling, Harkness, Lowe and Scott1997a, Reference Turney, Harkness and Lowe1998). At present, therefore, the value of carbon isotopes from lake sediments as a climatic proxy remains uncertain.
2.7. Geochemical records (lake sediments: landscape change)
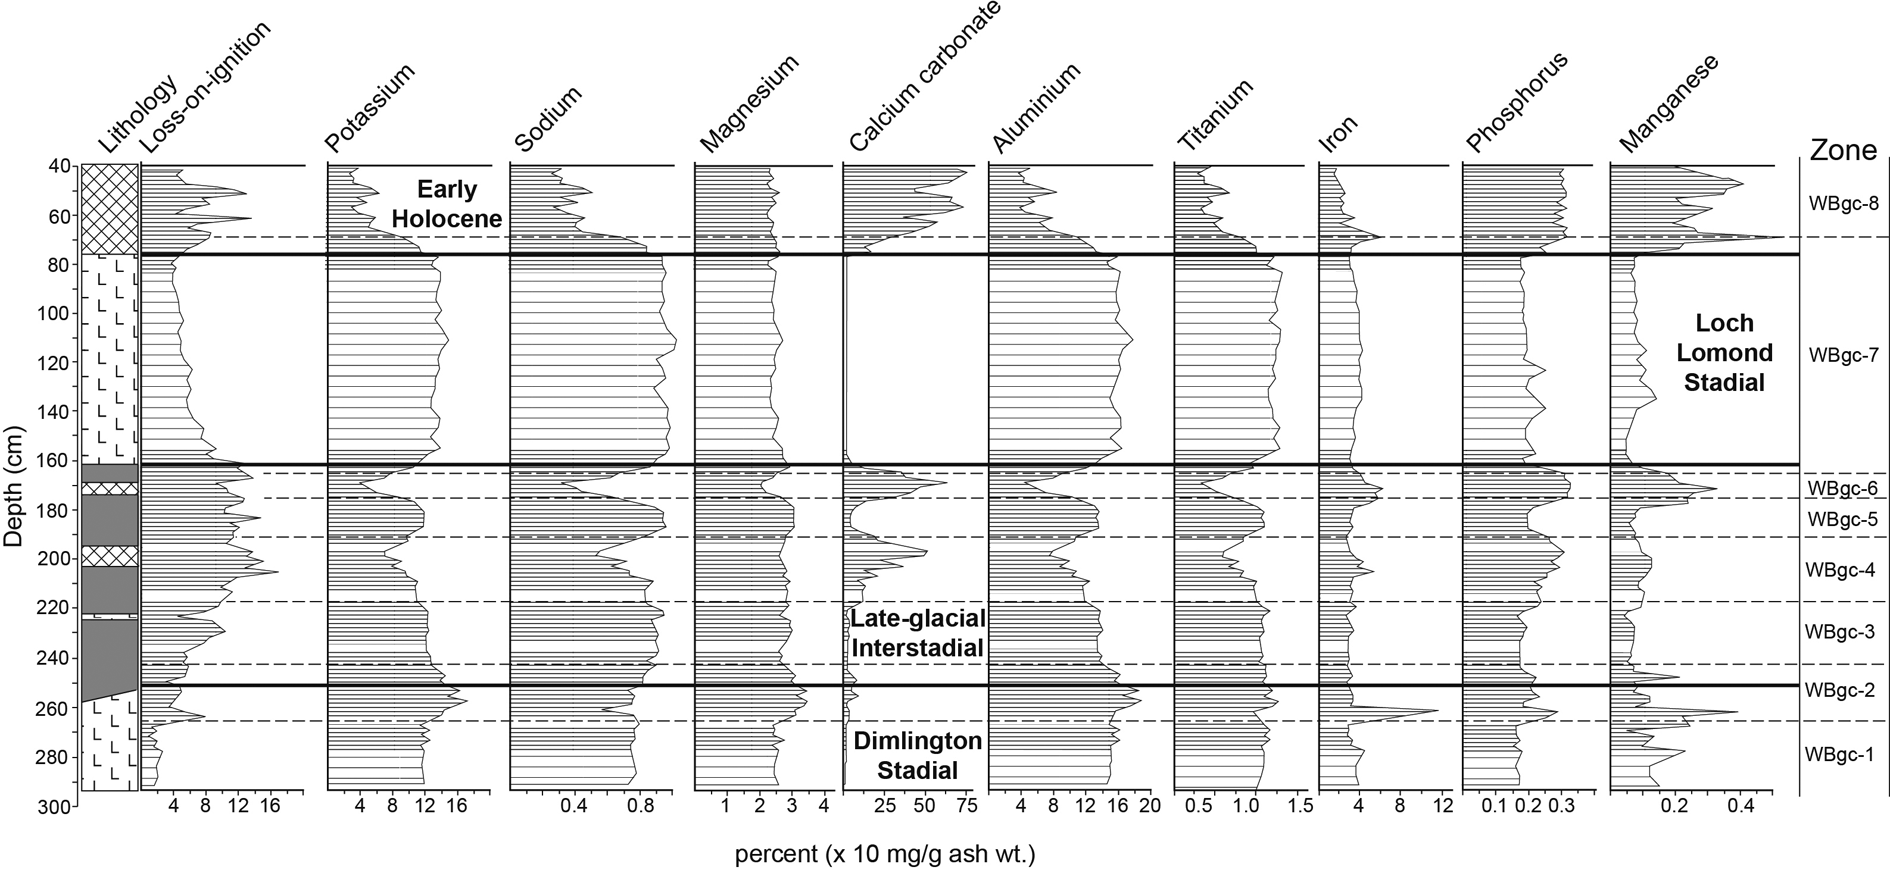
Pennington et al.'s (Reference Pennington, Haworth, Bonny and Lishman1972) seminal work on Lateglacial lake records in northern Scotland showed that variations in concentrations of chemical elements could provide evidence for erosional histories of lake catchments. Subsequent studies have demonstrated how sediments that accumulated during colder events, particularly during the Loch Lomond Stadial, consistently contain higher concentrations of metallic elements, such as Na, K, Mg, Fe, Mn, Al and Ti (Lowe & Walker Reference Lowe and Walker1986; Walker & Lowe Reference Walker and Lowe1990). The record from Whitrig Bog (Fig. 8), for example, shows that concentrations of most elements are anti-phased with calcium carbonate: the latter are associated with episodes of marl formation, while the former reflect influx of unleached mineral soils from the catchment (Engstrom & Wright Reference Engstrom, Wright, Haworth and Lund1984; Mayle et al. Reference Mayle, Lowe and Sheldrick1997). These records therefore differentiate intervals of catchment stability (marl/CaCO3 deposition) from episodes of increased soil erosion. Although the data are based on bulk sediment measurements, and it may be difficult to distinguish between authigenic and allogenic derivation of the elements, particularly in the cases of P, Fe and Mn (Mayle et al. Reference Mayle, Lowe and Sheldrick1997), there are, nonetheless, clear trends in the datasets, and these accord with independent evidence for minor climatic oscillations during the Lateglacial Interstadial (zones WBgc-2 to WBgc-6), with the Loch Lomond Stadial (zone WBgc-7), and with the transition into the Holocene. This, in turn, suggests that the changes in sediment chemistry were driven by regional climatic changes (Lowe et al. Reference Lowe, Birks, Brooks, Coope, Harkness, Mayle, Sheldrick, Turney and Walker1999).
The geochemical record in the Lateglacial sequence at Whitrig Bog, Scottish Borders, measured by ICP-AES (inductively coupled plasma atomic emission spectroscopy) and expressed as the oxides of the respective elements, where 1 % = 10 mg g–1.

2.8. Evidence for human activity
Evidence for human occupation and activity during the Lateglacial in Scotland is extremely limited, and restricted to isolated findspots which are, in the main, poorly contextualised and dated. These include artefacts from Fairnington, Roxburghshire, Kilmelfort Cave, Argyll, Balevulin on the island of Tiree, and Shieldaig in Wester Ross. On the basis of cultural associations with dated assemblages in NW Europe, these might indicate human presence early in the Lateglacial Interstadial (Fairnington) and in the mid-late Interstadial (Kilmelfort Cave), with the Balevulin and Shieldaig finds possibly dating to the later Loch Lomond Stadial (Ballin & Saville Reference Ballin and Saville2003; Saville & Ballin Reference Saville and Ballin2009; Mithen et al. Reference Mithen, Wicks, Pirie, Riede, Lane, Banerjea, Cullen, Gittins and Pankhurst2015). Suggestions that reindeer antler fragments from the Creag nan Uamh cave system in Assynt, radiocarbon-dated to 10,080 ± 70 14C yr BP (c.11.8–11.6 k cal 14C yrs BP), may be indicative of human activity (Lawson & Bonsall Reference Lawson and Bonsall1986; Lawson Reference Lawson, Gordon and Sutherland1993), appear now to have been discounted (Saville Reference Saville2005).
But two sites do appear to provide unequivocal evidence for human presence during the Lateglacial: Howburn Farm in south Lanarkshire and Rubha Port an t-Seilich on the Isle of Islay. At the former, extensive flint scatters (including tools and scrapers) were discovered, and these appear to have close associations with tools of the Late Hamburgian culture of northern Germany (dated to ∼14.0 k cal. 14C yr BP); as such, they constitute the earliest firm evidence for human activity in Scotland during the Lateglacial (Ballin et al. Reference Ballin, Saville, Tipping and Ward2010; Ward & Saville Reference Ward and Saville2010). At the site on Islay, chipped stone artefacts with technological and typological characteristics similar to those of the continental Ahrensburgian culture have been found. A combination of radiocarbon dates, tephrochronology, geoarchaeological analysis and cultural association suggests that these assemblages date from the later Loch Lomond Stadial and early Holocene (Mithen et al. Reference Mithen, Wicks, Pirie, Riede, Lane, Banerjea, Cullen, Gittins and Pankhurst2015).
3. Dating and correlation
3.1. Radiocarbon dating
Radiocarbon has been, and continues to be, the principal chronometric tool in the dating of Scottish Lateglacial records. As noted above, the first Lateglacial date (from Garral Hill, Banffshire) was obtained over 50 years ago, since when several hundred dates have been reported from sites in Scotland. The majority are on cores from lake sequences, either on bulk samples of sediment or on their contained plant macrofossils. However, dates have also been obtained from marine molluscs, often glacially-transported shells and, in a number of instances, these have been used to constrain the limits of Loch Lomond Readvance glaciers (e.g., Gray & Brooks Reference Gray and Brooks1972; Peacock et al. Reference Peacock, Harkness, Housley, Little and Paul1989; Stoker et al. Reference Stoker, Bradwell, Howe, Wilkinson and McIntyre2009). The earlier dates were largely derived by gas-proportional counting (e.g., Godwin & Willis Reference Godwin and Willis1959) and were characterised by relatively large standard errors, typically in excess of 200 years at 1σ (e.g., Vasari Reference Vasari, Gray and Lowe1977). However, with the adoption and refinement of liquid scintillation counting (Polach Reference Polach, Taylor, Long and Kra1992) and, from the 1980s onwards, AMS (accelerator mass spectrometry) measurement, significant improvements have been made in levels of analytical precision, to the extent that a number of recently published Lateglacial dates from sites in Scotland typically have standard errors of 100 years or less. A further advantage of AMS has been a marked reduction in the required sample size, with AMS laboratories routinely analysing samples containing 1 mg of organic carbon or less (Walker Reference Walker2005). In addition, as individual fruits or seeds, or even pollen grains, can be dated by AMS, many of the problems with dating bulk sediment samples, such as mineral carbon error resulting from the inwashing of older carbon residues (Walker & Lowe Reference Walker and Lowe1990; Lowe & Walker Reference Lowe and Walker2000), can now largely be avoided.
Two further developments in radiocarbon dating have a bearing on ages from Scottish Lateglacial sites. The first is the calibration of the radiocarbon timescale, whereby radiocarbon years can be converted to calendar ages (or calibrated ages: cal. years BP), based on comparisons between radiocarbon age estimates and independently-dated materials, such as dendrochronologically-dated wood, varved sediments or uranium series-dated coral. The earliest calibrations that cover the Lateglacial period were developed in the early 1990s (Stuiver & Reimer Reference Stuiver and Reimer1993); since then, the international radiocarbon community has produced successive updates of its INTCAL calibration (Stuiver et al. Reference Stuiver, Reimer, Bard, Beck, Burr, Hughen, Kromer, McCormac, van der Plicht and Spurk1998), the most recent being INTCAL13 (Reimer et al. Reference Reimer, Bard, Bayliss, Beck, Blackwell, Bronk Ramsey, Buck, Cheng, Edwards, Friedrich, Grootes, Guilderson, Haflidason, Hajdas, Hatté, Heaton, Hoffman, Hogg, Hughen, Kaiser, Kromer, Manning, Niu, Reimer, Richards, Scott, Southon, Staff, Turney and van der Plicht2013). Over the past two decades, the majority of Scottish Lateglacial radiocarbon dates have been calibrated using INTCAL programs. One difficulty here, however, is the effect of the well-known radiocarbon dating plateaux, periods of relatively constant radiocarbon production which are reflected in relatively ‘flat’ sections of the INTCAL calibration curve, notably between 12.40 and 12.15 k cal. 14C yrs BP, and 11.65 and 11.40 k cal. 14C yrs BP (Reimer et al. Reference Reimer, Bard, Bayliss, Beck, Blackwell, Bronk Ramsey, Buck, Cheng, Edwards, Friedrich, Grootes, Guilderson, Haflidason, Hajdas, Hatté, Heaton, Hoffman, Hogg, Hughen, Kaiser, Kromer, Manning, Niu, Reimer, Richards, Scott, Southon, Staff, Turney and van der Plicht2013; Hogg et al. Reference Hogg, Southon, Turney, Palmer, Bronk Ramsey, Fenwick, Boswijk, Büntgen, Friedrich, Helle, Hughen, Jones, Kromer, Noronha, Reinig, Reynard, Staff and Wacker2016). More precise calibrations can be obtained for samples that fall on the steeper parts of the calibration curve. The second important advance has been in the application of statistical and mathematical techniques to develop age-depth models (e.g., Matthews et al. Reference Matthews, Birks, Bourne, Brooks, Lowe, MacLeod and Pyne-O'Donnell2011). Typically, these employ Bayesian statistical methods, are linked to calibration through programs such as OxCal (Bronk Ramsey Reference Bronk Ramsey2008, Reference Bronk Ramsey2009), and may be further constrained by the use of tephra isochrons (see below). Such approaches have resulted in significantly higher levels of accuracy and precision in the dating of Lateglacial records from Scotland.
3.2. Surface exposure dating
A relatively recent innovation in the geochronology of the Scottish Lateglacial has been surface exposure dating, using the cosmogenic isotopes 10Be and 36Cl. Samples are obtained from erratics or from rock outcrops around former ice margins, and apparent exposure ages can be scaled to specific altitude and latitude using online calculators (Balco et al. Reference Balco, Stone, Lifton and Dunai2008). The principal application of this method has been in the development of glacial chronologies, relating both to spatial and temporal patterns of ice-sheet wastage at the end of the Dimlington Stadial (e.g., Everest & Kubik Reference Everest and Kubik2006; Gheorghiu et al. Reference Gheorghiu, Fabel, Hansom and Xu2012), and to the timing of glaciation during the succeeding Loch Lomond Stadial (e.g., Golledge et al. Reference Golledge, Favel, Everest, Freeman and Binnie2007; Ballantyne Reference Ballantyne2010). For example, cosmogenic exposure ages from NW Scotland suggest that ice sheet retreat was interrupted by a regionally significant readvance of the retreating ice sheet margin around the time of the Dimlington Stadial–Lateglacial Interstadial transition (∼14.7 ka; Ballantyne & Stone Reference Ballantyne and Stone2012), while surface exposure ages of ∼12.9 to 11.6 ka on erratics and in situ bedrock on Beinn Inverveigh, immediately to the south of Rannoch Moor, imply complete ice cover of that mountain summit during the Loch Lomond Stadial (Golledge et al. Reference Golledge, Favel, Everest, Freeman and Binnie2007). Further details of these glaciological and glacial geomorphological applications of surface exposure dating can be found in Ballantyne (Reference Ballantyne2012) and Ballantyne & Small (Reference Ballantyne and Small2017, this volume).
3.3. Varve dating
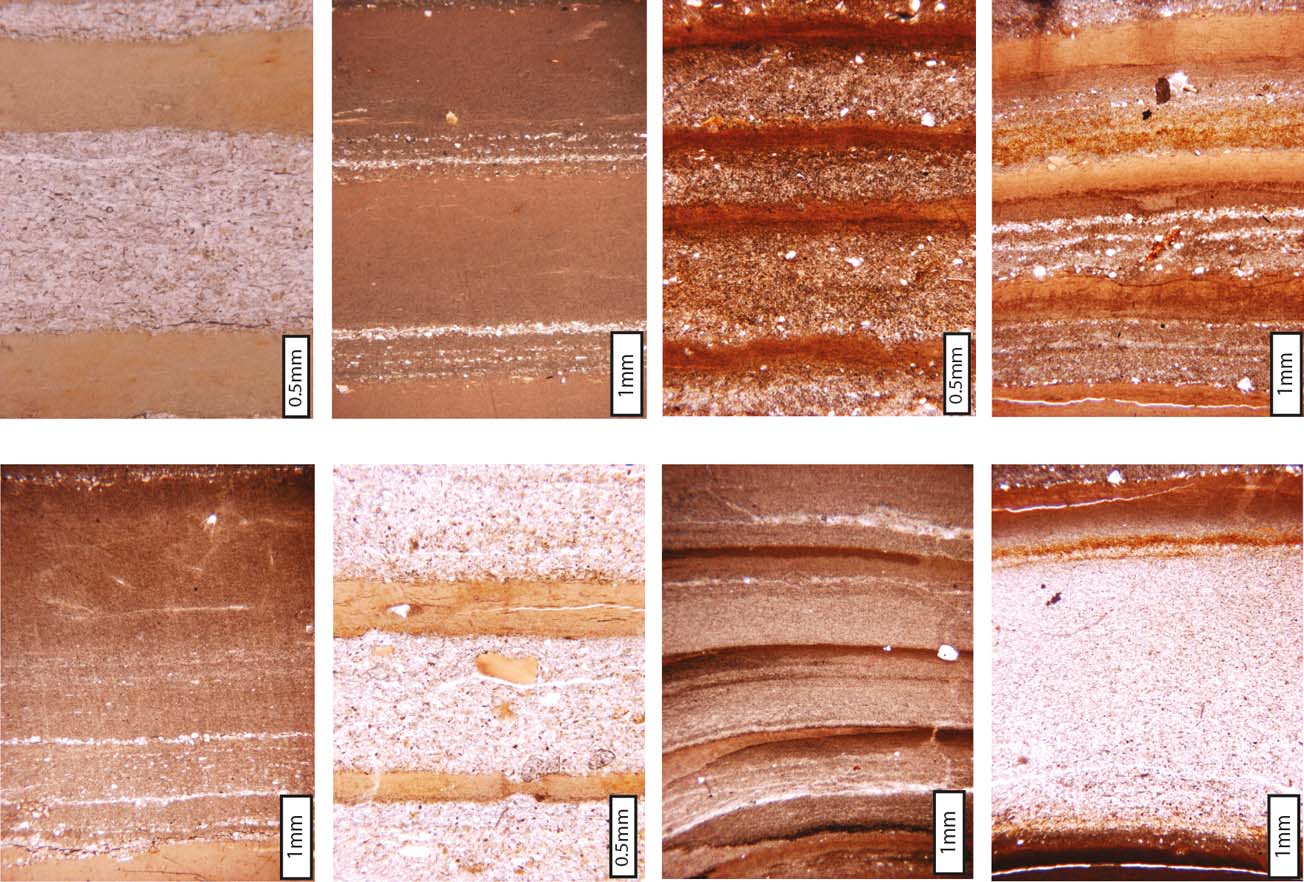
Varved (annually-laminated) sediments can provide age estimates at a decadal resolution or less (comparable with ice-core records), thereby refining considerably the chronology and duration of events during the Lateglacial (e.g., Lane et al. Reference Lane, Brauer, Blockley and Dulski2013; Schlolaut et al. Reference Schlolaut, Marshall, Brauer, Nakagawa, Lamb, Staff, Bronk Ramsey, Bryant, Brock, Kossler, Tarasov, Yokoyama, Tada and Haraguchi2015; Zolitschka et al. Reference Zolitschka, Francus, Ojala and Schimmelmann2015). However, true varved deposits of Lateglacial age are rare in Scotland. A number of sites have been described as containing ‘laminated sediments’ but, in many cases, it has yet to be established that these are indeed annually-deposited layers. In recent years, microscopic examination of laminated deposits using thin-section micromorphology has provided high-definition visual imagery of structural features that are indicative of annual layering (Palmer et al. Reference Palmer, Rose, Lowe and MacLeod2010; Bendle et al. Reference Bendle, Palmer and Carr2015; Fig. 9). This technique has been applied in the analysis of laminated sediments at two sites in Scotland, where the advance of Loch Lomond Stadial glacier ice blocked local drainage, creating ice-dammed lakes within which glaciolacustrine varves accumulated. The famous ‘Parallel Roads of Glen Roy’, in the Lochaber district of the Scottish Highlands, are shorelines associated with ice-dammed lakes (Sissons Reference Sissons1978, Reference Sissons2017), and varved deposits from the former lakes show that these existed for no more than ∼515 years (Palmer et al. Reference Palmer, Rose, Lowe and MacLeod2010). Further south, Glacial Lake Blane formed when a Loch Lomond Stadial piedmont glacier blocked westward-flowing drainage into the Loch Lomond basin. There, counting of varves indicates the lake existed for around 260 years, while the onset of varve deposition is dated to ∼12.0 k cal. 14C yr BP (MacLeod et al. Reference MacLeod, Palmer, Lowe, Rose, Bryant and Merritt2011).
Characteristic microfacies revealed by thin-section micromorphology on varves in Glen Roy, Scottish Highlands. These all show sharp contrasts between the summer (coarse) and winter (fine-grade) layers, but vary in the relative thickness of each seasonal component, and also in the complexity and texture of the summer layer.

By establishing the dates of the onset and end of glaciolacustrine varve accumulation, the timing of advance and retreat of the ice margins can be inferred; in both of these cases the evidence suggests that maximal ice limits were reached during the later part of the Loch Lomond Stadial.
3.4. Tephra isochrons
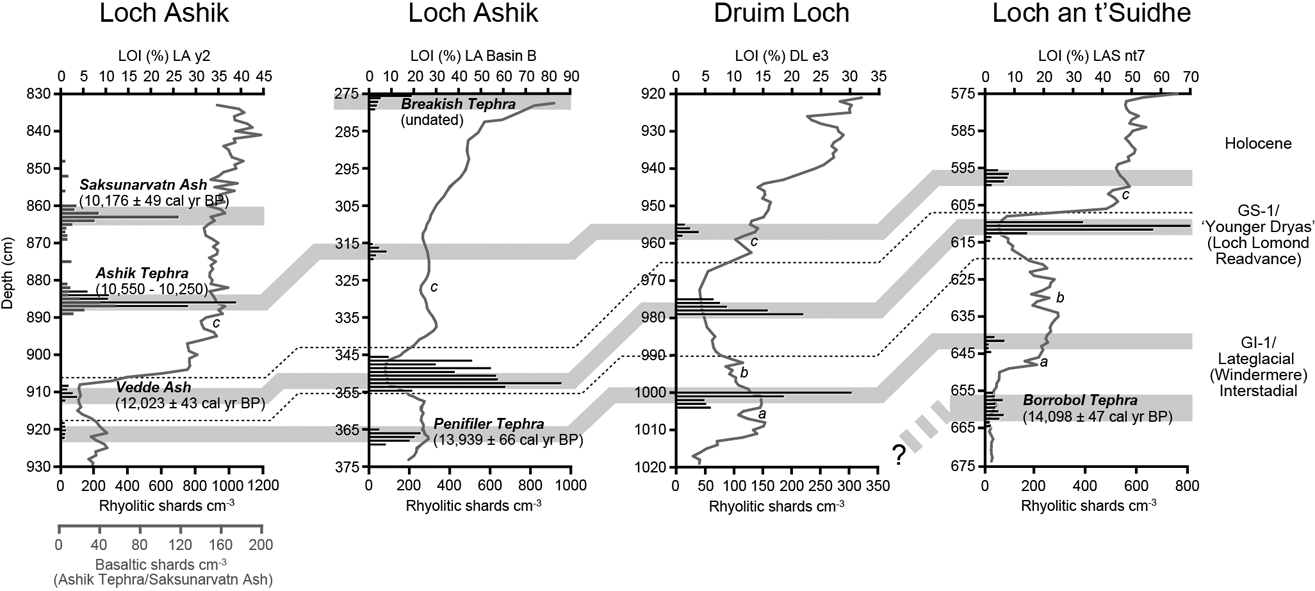
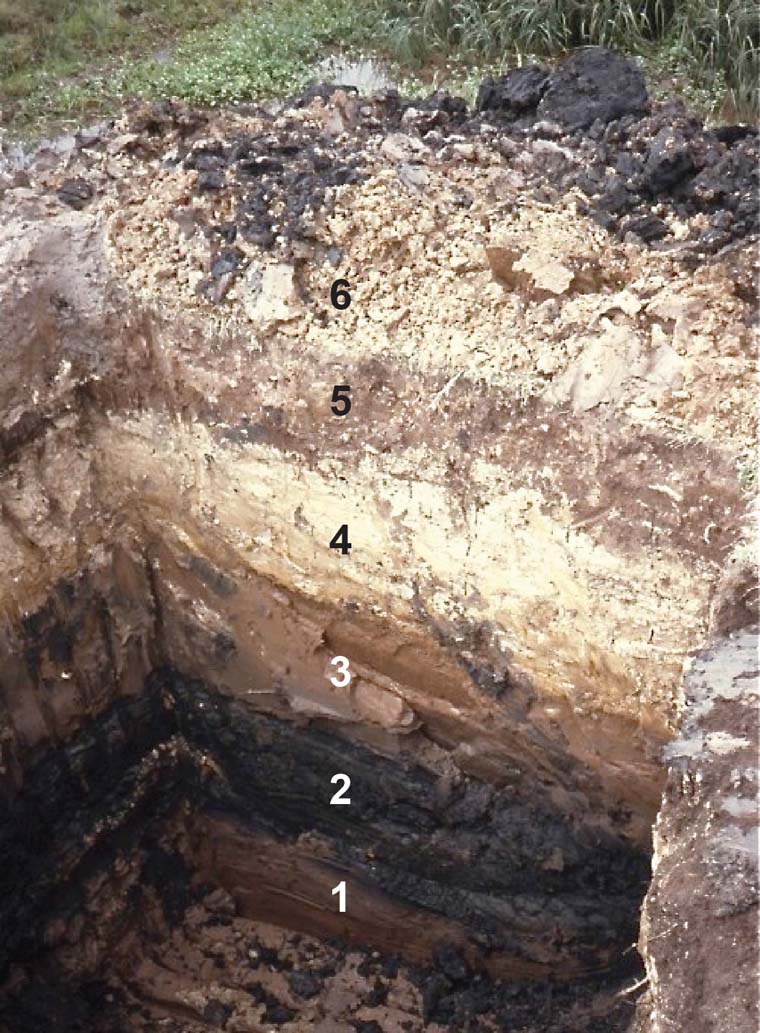
Microscopic traces of distal volcanic ash (termed cryptotephra) were first discovered in a Scottish Lateglacial sequence in 1996 at Borrobol, near Helmsdale in NE Scotland (Lowe & Turney Reference Lowe and Turney1997). Subsequent tephrostratigraphical studies have revealed that non-visible, but stratigraphically-discrete, cryptotephra layers are numerous and widespread in Lateglacial and early Holocene sediment sequences in Scotland (e.g., Blockley et al. Reference Blockley, Bourne, Brauer, Davies, Hardiman, Harding, Lane, MacLeod, Matthews, Pyne-O'Donnell, Rasmussen, Wulf and Zanchetta2014; Davies Reference Davies2015), with cyptotephras now recorded at a number of sites throughout the Scottish mainland as far south as Whitrig Bog in the Scottish Borders (Lowe et al. Reference Lowe, Birks, Brooks, Coope, Harkness, Mayle, Sheldrick, Turney and Walker1999) and on the Hebridean Islands of Skye and Mull (Pyne-O'Donnell Reference Pyne-O'Donnell2007). The importance of these discoveries lies in the potential they offer for synchronising palaeoenvironmental data, for the tephras constitute isochronous marker horizons that enable individual site records to be aligned precisely (Lowe et al. Reference Lowe, Rasmussen, Björck, Hoek, Steffensen, Walker and Yu2008b; Davies et al. Reference Davies, Abbott, Pearce, Wastegård and Blockley2012). Moreover, if independently dated, they provide a basis for validating age-depth models based on other chronometric methods, such as radiocarbon (e.g., Matthews et al. Reference Matthews, Birks, Bourne, Brooks, Lowe, MacLeod and Pyne-O'Donnell2011; Bronk Ramsey et al. Reference Bronk Ramsey, Albert, Blockley, Hardiman, Housley, Lane, Lee, Matthews, Smith and Lowe2015). These aspects are illustrated in Figure 10 for three Lateglacial–early Holocene tephras commonly found in Scottish records: the Penifiler Tephra, the Vedde Ash and the Ashik Tephra, dating to the mid-Interstadial, Loch Lomond Stadial and early Holocene respectively. The Vedde Ash is of particular significance as it has also been found in the Greenland NGRIP ice core, and dated precisely using the GICC05 chronology (Rasmussen et al. Reference Rasmussen, Anderson, Svensson, Steffensen, Vinther, Clausen, Siggard-Andersen, Johnsen, Larsen, Bigler, Röthlisberger, Fischer, Goto-Azuma, Hansson and Ruth2006); hence this age can be imported into those Scottish sequences where the Vedde Ash occurs. The same is true of the early Holocene Saksunarvatn Ash, which post-dates the Ashik Tephra (Fig. 10), although this ash has not yet been detected in many Scottish sequences.
Variations in cryptotephra shard concentrations in Lateglacial-Early Holocene deposits at Loch Ashik and Druim Loch, Isle of Skye, and Loch an t-Suidhe, Isle of Mull, plotted against loss-on-ignition (LOI) variations (from Pyne-O'Donnell Reference Pyne-O'Donnell2007). The dotted lines mark the lower and upper boundaries of the Loch Lomond Stadial. a, b and c indicate reversals in LOI percentages that are considered the approximate correlatives of the GI-1b, GI-1d and PBO (PreBoreal Oscillation) climatic oscillations in the Greenland ice-core stratotype sequence (Lowe et al. Reference Lowe, Rasmussen, Björck, Hoek, Steffensen, Walker and Yu2008b), respectively.

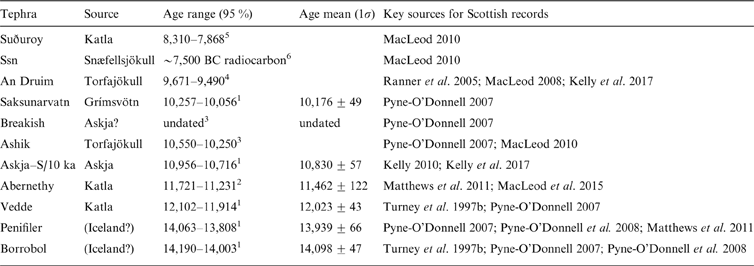
Altogether, 11 tephra isochrons have been found in Scottish records that span the Lateglacial–early Holocene (Table 1). However, a number of elements of this tephra scheme or ‘lattice’ still need to be refined, notably in terms of dating precision (see Bronk Ramsey et al. Reference Bronk Ramsey, Albert, Blockley, Hardiman, Housley, Lane, Lee, Matthews, Smith and Lowe2015) and in the geochemical fingerprinting and provenancing of some of the tephra layers (e.g., Davies Reference Davies2015; MacLeod et al. Reference MacLeod, Matthews, Lowe, Palmer and Albert2015; Lowe et al. Reference Lowe, Pyne-O'Donnell, Timms, Ballantyne and Lowe2016; Timms et al. Reference Timms, Matthews, Palmer, Candy and Abel2017).
Tephra layers found in sediment sequences in Scotland that span the period ∼14–8 ka and their current age estimates according to: 1Bronk Ramsey et al. (Reference Bronk Ramsey, Albert, Blockley, Hardiman, Housley, Lane, Lee, Matthews, Smith and Lowe2015); 2Matthews et al. (2011); 3Pyne-O'Donnell Reference Pyne-O'Donnell2007; 4Ranner et al. (Reference Ranner, Allen and Huntley2005); 5Wastegård (Reference Wastegård2002); 6Pilcher et al. (Reference Pilcher, Bradley, Francus and Anderson2005).

4. The Scottish Lateglacial record; constraints on interpretations
4.1. Introduction
Research over the last two decades on the Scottish Lateglacial has revealed a more complex climatic history than was implied by the tripartite lithostratigraphic scheme described in section 1.1. While pollen data have sometimes provided evidence for a single climatic oscillation during the Lateglacial Interstadial, as shown for example in the Loch Ashik profile (Fig. 1), more highly-resolved proxy records, such as chironomid and stable oxygen isotope data, have revealed evidence for up to three climatic fluctuations during the Interstadial. Furthermore, there appear to have been geographical variations in the relative intensities of these sub-interstadial and sub-stadial climatic changes, even within the confines of Britain and Ireland (section 5.1).
There are also indications of changes in temperature during the course of the Loch Lomond Stadial, with the manifestation of these climatic shifts in, for example, glacier advance and retreat, appearing to vary regionally (see section 5.3).
In very broad terms, the pattern of change revealed by the various climate proxies matches the sequence of events in the oxygen isotope signal in the Greenland stratotype sequence (section 1.3). However, it remains to be established whether these changes were time-equivalent, or whether there were temporal offsets between Greenland and Scotland during the Lateglacial. Detecting leads and lags in the climate system is one of the major challenges confronting scientists working on the Lateglacial and, hence, while the Greenland isotope sequence remains the best resolved, both chronologically and stratigraphically, for this time interval, direct comparisons with that record may not always reveal the true patterns of spatial and temporal palaeoclimatic variability. Hence, while the ice-core record remains the template for climate change in the N Atlantic region, care needs to be exercised in effecting correlations between Scotland and Greenland, not least because of the constraints on the interpretation of the Scottish Lateglacial record discussed in the following sections.
4.2. Stratigraphic resolution
A major problem in interpreting the Scottish Lateglacial record is the relatively slow rate of sediment accumulation in many lake basins, which means that short-lived and/or low amplitude climatic events may often go undetected in the stratigraphic profile. In the majority of the ∼100 Scottish Lateglacial sites that are described in the literature, the sedimentary record is less than 1 m in thickness. Given an approximate time interval of c.3 ka for the duration of the Lateglacial, this represents a mean accumulation rate of around 1 cm per 300 years (0.003 cm yr–1). This compares with the c.12 m per 300 years (0.04 m yr–1) for the Lateglacial section of the NGRIP ice core (Rasmussen et al. Reference Rasmussen, Bigler, Blockley, Blunier, Buchardt, Clausen, Cvijanovic, Dahl-Jensen, Johnsen, Fischer, Gkinis, Guillevic, Hoek, Lowe, Pedro, Popp, Seierstad, Steffensen, Svensson, Vallelonga, Vinther, Walker, Wheatley and Winstrup2014).
It is, therefore, not surprising that some of the high frequency climatic variations reflected in isotopic signals in the Greenland record have gone undetected in many Scottish profiles. This problem is compounded by the fact that the sampling interval adopted in the analysis of many Lateglacial lacustrine sequences has often been relatively coarse (>5 cm). In the Tirinie profile (Fig. 7), for example, the TIR-Oc1 mid-Interstadial oscillation identified in the record spans less than 4 cm of the sediment stack, and was only detected because a close-interval sampling strategy was adopted, and a highly-sensitive proxy (stable isotope analysis) was employed.
Hence, while it may never be possible in Scottish Lateglacial records to achieve the levels of stratigraphic and temporal resolution of the Greenland ice cores, recent research has tended to target those sites where thick sequences of Lateglacial sediment have accumulated, and/or where close-interval sampling and techniques capable of discriminating short-lived climatic events can be employed (e.g., Brooks et al. Reference Brooks, Matthews, Birks and Birks2012a; Candy et al. Reference Candy, Abrook, Elliott, Lincoln, Matthews and Palmer2016).
4.3. Climatic and environmental reponses
The data generated by the various proxy methods discussed in section 2 can also prove problematic. First, while the evidence reflects the responses of biota or physical processes to key forcing factors, notably climate change, they may well lag the forcing signal, since time is needed for adjustment to new conditions depending on the proxy indicator concerned. It has long been recognised, for example, that Coleoptera responded rapidly to rising temperatures at the beginning of the Lateglacial Interstadial, and well before vegetation, due to the greater mobility, and hence reaction times, of beetles as compared with terrestrial plants, especially shrubs and trees (e.g., Coope Reference Coope1977; Walker et al. Reference Walker, Coope and Lowe1993; Lowe and Walker Reference Lowe and Walker1997). Aquatic plants, by contrast, appear to have responded to Lateglacial climatic shifts more quickly than their terrestrial counterparts (Birks et al. Reference Birks, Battarbee and Birks2000).
A second problem relates to environmental and climatic thresholds. The Greenland ice-core records show that some of the short-lived climatic oscillations during the Lateglacial Interstadial (GI-1a to GI-1e) occurred over timescales of half a century or less, which may have been too short an interval for the climatic and environmental thresholds that constrain plant communities to have been transgressed. The same applies to geochemical records, as these reflect either changes in lake ecosystems or changes in sediment influx following the break-up of plant communities around basin catchments. The result is that short-lived and/or low amplitude climatic shifts may simply not register in the proxy records.
Thirdly, while climate is undoubtedly a key forcing agent, its effects may be modulated or masked by other influences, such as local hydrology, soil conditions, bedrock type, ground relief and, in the case of biota, competition and successional factors.
Fourthly, it cannot always be assumed that changes recorded in the palaeo-record predominantly reflect regional climatic influences as other, maybe local site-specific factors, may have been of equal or greater importance.
These interpretational difficulties are not encountered, of course, in the Greenland ice cores, where the multi-parameter record of stable isotopes and geochemical elements that underpin the event stratigraphy are unambiguous signals of climate shifts that are essentially contemporaneous (Seierstad et al. Reference Seierstad, Bigler, Blunier, Bourne, Brook, Buchardt, Buizert, Clausen, Cook, Dahl-Jensen, Davies, Guillevic, Johnsen, Pedersen, Popp, Rasmussen, Severinghaus, Svensson and Vinther2014).
4.4. Ice-sheet wastage and the onset of lake sedimentation
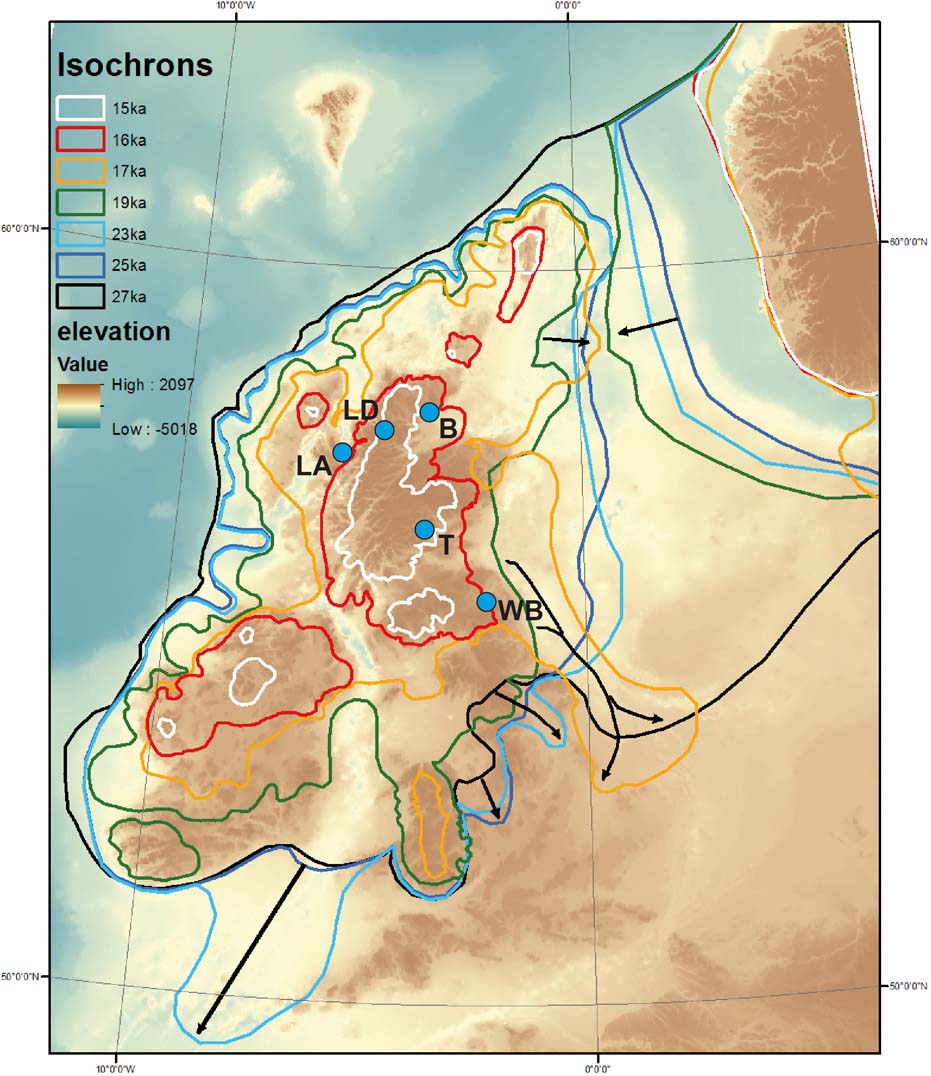
A further problem concerns the variable date for the onset of sedimentation in lake basins after the wastage of the last ice sheet, and the lack of proxy climate indicators in these early Lateglacial sediments. In terms of timing, the BRITICE reconstruction (Fig. 11) suggests that most of the Scottish mainland was ice-covered until ∼17 ka, but by ∼15 ka, what remained of the ice sheet was confined to the western Highlands in the north and to the western Southern Uplands (Clark et al. Reference Clark, Hughes, Greenwood, Jordan and Sejrup2012). This suggests that the earliest post-Last Glacial Maximum (LGM) lake sediments would be found predominantly in eastern and SE Scotland, as at Whitrig Bog in the Scottish Borders. Significantly, this is the only site in Scotland that shows the rise in temperature at the beginning of the Lateglacial Interstadial (Fig. 12; section 2.4). If broadly correct, the isochron reconstruction for glacial retreat would suggest that Whitrig Bog became ice-free around 16 ka, although this remains to be confirmed by independent dating. Other sites that are critically located with respect to this proposed isochron, and which can potentially provide independent tests of its validity, include Loch Droma, Loch Ashik and Borrobol (Fig. 11).
Isochrons of the retreat margins of the Late Devensian ice sheet (from Clark et al. Reference Clark, Hughes, Greenwood, Jordan and Sejrup2012). Abbreviations: B = Borrobol; LA = Loch Ashik; LD = Loch Droma; T = Tirinie; WB = Whitrig Bog. For explanation, see text.

Chironomid-inferred temperature curve for the Whitrig Bog sequence, Scottish Southern Uplands (from Brooks & Birks Reference Brooks and Birks2000). Note the error ranges on the chironomid-inferred temperature reconstructions. Note also that the Lateglacial temperature rise as reflected in this C-IT record occurred ∼35 cm below the Borrobol Tephra. The latter is dated at ∼14.1 k cal. 14C yr BP and, hence, climatic amelioration at the site began well before that time.

The organic sediments that began to accumulate following this rise in temperature are typically underlain by variable thicknesses of minerogenic deposits in which pollen grains are either sparse or absent. Moreover, the sediments are almost always devoid of other climatic proxies, such as Coleoptera, diatoms or plant macrofossils. This means that the earliest pollen assemblages in the basal organic sediments, while providing evidence for plant succession, are recording a process that postdates the amelioration in climate. In other words, they are reflecting the time-lag in vegetational response to climate change described above. Precisely when the rise in Lateglacial Interstadial temperatures began cannot be established on the evidence that is currently available.
A further problem relates to the nature of the lake basins themselves. Many infilled depressions, particularly in the Highlands, are in valley bottom situations and these may have been some of the last localities to have been deglaciated as the ice sheet downwasted (e.g., Young Reference Young1974; Brown Reference Brown1994; Evans et al. Reference Evans, Clark and Mitchell2005). Moreover, many are former kettle holes where stagnant ice bodies may have remained for several hundred years after regional deglaciation (e.g., Ham & Attig Reference Ham and Attig1996; Henriksen et al. Reference Henriksen, Mangerud, Matiouchkov, Paus and Svendsen2003; Peteet et al. Reference Peteet, Beh, Orr, Kurdyla, Nichols and Guildersen2012). In both cases, the onset of sedimentation could have been delayed and hence the earliest part of the Lateglacial climatic record may be missing.
The transition from the cold phase that postdates the LGM period into the succeeding Interstadial remains one of the most problematic episodes of the entire Scottish Lateglacial, and isolating a coherent climatic signal from the available sediment record has proved to be frustratingly elusive. Indeed, it remains a major challenge for future work on the Lateglacial in Scotland. All that can be said, on the basis of the limited evidence currently available, is that the first freshwater organic lake sediments began to accumulate sometime between 15 ka and 14 ka and, on the basis largely of the record from Whitrig Bog (Fig. 12), it was during this time interval that the initial rise in temperature occurred.
5. Towards an event stratigraphy for the Scottish Lateglacial
5.1. The Lateglacial Interstadial
As described in section 2.1, for fifty years or more pollen analysis has been the most widely used approach for reconstructing environmental change in Scotland during the Lateglacial, and much of what we know about landscape and environmental change has been based on this technique (Lowe & Walker Reference Lowe, Walker, Gray and Lowe1977; Walker Reference Walker1984; Lowe et al. Reference Lowe, Birks, Brooks, Coope, Harkness, Mayle, Sheldrick, Turney and Walker1999). Equally, radiocarbon dating has been the standard chronometric method for providing a timescale for environmental change and for correlating individual site records. In recent years, however, chironomid analysis and stable isotope analysis (sections 2.4 and 2.6) have provided important new insights into climatic changes, while tephra isochrons offer an independent basis for dating and for inter-site correlation. These approaches are the focus of this and the following sections.
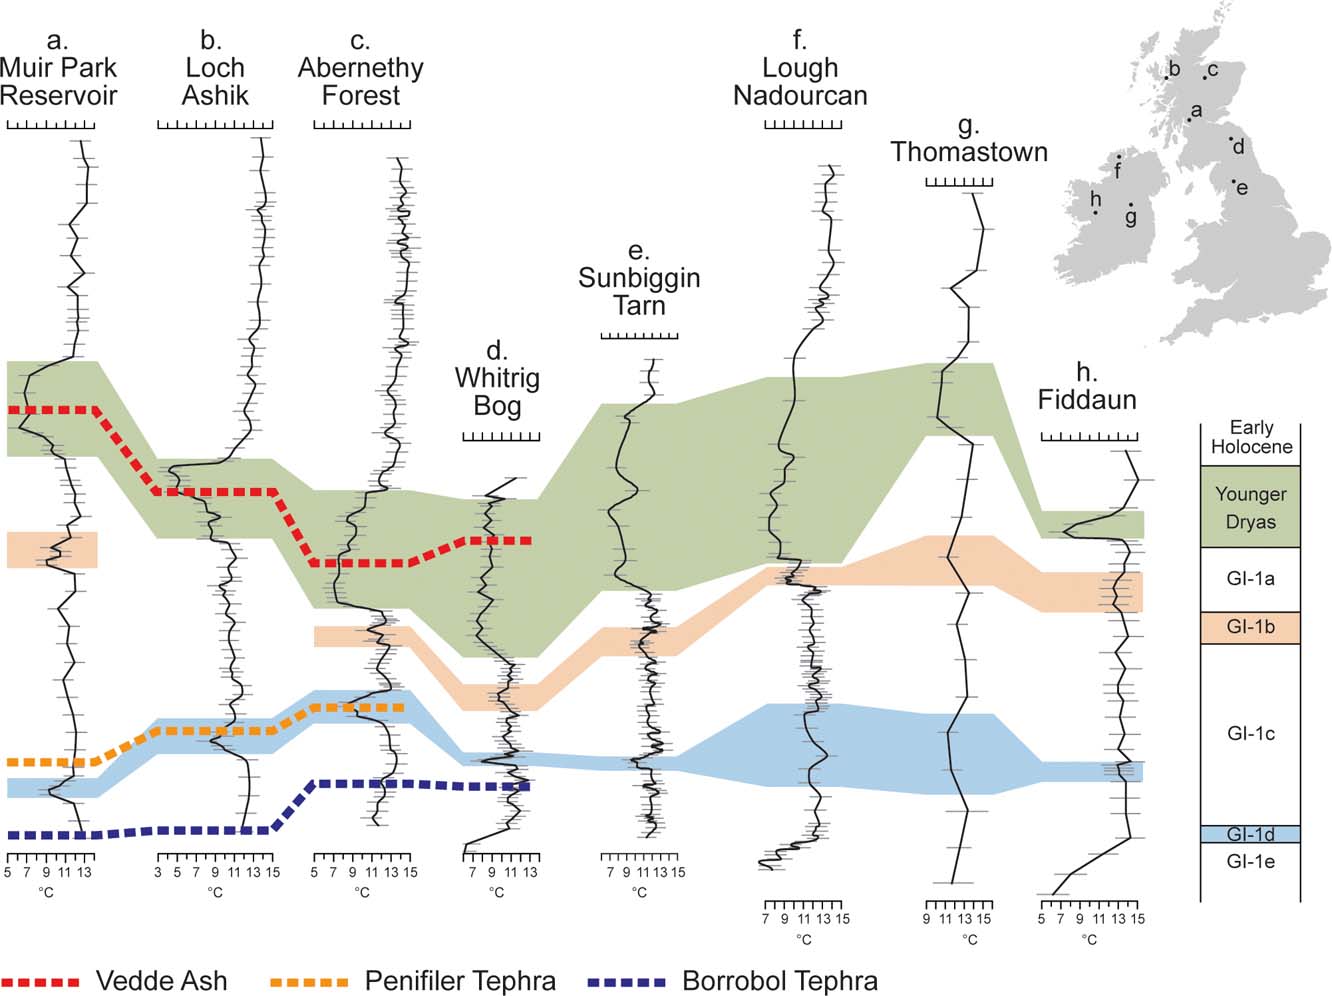
As noted above (section 2.4), C-IT (chironomid-inferred temperature) records for the Lateglacial Interstadial have now been published from four sites in Scotland: Abernethy Forest; Whitrig Bog; Loch Ashik; and Muir Park Reservoir (Fig. 13). In addition, there are detailed sedimentological, geochemical and pollen records from all four sequences, and plant macrofossil data are available from Abernethy Forest. The Borrobol tephra is present in all of the sequences, while the Penifiler Tephra has been found at Abernethy Forest, Loch Ashik and Muir Park Reservoir. The Borrobol Tephra occurs at the base of the Loch Ashik and Muir Park Reservoir profiles, indicating that sedimentation commenced later at these sites (∼14.1 ka) than at Whitrig Bog (Fig. 13). The onset of sedimentation in the Abernethy Forest basin appears to have been slightly earlier than this, but later than at Whitrig Bog.
Chironomid-inferred temperature (C-IT) records from the four sites in Scotland, and six other C-IT records from sites in England and Ireland: the y-axes are original depth scales and have not been standardised (from Brooks et al. Reference Brooks, Davies, Mather, Matthews and Lowe2016). Tephra isochrons for the Scottish records are also indicated.

The Borrobol Tephra is especially widespread, and has been found in a number of other sites in Scotland, where it also tends to occur near the base of the Interstadial deposits as, for example, at Tynaspirit West, near Callander (Pyne-O'Donnell Reference Pyne-O'Donnell2007), Loch an-t Suidhe on the Ross of Mull (Davies Reference Davies2002; Pyne-O'Donnell Reference Pyne-O'Donnell2007), Borrobol in NE Scotland (Turney et al. Reference Turney, Harkness and Lowe1997b) and Loch Etteridge in the Spey Valley (Lowe et al. Reference Lowe, Albert, Hardiman, MacLeod, Blockley, Pyne-O'Donnell, Palmer, Lowe and Rose2008a). Collectively, therefore, these data demonstrate that by around 14 ka, large parts of the country were ice-free and experiencing relatively mild climatic conditions, with July temperatures of up to 13oC based on chironomid evidence, or maybe as high as 15°C or more as suggested by coleopteran records. In other sequences, the oldest volcanic ash encountered is the Penifiler Tephra as, for example, at Tirinie (Candy et al. Reference Candy, Abrook, Elliott, Lincoln, Matthews and Palmer2016), Pulpit Hill near Oban (Lincoln Reference Lincoln2011) and Druim Loch on Skye (Pyne-O'Donnell Reference Pyne-O'Donnell2007). This could indicate delayed deglaciation of these sites compared with those that register the Borrobol Tephra, although it could also reflect the failure to locate the earliest Interstadial sediments in these three basins. It should also be noted that of the 100 or so Scottish sites for which Lateglacial records have been published, less than 20 % have so far been investigated for tephrostratigraphy, and hence the tephra database remains relatively limited.
When the four C-IT Lateglacial temperature curves for sites in Scotland are compared with five others from England and Ireland (Fig. 13), a number of similarities emerge:
1. Three of the records (Whitrig Bog, Lough Nadourcan, Fiddaun) show the early Interstadial rise in temperatures, all with an amplitude of around 5°C; the remaining records appear to postdate this event.
2. All eight records indicate that mean July temperatures during the Interstadial were generally around 11–13oC. While there are indications of a slight fall in temperature during the Lateglacial Interstadial, there is no clear evidence for a long-term temperature decline comparable, for example, with the overall downward trend reflected in the Greenland oxygen isotope data (Fig. 2) and also in coleopteran records (section 2.4). On the other hand, trends in Lateglacial chironomid-inferred temperature reconstructions from the English Lake District (Bedford et al. Reference Bedford, Jones, Lang, Brooks and Marshall2004; Lang et al. Reference Lang, Brooks, Bedford, Jones, Birks and Marshall2010) are similar to the Scottish C-IT record and, indeed, to the Tirinie stable isotope profile of Candy et al. (Reference Candy, Abrook, Elliott, Lincoln, Matthews and Palmer2016). The reasons for these differences between the British and Greenland records are not clear on present evidence.
3. Two short-lived cold oscillations with amplitudes of around 3–4oC are evident in most of the records. These are more pronounced in the Scottish sites, although whether these reflect real climatic differences or site-specific factors, such as the influence of rate of sedimentation, altitude and catchment size, etc., remains to be established.
4. The two colder oscillations may equate with the GI-1d and GI-1b events in the Greenland record (Fig. 2), but the later oscillation in Scotland is generally less pronounced and more prolonged than the earlier one, while the opposite is the case in the Greenland record, with the GI-1b event being the deeper and more prolonged.
Very broadly, therefore, these climatic events during the Interstadial appear to match those of the Greenland sequence in terms of occurrence and timing in the Lateglacial Interstadial temperature histories: the older cold oscillation in Scotland radiocarbon dates to ∼14.09–13.65 k cal. 14C yr BP (based on the age of the Penifiler Tephra), which compares with 14.03–13.90 k yr b2k for the age of GI-1d in the Greenland record; while the upper oscillation dates to ∼13.65–13.42 k 14C yr BP (95 % probability range), which compares with 13.3–13.1 k yr b2k for GI-1b in Greenland.
Within the dating errors, the events are broadly synchronous (Matthews et al. Reference Matthews, Birks, Bourne, Brooks, Lowe, MacLeod and Pyne-O'Donnell2011; Rasmussen et al. Reference Rasmussen, Bigler, Blockley, Blunier, Buchardt, Clausen, Cvijanovic, Dahl-Jensen, Johnsen, Fischer, Gkinis, Guillevic, Hoek, Lowe, Pedro, Popp, Seierstad, Steffensen, Svensson, Vallelonga, Vinther, Walker, Wheatley and Winstrup2014). However, the reasons for the differences in climatic trends during the Interstadial, noted above, are not yet clear. They could reflect local modulation of synoptic climatic conditions, or they may be an artefact of the transfer function that underpins the C-IT temperature estimates (Birks et al. Reference Birks, Heiri, Seppä and Bjune2010; Velle et al. Reference Velle, Brodersen, Birks and Willassen2010; Brooks et al. Reference Brooks, Axford, Heiri, Langdon and Larocque-Tobler2012b). On the other hand, the C-IT data do appear sufficiently sensitive to be able to reveal the influence of climatic gradients within Britain and Ireland, for Brooks et al. (Reference Brooks, Davies, Mather, Matthews and Lowe2016) have noted that Interstadial temperature variations are most pronounced in the Abernethy Forest and Whitrig Bog records and least pronounced in Irish records, which they attribute to the greater distance of these two sites from Atlantic influences and, hence, a more continental climatic régime.
This regional climatic gradient seems also be to be reflected in the Tirinie oxygen isotope record (Fig. 7). This shows two marked climatic cooling episodes during the Interstadial, the lower of which also coincides with the Penifiler Tephra, and again allows these events to be correlated with the GI-1d and GI-1b intervals, as with the C-IT records. The δ18O fluctuations in the Tirinie sequence, however, are much more pronounced than those described from Lateglacial Interstadial sequences in sites in England and Wales, a difference that is perhaps attributable to the more northerly location and higher altitude of the Tirinie basin by comparison with these southern and predominantly low altitude records (Candy et al. Reference Candy, Abrook, Elliott, Lincoln, Matthews and Palmer2016).
5.2. The Loch Lomond Stadial
The most pronounced and persistent cold event represented in all four C-IT records is the Loch Lomond Stadial. Here, the Vedde Ash provides a consistent marker in all four profiles, and a link to the GS-1 event of the Greenland statotype sequence (Fig. 13). The magnitude of the inferred drop of July temperatures from mean Interstadial to minimal Loch Lomond Stadial values is around 5oC in the Whitrig Bog record, 6oC in the Abernethy and Muir Park Reservoir records and 7oC in the Loch Ashik record, broadly reflecting a S–N gradient.
There are, however, differences between the four Scottish C-IT records in terms of the timing of the coldest episode within the LLS. In both the Whitrig Bog and Abernethy Forest records, this clearly pre-dates the Vedde Ash isochron (Fig. 13). This is also the case with the subdivision of the Younger Dryas interval recently proposed by Bakke et al. (Reference Bakke, Lie, Heegaard, Dokken, Haug, Birks, Dulski and Nilsen2009) and Lane et al. (Reference Lane, Brauer, Blockley and Dulski2013), which reveals an earlier phase of cold and stable conditions, followed by a less stable phase when temperatures began to increase. Under this scenario, an amelioration of climate occurred during the YD, as a precursor to the more marked temperature increase that characterises the start of the Holocene at 11.7 ka (Walker et al. Reference Walker, Johnsen, Rasmussen, Popp, Steffensen, Gibbard, Hoek, Lowe, Andrews, Björck, Cwynar, Hughen, Kershaw, Kromer, Litt, Lowe, Nakagawa, Newnham and Schwander2009).
But this climatic reconstruction does not appear to accord with the data from Muir Park Reservoir and Loch Ashik, which show the coldest conditions mainly occurring during the later part of the Loch Lomond Stadial (see section 2.4). Both these sites were located very close to the margins of Stadial glaciers (Fig. 3), and it is possible therefore that in these contexts either air temperatures were locally depressed by the nearby presence of glacier ice, and/or that the lake waters in these basins were affected by cold water influx from melting snowbanks (Brooks et al. Reference Brooks, Davies, Mather, Matthews and Lowe2016).
This inference of severe conditions persisting into the late Stadial is consistent with independent evidence which suggests that the glacier that occupied the Loch Lomond basin continued to advance until sometime after 12 ka, and it then appears to have remained at its maximum extent for a further 260 years (MacLeod et al. Reference MacLeod, Palmer, Lowe, Rose, Bryant and Merritt2011).
5.3. Implications for glacier ice cover
In recent years, there has been considerable debate over the pattern and chronology of the retreat of both the last Scottish ice sheet, and of the ice masses that reformed during the Loch Lomond Stadial. These discussions have been driven partly by conflicting interpretations of the results of surface exposure dates obtained from exposed rock and boulder surfaces. In some instances these have been taken to imply that the last ice sheet did not disappear completely from Scotland during the Lateglacial Interstadial, but that ice caps survived on upland plateaux in the NW Scottish Highlands, the Southern Uplands and the Cairngorm Mountains, possibly even persisting throughout the whole of that time interval (Everest & Kubik Reference Everest and Kubik2006; Bradwell et al. Reference Bradwell, Fabel, Stoker, Mathers, McHargue and Howe2008; Stoker et al. Reference Stoker, Bradwell, Howe, Wilkinson and McIntyre2009; McCarroll et al. Reference McCarroll, Stone, Ballantyne, Scourse, Fifield, Evans and Hiemstra2010; Ballantyne & Small Reference Ballantyne and Smallthis volume).
However, recalibration of some of the age estimates, augmented by new measurements, has led to an alternative scenario being proposed, which sees large areas of Scotland ice-free shortly after 15 ka. Ice may have readvanced in parts of NW Scotland (the Wester Ross Readvance), but this event is thought to have terminated no later than ∼14.3 ka (Ballantyne et al. Reference Ballantyne, Schnabel and Xu2009, Reference Ballantyne, Rinterknecht and Gheorghiu2013; Ballantyne Reference Ballantyne2010; Ballantyne & Stone Reference Ballantyne and Stone2012; Fabel et al. Reference Fabel, Ballantyne and Xu2012; Small et al. Reference Small, Rinterknecht, Austin, Fabel, Miguens-Rodriguez and Xu2012, Reference Small, Rinterknecht, Austin, Bates, Benn, Scourse, Bourlès and Hibbert2016). With respect to the Loch Lomond Readvance, some surface exposure results suggest significant retreat by as early as ∼12.5 ka, and no later than ∼12.2/12.1 ka (Ballantyne & Stone Reference Ballantyne and Stone2012; Ballantyne this volume); a scenario supported by radiocarbon dates obtained from the basal deposits preserved in lake basins on the Rannoch Moor plateau (Bromley et al. Reference Bromley, Putnam, Rademaker, Loell, Schaefer, Hall, Winckler, Birkel and Borns2014). By contrast, other surface exposure dating implies that Loch Lomond Readvance glaciers remained close to their maximal limits until as late as ∼11.5 ka (Small et al. Reference Small, Rinterknecht, Austin, Bates, Benn, Scourse, Bourlès and Hibbert2016).
Lake sites that contain Lateglacial Interstadial sediments constrain the limits of both the Loch Lomond Readvance glaciers and of the retreat stages of the Late Devensian ice sheet. In the case of the former, sites that preserve Interstadial gyttja or marl deposits overlain conformably by sediments of Loch Lomond Stadial age are highly unlikely to have been over-ridden by glacier ice. Hence the ∼100 sites that contain tripartite Lateglacial sequences (Fig. 3) effectively constrain the area that was occupied by Loch Lomond Readvance ice. Of critical importance are sites such as Muir Park Reservoir, Tynaspirit West, Salen, Ardtoe and Loch Ashik, all of which lie within a few km of mapped ice limits. Of these, Muir Park Reservoir, Tynaspirit West and Loch Ashik are particularly important, because all contain the Borrobol Tephra, which indicates that these localities in the heart of the Highlands were ice-free before ∼14.1 ka. This, in turn, implies that by that time, the Late Devensian ice sheet was less extensive than the Loch Lomond Readvance ice at the glacial readvance maximum. Other sites that contain the Borrobol Tephra (Loch Etteridge) or the Penifiler Tephra (Tirinie, Pulpit Hill) show that large parts of the Highlands were ice-free by 13.9 ka or earlier.
This stratigraphic evidence, therefore, accords with the results of surface exposure dating which suggest that large parts of Scotland were ice-free by ∼14.3 ka. This, of course, does not preclude the possibility that some remnants of the Late Devensian ice sheet did manage to survive in sheltered locations for a longer period – a hypothesis that may prove impossible to discount completely. However, the discovery of additional Lateglacial sequences that contain the Borrobol and/or Penifiler Tephras should place further limits on the extent of any residual ice during the early Lateglacial Interstadial.
5.4. Whitrig Bog: a provisional type section for the Scottish Lateglacial?
In section 1.2 above, we noted that the Windermere site had been proposed as the British stratotype for the Lateglacial Interstadial, and that west-central Scotland should be considered as the type area for the Loch Lomond Stadial. But no suggestion had been made for a type sequence for the entire Lateglacial interval. With the proposal that the Greenland record should constitute the stratotype for stratigraphic subdivison and correlation across the N Atlantic realm (section 1.3), it might now be appropriate to consider whether there is an appropriate stratotype in Scotland. Given the numerous constraints on Scottish Lateglacial records, as discussed in section 4 above, it might be thought that the search for such a stratotype would be a fruitless exercise. But one site stands apart from all of the others, namely Whitrig Bog, and it is the composite record from this site (Fig. 14; Brooks et al. Reference Brooks, Mayle and Lowe1997a, Reference Brooks, Lowe and Mayleb; Brooks & Birks Reference Brooks and Birks2000) that we would advocate as being the most representative candidate for, and that could in due course form the basis of, an event stratigraphy for the Scottish Lateglacial.
Multi-proxy record from Whitrig Bog, southeast Scotland (from Brooks et al. Reference Brooks, Mayle and Lowe1997a), set against the Greenland event stratigraphy (left). Note how the Vedde Ash forms a comon isochron between the two records. Note also how the sub-events (GI-1a to GI-1e) in the ice core-record appear to be reflected in the chironomid temperature record, and are also matched by changes in some of the other proxies, notably in the pollen and geochemical (e.g., CaCO3) curves.

The strengths of the Whitrig Bog record are as follows:
1. The sequence is the longest continuous Lateglacial record so far obtained from any site in Scotland, spanning up to ∼2 m (Figs 8, 15); unusually for a Scottish site, the Lateglacial sequence was exposed in section enabling large monoliths to be removed for analysis. In many sites in Scotland where multi-proxy analyses have been carried out, the results have been obtained from different core sequences and, therefore, cross-correlations have had to be made between the cores. At Whitrig Bog, by contrast, sampling for the different proxies was undertaken on a single monolith and, hence, precise correlations could be established between the sampled horizons.
2. The large volumes of sediment enabled a number of proxy methods to be applied: these included pollen, plant macrofossil and chironomid analyses, and sedimentological and geochemical analyses. In addition, the monoliths were examined for tephra content, and samples were taken for radiocarbon dating.
3. The considerable thickness of Lateglacial sediment allowed sampling at a very high level of stratigraphic resolution. In all, 75 levels were analysed for pollen and chironomids; 50 in the Lateglacial Interstadial and 25 in the Loch Lomond Stadial. Given an age range of ∼1800 yr for the Interstadial and ∼1200 yr for the Loch Lomond Stadial (based on the Greenland record), this represents an average sampling interval of around 36 years for the Interstadial and 48 years for the Loch Lomond Stadial.
4. The site has produced one of the most detailed chironomid-inferred temperature records for the Scottish Lateglacial (Figs 12, 14) which, as noted above, is unique in Scotland in showing the marked rise in temperatures early in the Lateglacial Interstadial. There are close similarities between the Whitrig Bog and Greenland ice-core records (section 2.4).
5. The site contains two tephras: the Vedde Ash (∼12.1 ka) and the Borrobol Tephra (∼14.1 ka). Two independent isochrones, therefore, anchor the stratigraphic sequence (Fig. 12).
6. Throughout much of the profile, there is a close similarity between the pollen, geochemical and chironomid records, suggesting that vegetation around the site, particularly during the mid- and late-Interstadial and during the Loch Lomond Stadial, was highly sensitive to climatic changes (Fig. 14). The Whitrig Bog profile, therefore, contains an integrated record of climatic change and environmental response that is rarely found in Scottish Lateglacial sequences and, as such, constitutes a provisional stratotype for the Lateglacial in Scotland.
Lateglacial and Early Holocene sediments exposed at Whitrig Bog showing, upwards from the base: Dimlington Stadial silts and clays (1); Lateglacial Interstadial clays and marls (2); Loch Lomond Stadial silts and clays (3); and Early Holocene marls (4). The upper layers are spoil from former clay-pit workings at the site (5). The topmost deposits (6) are from the excavated profile.

The one limitation of the Whitrig Bog record is the lack of a robust chronology, for although AMS radiocarbon dates were obtained on identified terrestrial macrofossils from different levels within the sequence, those from the Lateglacial section of the profile proved to be stratigraphically anomolous and, hence, were rejected (Brooks et al. Reference Brooks, Mayle and Lowe1997a; Mayle et al. Reference Mayle, Bell, Birks, Brooks, Coope, Lowe, Sheldrick, Turney and Walker1999). It is for this reason that we are proposing the site as a provisional stratotype at this stage, pending the development of a more secure chronology for the sequence. To a degree, however, the lack of a detailed dating framework is offset by the presence of the tephras and these, combined with the clearly defined litho- and biostratigraphic boundaries at the base of the sequence and at the beginnining and end of the Loch Lomond Stadial enable ages to be ‘imported’ from comparable dated horizons in other sites. Together, these provide five chronological ‘pinning-points’ for the profile: the Loch Lomond Stadial–Holocene boundary (∼11.7 ka); Vedde Ash (∼12.1 ka); the Lateglacial Interstadial–Loch Lomond Stadial boundary (∼12.9 ka); the Borrobol tephra (∼14.1 ka); and the base of the Lateglacial Interstadial (∼14.6 ka). Of these, the last-named is perhaps the least-securely dated.
Overall, however, the close similarities between Whitrig Bog and Greenland are striking (Fig. 14), and suggests that the climatic system during the Lateglacial in Scotland was driven by the same forcing factors that were affecting other parts of the N Atlantic realm. Further refinement of the Whitrig Bog stratotype, either through the discovery of additional tephra layers or a further programme of radiocarbon dating of selected macroremains, will help determine the extent to which the Scottish Lateglacial record is the precise temporal equivalent of the Greenland sequence, or whether there are leads and lags in terms of climate forcing and response across the N Atlantic province.
6. Future prospects
The knowledge base on the Scottish Lateglacial has increased exponentially over the last four decades, and we now know a great deal more about the spatial and temporal patterns of environmental change during the time between ice-sheet retreat and the beginning of the Holocene. But, as is the case with science, the more we know the more there is to know; indeed, as has often been stated, there are ‘known knowns’, but equally, there are ‘known unknowns’ and it is the latter that pose the challenges for future researchers.
In terms of the Lateglacial, for example, we still do not know when the majority of lake sediment sequences began to accumulate; we know very little about the nature of the Scottish environment between the disappearance of glacier ice and the climatic warming at the beginning of the Interstadial; we do not have secure chronologies to underpin many of the climatic reconstructions; we still find discrepancies between environmental proxy records that remain to be explained; and the patterns of both ice sheet wastage and glacier advance and retreat during the Loch Lomond Stadial are still imperfectly understood.
And then, of course, there are ‘unknown unknowns’. A little more than thirty years ago, few would have predicted that individual fruits and seeds could be radiocarbon dated by AMS; that volcanic ash from Iceland could be found in Scottish Lateglacial lake sediments in the form of cryptotephra; or that ages could be obtained from rock surfaces and erratic boulders using cosmogenic isotopes.
But in looking to the future, some things we do know. It is now evident that in designing research strategies for Lateglacial research in Scotland, a multi-proxy approach involving a range of analytical methods needs to be employed in order to highlight the relative influences of climatic and non-climatic factors, and to discriminate between local and regional events. Equally, the focus needs to be on proxy methods that are most sensitive to shifts in climatic régimes, such as chironomid, lipid and stable isotope analyses, as these will differentiate those records where there is a potential lag in the forcing signal from those where a more immediate response to climate change is evident. Moreover, sites should be sought where thick sequences of sediment have accumulated, and those deposits need to be sampled at the highest levels of resolution that are practicable. In addition, when applying multi-proxy high-resolution sampling approaches, it is essential that a holistic strategy is adopted, with the various analyses being carried out on the same core or monolith sample, as was the case at Whitrig Bog. Too often in the past, the approach to the analysis of Lateglacial sequences has been piecemeal, with maybe an initial pollen diagram being augmented at a later stage by other analytical work, often from different cores from the same site. Potentially this adds an additional source of error, in terms of correlation and core matching.
Finally, it is important that future Lateglacial studies are based on a hypothesis-testing approach. A stand-alone study of a new site will have much greater impact if it is part of a wider programme of research that aims to test experimental questions relating to broader themes of Lateglacial environmental change, some of which have been discussed in this paper.
In relation to chronology, part of the strategy in all Lateglacial investigations should be the systematic search for cryptotephra. As noted above, fewer than 20 profiles from Scotland have yielded a tephra record, and there must be many sites where tephras exist but have yet to be discovered. Extending and refining the tephra lattice for the Scottish Lateglacial must be a high priority in future research. In terms of radiocarbon dating, it is our view that there is now little to be gained from the dating of bulk samples of limnic sediment; the potential for contamination is too great. Funds should, instead, be diverted into AMS dating of identifiable terrestrial macrofossils although, as shown by the Whitrig Bog investigation, even this strategy is not without difficulties. Indeed, attention could perhaps be directed to the dating of more unusual material by AMS, such as pollen grains (e.g., Brown et al. Reference Brown, Farwell, Grootes and Schmidt1992; Vandergoes & Prior Reference Vandergoes and Prior2003), as this approach has shown potential, especially in sites where radiocarbon cannot be applied to other materials (e.g., Fletcher et al. Reference Fletcher, Zielhofer, Mischke, Campbell, Bryant, Fink and Xu2016). To date, however, pollen concentrates are a medium that has been little used in the dating of Scottish records.
Elsewhere, further work could usefully be undertaken on varve chronology for, as shown above, while few varved sequences have so far been described from Scottish sites, it may well be the case that, as with tephras, more exist but have yet to be found.
In addition, surface exposure dating, again still a relatively new technique in Scotland, will hopefully be further refined and levels of analytical precision improved, as more is discovered about the processes involved in cosmogenic isotope production and the scaling factors that are needed to correct the age estimates. Surface exposure dating of erratics and bedrock surfaces potentially provides an important additional chronometric technique for the Lateglacial, not only in terms of the dating of glacial events, but also insofar as it contributes to the chronology of regional environmental change provided by radiocarbon dating, varved sequences and tephra isochrons.
Lastly, it is essential to continue to see the Scottish Lateglacial record not only in terms of events in Scotland, but in the context of the wider pattern of climate change in the N Atlantic realm. The Greenland isotope record remains the template with which all other regional stratotypes should be compared. Here we have advocated the Whitrig Bog record as perhaps the best available option, at present, to set against the climate signal from the ice cores. But there may be others that offer equal or greater potential, and finding auxiliary sites that can support or augment the Whitrig record must remain a further priority of Scottish Lateglacial research.
7. Acknowledgements
We are grateful to Colin Ballantyne and John Gordon for inviting us to contribute to this volume, and to Professor Pete Langdon and an anonymous referee for their helpful and constructive comments on an earlier draft of this paper. JL acknowledges the Leverhulme Trust for financial support for current new investigations into the Scottish Lateglacial environment (project EM-2014-025). We also thank Malcolm Kelsey and Jenny Kynaston (Royal Holloway) for help with the production of the illustrations, and the following colleagues who kindly provided original artwork for some of these: Des McDougall (University of Worcester), Figure 3; Ian Candy and Adrian Palmer (Royal Holloway), Figures 7 and 9; Sean Pyne-O'Donnell (Nanyang Technological University, Singapore), Figure 10; Chris Clark (Sheffield University), Figure 11; and Frank Mayle (Reading University), Figure 15.