Introduction
Obesity has become a worldwide epidemic, and data from the World Health Organization shows that 18% of children and adolescents were overweight or obese in 2016. The rise in the rate of childhood overweight and obesity follows the increase in maternal obesity. In Brazil, 39% of women of reproductive age (18–34 years old) are overweight and 13% are obese, and it has been associated with unhealthy eating habits, such as the high consumption of foods that are rich in fat and sugar. 1,2
Intrauterine events play an essential role in the origins of childhood obesity, and maternal metabolic conditions during pregnancy and lactation influence the fetal environment and perinatal development and may disrupt metabolic homeostasis that affects the long-term health of the offspring. Reference Hu, Tylavsky and Han3,Reference Nicholas, Rattanatray and Maclaughlin4 But whether maternal high-caloric food consumption promotes offspring obesity and metabolic disturbances, even in the absence of maternal excessive weight gain/obesity, remains unclear.
A recent study with humans showed that maternal pre-pregnancy obesity, excessive gestational weight gain, and gestational diabetes, individually, can predispose offspring as early as 4 years of age to obesity. Reference Hu, Tylavsky and Han3 In a study with nonhuman primates, pre-pregnant females fed a high-fat diet (HFD) were divided into obese and insulin-resistant or nonobese and insulin-sensitive. Fetal offspring from obese/insulin-resistant mothers had higher serum triglycerides (TGs) and glycerol, but differences in body weight, liver fat content, and inflammatory markers in the liver were only observed when offspring from both HFD-fed obese and lean mothers were evaluated together versus control. Reference McCurdy, Bishop and Williams5 Similar results were found in female rats that were fed either a low-fat diet or HFD prior to pregnancy or were fed HFD pair fed to the caloric intake of the low-fat group. Data suggest that maternal adiposity is the major factor in inducing obesity, hyperleptinemia, and insulin resistance in offspring. Reference White, Purpera and Morrison6
On the other hand, genetically obesity-resistant (OR) female rats fed a Western diet for 54 days prior to pregnancy programmed offspring to increased adiposity, plasma leptin, insulin, and adiponectin and decreased energy expenditure, similar to offspring from diet-induced obesity dams. Reference Frihauf, Fekete, Nagy, Levin and Zorrilla7
Therefore, there are many studies linking dietary consumption, overnutrition, or the consequent maternal excessive pre-pregnancy weight gain/obesity as the mediators of fetal metabolic programming. However, there are gaps regarding the knowledge about the contribution of different maternal phenotypes to the development of metabolic disturbances in the offspring. Thus, in the present study, we aimed to investigate whether maternal HFD consumption without the consequent obese phenotype would protect newborn and post-weaning offspring from metabolic disturbances.
Methods
Animals
All procedures contributing to this work comply with the ethical standards of the relevant national guidelines on the care and use of laboratory animals “Brazilian College for Animal Experimentation” (COBEA) and have been approved by the institutional committee “Ethical Committee for Animal Use” (CEUA), Protocol no. 3963-1, State University of Campinas – UNICAMP (Campinas, São Paulo, Brazil).
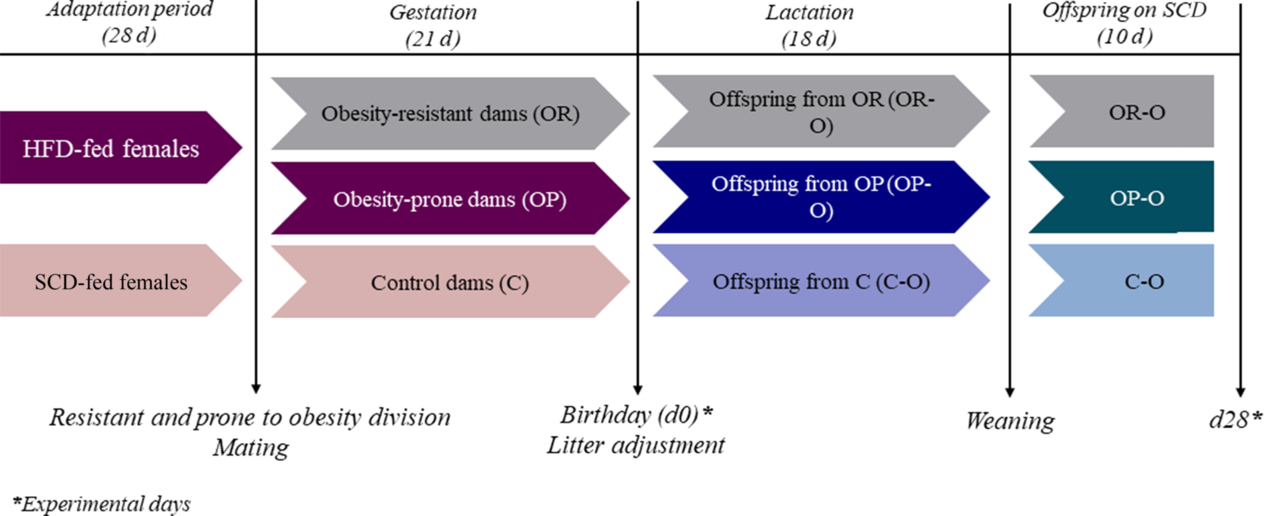
Five-week-old female and male Swiss mice (Mus musculus) were obtained from the Animal Breeding Centre at the University of Campinas (Campinas, São Paulo, Brazil). A scheme of the experimental design is illustrated in Fig. 1. Female mice were chosen randomly to receive a standard chow diet (SCD, 3.5 kcal/g, 9.5% fat) or a high-fat/high-caloric diet (HFD, 4.6 kcal/g, 45% fat) ad libitum for an adaptation period of 4 weeks before mating. Adult males were fed only SCD during the adaptation period. The HFD was prepared as described previously by Benatti et al. and de Paula Simino et al.. Reference Benatti, Melo and Borges8,Reference de Paula Simino, de Fante and Figueiredo Fontana9
Experimental design. Five-week old female Swiss mice were randomly fed a standard chow (SC) or a high-fat diet (HFD) for an adaptation period of 28 days. HFD females were classified as obesity-resistant (OR) or obesity-prone (OP) according to their weight gain, and were mated with control male mice. Females were fed the same diet of the adaptation period during gestation, and at the delivery day part of the offspring were sacrificed for the analysis. The remaining offspring were adjusted to eight per litter. Dams were maintained at the same diet of adaptation and gestation during the lactation period. At 18 days of life, offspring were weaned to SC diet, and sacrificed at d28 for the analysis.

At the end of the adaptation period, HFD females were assigned to two different groups: OR or obesity-prone (OP), according to their weight gain. Females that were situated above the median of weight gain were considered OP, while females that had a weight gain below the median were considered OR. Thus, 50% of the HFD females were assigned as OP and the other 50% as OR. Mating was performed by housing two females with one male for 3 d. After, pregnant females were maintained in individual polypropylene micro-isolators at 22°C ± 1°C and lights on from 06:00 to 18:00 h.
Females were fed the same diet of the adaptation period during gestation. On the delivery day, part of the offspring from control (C-O), obesity-resistant (OR-O), and obesity-prone (OP-O) dams were sacrificed for the analysis of the newborns (d0). The remaining litters were adjusted to eight pups per dam (about 6–7 males and 1–2 females per dam), and the dams remained on the same diet of the adaptation and gestational periods during lactation. After 18 d of lactation, offspring were weaned, transferred to SCD, and sacrificed at 28 d after birth (d28) for the analysis. The number of offspring used for each analysis is specified in the respective figure legend.
Body composition and caloric intake
Dams and pups were evaluated weekly for body weight. Body fat was estimated in d0 using the Lee index of obesity by calculating body weight (g) (1/3)/naso-anal length (cm), as described by de Paula Simino et al.. Reference de Paula Simino, de Fante and Figueiredo Fontana9 To estimate adiposity in dams and d28 offspring, white adipose tissue (epidydimal) was collected after sacrifice and weighed, and the adiposity was calculated as a percentage of adipose tissue normalized by total body weight.
Caloric intake was estimated for d28 (from d23 to d28) by weighing the food during 24 h over a period of 5 d. The average was considered as the food intake, and the results were expressed as Kcal/day.
Biochemical analysis
Blood samples were collected from the tails of females before mating, by decapitation for offspring d0 analysis and at the sacrifice, after 12 h fasting, by decapitation for d28 analysis. Serum glucose was determined on an Accu-Chek Active glucometer (Roche Diagnostics, Switzerland). Serum TGs and cholesterol (CHOL) were evaluated by enzymatic colorimetry assay kit (Roche Diagnostics, Germany).
Serum insulin was determined using Rat/Mouse Insulin Kit (Millipore Corporation, USA). Serum non-esterified fatty acids (NEFAs) were evaluated using Free Fatty Acid Assay Kit (Roche Diagnostics, Germany). Hepatic total lipids were extracted by isopropanol homogenization of the liver, followed by enzymatic colorimetry of TGs and CHOL assay kit (Roche Diagnostics, Germany).
Liver histochemistry analysis
Liver from d0 offspring were extracted, frozen, embedded in Tissue-Tek (Sakura, USA), and sectioned into 15 μm sections. The sections were fixed in methanol for 15 min at −20°C and were stained to analyze either lipid or glycogen deposition. Lipid droplets were analyzed by oil red staining (Oil Red O, Sigma Aldrich, USA) as described by Mehlem et al.. Reference Reginato, de Fante and Portovedo10 Glycogen contents were analyzed by periodic acid-schiff staining by incubating the sections in 0.5% periodic acid solution (Synth, Brazil) for 5 min, then staining with Schiff’s reagent (Sigma Aldrich, USA) for 15 min and finally counterstaining with hematoxylin solution for 2 min. All sections were analyzed by light microscopy (Leica DM 4500B microscope; Leica Imaging Systems – Germany) and quantified using ImageJ software.
Intraperitoneal glucose, insulin and pyruvate tolerance tests (GTTip, ITTip and PTTip)
Tolerance tests were performed in d28 offspring, and the same animals were used for all tests, with an interval of at least 3 d between each test (from d18 to d28). Glucose levels were determined using an Accu-Chek Active Glucometer (Roche Diagnostics, Switzerland).
For the intraperitoneal (IP) glucose test (GTTip) and insulin test (ITTip), mice were starved for 12 h, re-fed for 2 h, and starved for an additional 4 h before tests. For GTTip, a solution of 25% D-glucose was used, and each animal was injected with 1 g/kg of glucose. Serum glucose was measured at 0, 15, 30, 60, 90, and 120 min after glucose administration. For ITTip, recombinant regular insulin (1.5 UI/kg, Humulin®, Eli Lilly and Company, EUA) was administered by IP injection, and serum glucose was measured after 5, 10, 15, and 30 min. For the pyruvate test (PTTip), mice were starved for 12 h and re-fed for 2 h, and the test was performed in a fed state. A 20% pyruvate solution was administered in a dose of 2 g/kg, and serum glucose was measured at 0, 15, 30, 60, 90, and 120 min after the administration.
For both GTTip and PTTip, results are presented as area under the curve (AUC) of serum glucose versus time, above each individual baseline. For ITTip, results were calculated using the formula 0.693/t1/2 and are presented as kITT (%/min), the constant for the glucose clearance rate.
Quantitative real-time PCR
Total hepatic RNA was extracted from fragments of the liver (about 150 mg) using RNAzol RT (MRC, USA) according to the manufacturer’s recommendations. Quantification and analysis of the quality of the samples were performed using NanoDrop 2000. Reverse transcription was performed with 3 μg of total RNA with the high-capacity cDNA reverse transcription kit (Applied Biosystems, USA). Relative gene expression was determined using the Taqman detection system and primers for the target genes: Akt1 (Mm01331626_m1), G6pc (Mm0083936_m1), Irs1 (Mm01278327_m1), Pck1 (Mm01247058_m1), Pik3ca (Mm00435673_m1), Acaca (Mm01304277_m1), Fasn (Mm00662319_m1), Prkaa2 (Mm01264789_m1), and Srebf1 (Mm00550338_m1); Actin beta (Mm02619580_g1) was used as the endogenous control (Thermo Fisher Scientific, USA). Each reaction contained 20 ng of complementary DNA and real-time polymerase chain reaction (PCR) was performed on the ABI Prism 7500 Fast platform. Data were analyzed using the sequence detection system 2.0.5 and expressed as relative values determined by the comparative threshold cycle (Ct) method (2−ΔΔCt).
Statistical analysis
Results are expressed as means with their standard errors. Analysis of variance was assessed for multiple comparisons, and a post hoc test (Bonferroni) was used to determine a significance level of p ≤ 0.05. Student’s t-test was assessed to compare the analysis of two groups (Supplementary figures). The significance indicators and statistical analyses used in each graph are specified in the respective legend.
Results
Pre-pregnancy exposure to a HFD differentially alters the phenotype of OP and OR female mice
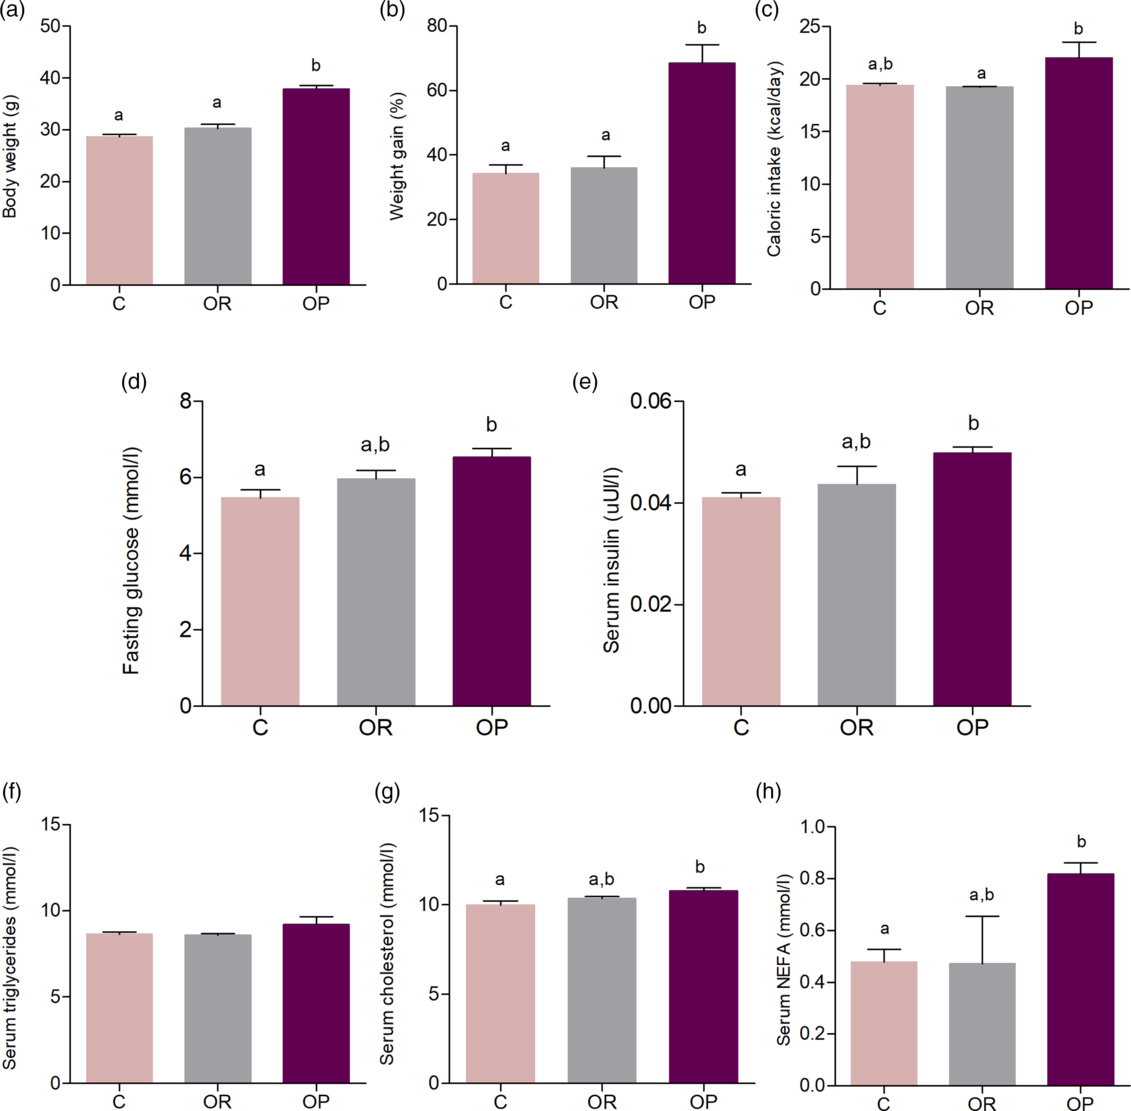
Female mice were exposed to a control (C) or a HFD for 4 weeks before mating, and animals fed a HFD were classified into OR or OP, according to their weight gain. OR females had a similar body weight compared to the C (Fig. 2a), while OP females gained ~33% more weight (Fig. 2b) at the end of the adaptation period. Similarly, OP females showed an increase in caloric intake compared to OR females (Fig. 2c). Biochemical analysis revealed that, in OP females, serum glucose (Fig. 2d) and insulin (Fig. 2e) were higher than C. Despite serum TGs having a tendency to increase in OP females (Fig. 2f), CHOL and NEFAs (Fig. 2g, 2h, respectively) were higher in OP females compared to C, which shows that even though OR and OP females were fed the same diet, only OP females had evidence of metabolic disturbances.
Evaluation of pre-pregnant SC and HFD fed females. Body weight (g) (a), weight gain (%) (b), caloric intake (kcal/day) (c), fasting glucose (mmol/L) (d), serum insulin (mmol/L) (e), triglycerides (mmol/L) (f), cholesterol (mmol/L) (g) and non-esterified fatty acids (mmol/L) (h) of control (C), obesity-resistant (OR) and obesity-prone (OP) females before mating. One-way ANOVA were used in all analysis to compare C, OR and OP groups. Values are means with their standard errors represented by vertical bars. N = 3–6 dams per group. Bonferroni post-hoc test was used to determine a significance level of p ≤ 0.05. Different letters indicate statistical significance between groups.

Interestingly, when animals from the OR and OP groups are considered as a single group (HFD), all of the evaluated parameters that we found to be different between the C and OP groups, but not in the OR group, still had statistically significant differences (Supplementary Fig. S1).
Offspring from OP dams present early metabolic disturbances, while offspring from OR dams present less pronounced metabolic impairments
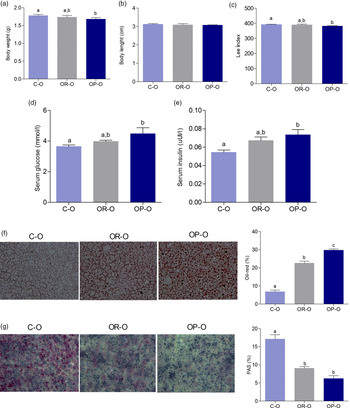
To investigate whether maternal HFD consumption without the association of an obese phenotype during gestation would protect newborn offspring from metabolic disturbances, offspring from C-O, OR-O, and OP-O dams were sacrificed and evaluated on the delivery day (d0). OP-O presented a lower body weight compared to C-O (Fig. 3a). No differences were observed in body length between the groups (Fig. 3b), but OP-O had a lower weight:length ratio in comparison to C-O (Fig. 3c).
Metabolic phenotype of newborn offspring. Body weight (g) (a), body length (cm) (b), Lee Index of Obesity (c), serum glucose (mmol/L) (d), serum insulin (mmol/L) (e), fat liver content (Oil-red staining), AF = 200x (f) and glycogen liver content (PAS staining), AF = 200x (g) of offspring from control (C-O), obesity-resistant (OR-O) and obesity-prone (OP-O) dams at the birth day (d0). One-way ANOVA were used in all analysis to compare C-O, OR-O and OP-O groups. Values are means (n = 12–30/group for body weight, body length and LIO analysis; n = 5–10/group for the other analysis) with their standard errors represented by vertical bars. Bonferroni post-hoc test was used to determine a significance level of p ≤ 0.05. Different letters indicate statistical significance between groups.

Only OP-O had higher serum glucose (Fig. 3d) and insulin (Fig. 3e), while OR-O did not differ from any other groups. Histological analysis of the liver showed that OR-O had fat accumulation and diminished glycogen content compared to C-O, but hepatic fat was even higher and glycogen content was lower in OP-O in comparison to the other groups (Fig. 3f and 3g, respectively).
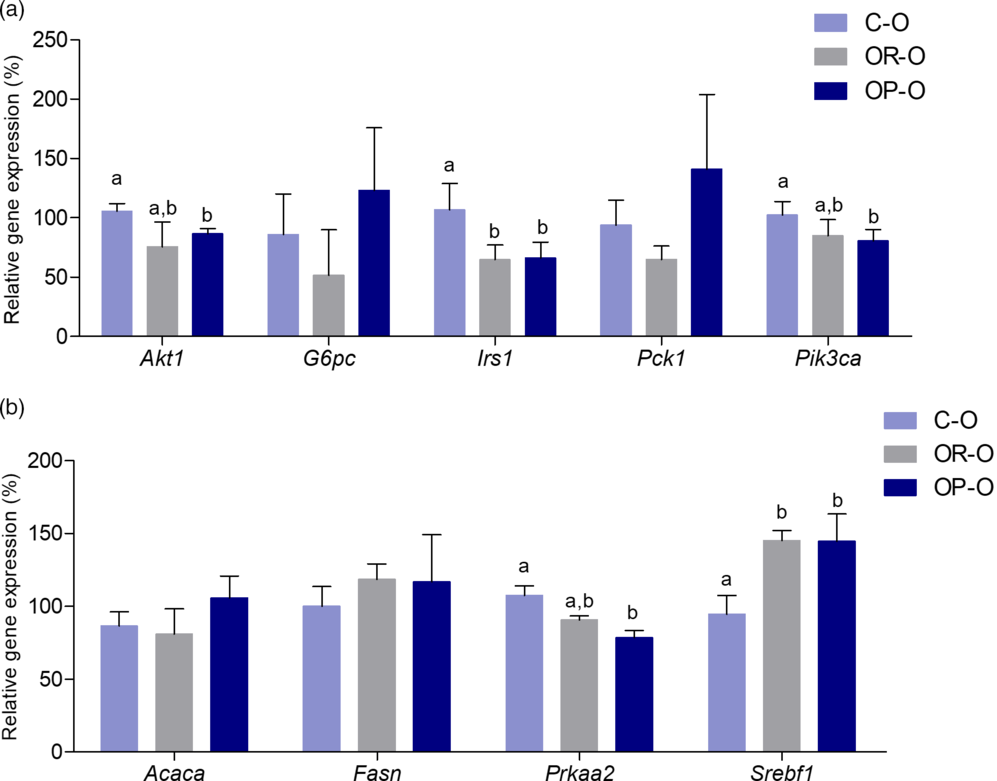
Additionally, hepatic gene expression analysis was in accordance with the phenotype observed in OP-O, since some genes involved in insulin sensitivity, such as Akt1, Irs1, and Pik3ca, were downregulated. No differences were observed in other genes involved in glucose metabolism, such as G6pc and Pck1 (Fig. 4a), and in lipid metabolism, such as Acaca and Fasn (Fig. 4b). However, Prkaa2, the gene that encodes AMPK, was also downregulated in OP-O in comparison to C-O, while Srebf1, the gene that encodes SREBP1c (a transcriptional factor involved in fatty acid synthesis), was upregulated (Fig. 4b).
Hepatic expression of genes related to glucose and lipid metabolism of newborn offspring. Hepatic relative expression (qRT-PCR) of Akt1, G6pc, Irs1, Pck1, Pik3ca (a) and hepatic relative expression (qRT-PCR) of Acaca, Fasn, Prkaa2, Srebf1 (b) of offspring from control (C-O), obesity-resistant (OR-O) and obesity-prone (OP-O) dams at the delivery day (d0). One-way ANOVA were used in all analysis to compare C-O, OR-O and OP-O groups. Values are means (n = 7–10/group) with their standard errors represented by vertical bars. Bonferroni post-hoc test was used to determine a significance level of p ≤ 0.05. Different letters indicate statistical significance between groups.

When evaluated together, the newborn offspring from OR and OP dams (HFD-O) had lower body weight and Lee index and higher serum glucose and insulin. Also, the same pattern observed in the hepatic gene expression of OP in comparison to C was found in HFD-O (Supplementary Fig. S2).
Additionally, the altered phenotype of newborn offspring correlates with maternal pre-pregnancy serum biomarkers, such as serum glucose and fat liver content of d0 offspring, directly correlate with maternal fasting glucose, insulin, and NEFAs, while liver glycogen content of d0 offspring correlate inversely with the same maternal parameters (Supplementary Fig. S3).
Although the focus of the present study was not to compare gender differences, we evaluated some parameters in female offspring. Interestingly, there were no differences in female body weight on the delivery day, but OR-O had a higher body length and Lee index. Serum glucose and liver fat contents were higher in OP-O females, while serum insulin and hepatic glycogen levels were higher in both OR-O and OP-O (Supplementary Fig. S4).
Offspring from OR dams are partially protected from metabolic disturbances after weaning, despite the similar weight gain
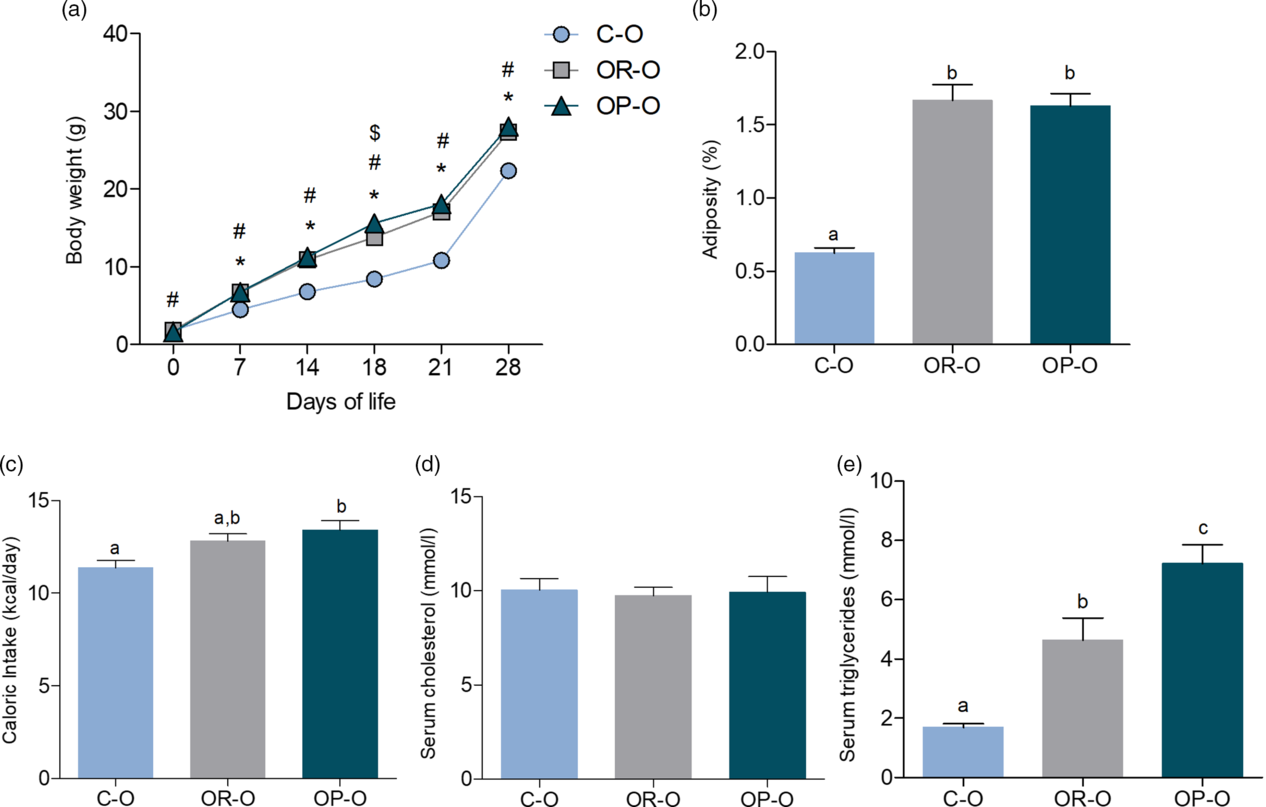
To evaluate whether the lactation period would change the scenario observed for offspring from OR dams just after gestational period, offspring from C-O, OR-O, and OP-O dams were evaluated after weaning at the 28th day (d28). Interestingly, OR-O and OP-O had fast growth from the 7th to the 28th postnatal day (Fig. 5a), and at d28 both groups had higher adiposity in comparison to C-O. Caloric intake was higher only for OP-O (Fig. 5c), while serum CHOL did not differ between groups (Fig. 5d), and serum TGs were elevated in OR-O and even more in OP-O compared to C-O (Fig. 5e).
Metabolic phenotype of recently weaned offspring. Body weight evolution (g) from d0 to d28 (a), adiposity (%) (b), caloric intake (kcal/day) (c), serum cholesterol (mmol/L) (d) and serum triglycerides (mmol/L) (e) of offspring from control (C-O), obesity-resistant (OR-O) and obesity-prone (OP-O) dams at 28 days (d28). One-way ANOVA were used in all analysis to compare C-O, OR-O and OP-O groups. Values are means (n = 8–30/group for body weight and body length analysis; n = 5–12/group for the other analysis) with their standard errors represented by vertical bars. Bonferroni post-hoc test was used to determine a significance level of p ≤ 0.05. Different letters indicate statistical significance between groups. * indicates significance level of p ≤ 0.05 between C-O and OR-O; # indicates significance level of p ≤ 0.05 between C-O and OP-O; $ indicates significance level of p ≤ 0.05 between OR-O and OP-O.

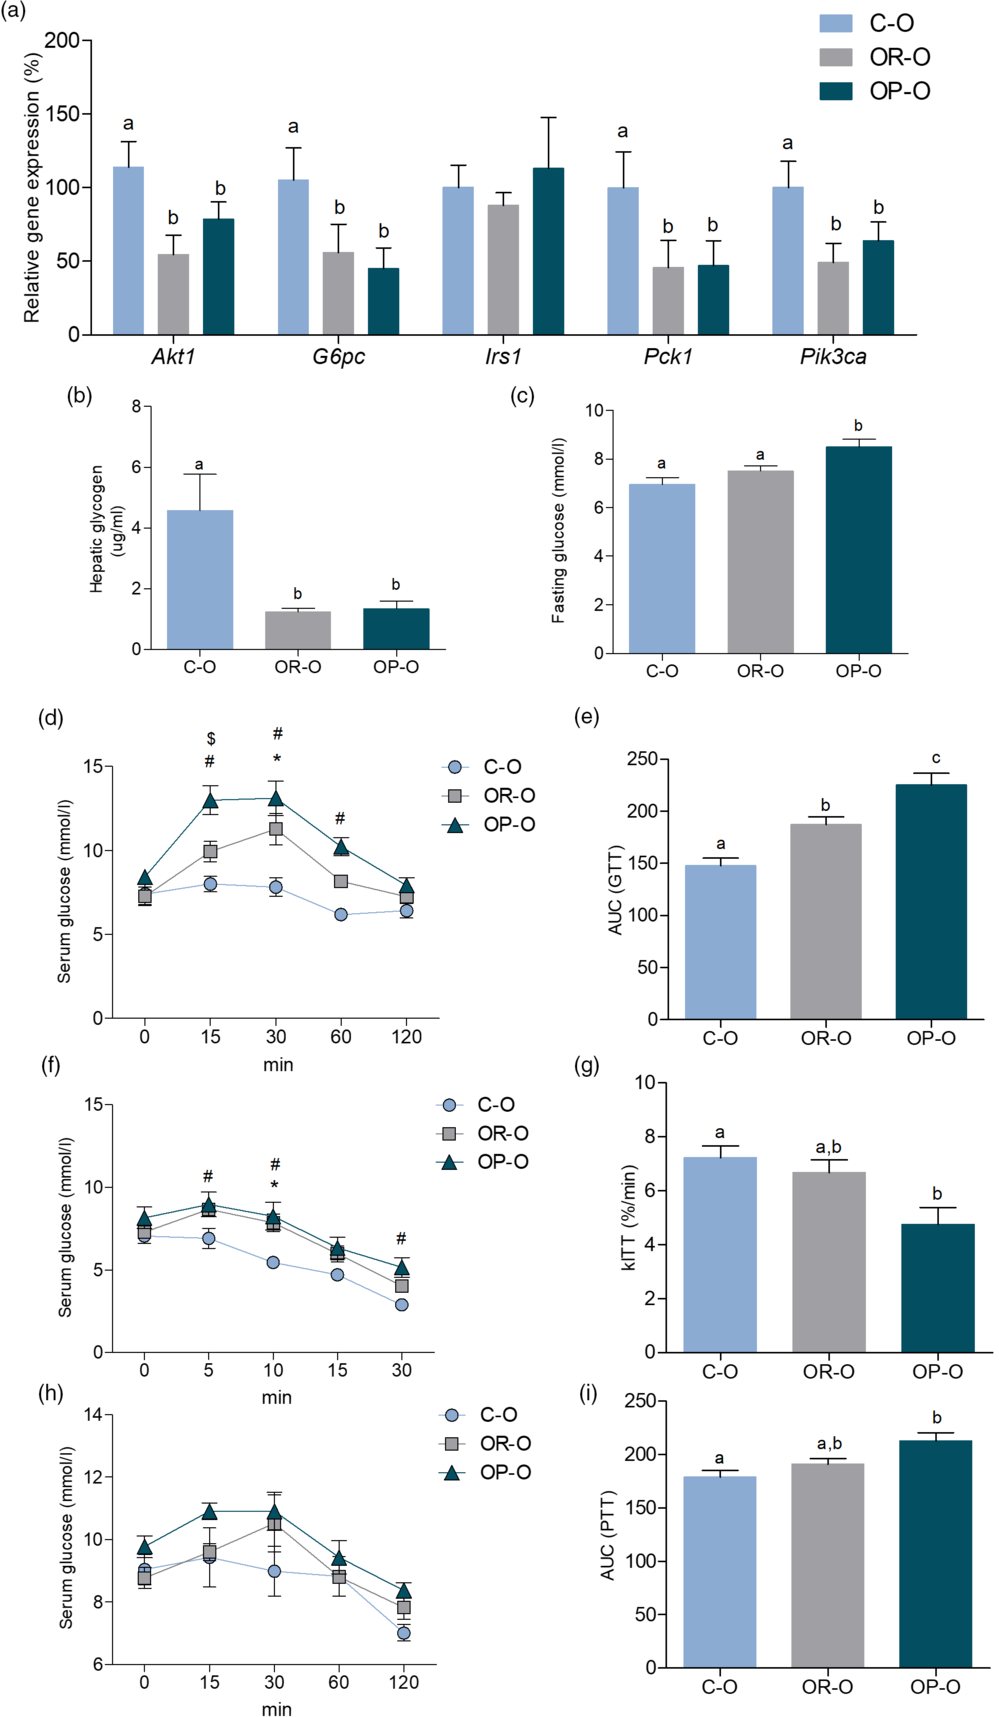
Hepatic expression of genes related to glucose metabolism and insulin sensitivity revealed a similar trend in OR-O and OP-O, since both groups had lower expression of Akt1, G6pc, Pck1, and Pik3ca compared to C-O (Fig. 6a). Also, OR-O and OP-O showed lower glycogen content in the liver (Fig. 6b), but surprisingly, serum glucose was higher in OP-O (Fig. 6c). Tolerance tests for glucose, insulin, and pyruvate showed a more pronounced impairment in glucose homeostasis in OP-O compared to C-O (Fig. 6d–6i). Despite OR-O having a higher AUC at GTTip in comparison to C-O, OP-O was even more elevated (Fig. 6e). kITT calculated from the ITTip test showed a diminished insulin sensitivity only for OP-O (Fig. 6g), and for PTTip, OP-O had higher AUC in comparison to C-O (Fig. 6i).
Glucose homeostasis of recently weaned offspring. Hepatic relative expression (qRT-PCR) of Akt1, G6pc, Irs1, Pck1, Pik3ca (a), hepatic glycogen content (µg/mL) (b), fasting glucose (mmol/L) (c), serum glucose (mmol/L) curve and AUC of GTTip (d-e), serum glucose (mmol/L) curve and kITT of ITTip (f-g), serum glucose (mmol/L) curve and AUC of PTTip (h-i) of offspring from control (C-O), obesity-resistant (OR-O) and obesity-prone (OP-O) dams at 28 days (d28). One-way ANOVA were used in all analysis to compare C-O, OR-O and OP-O groups. Values are means (n = 6–9/group) with their standard errors represented by vertical bars. Bonferroni post-hoc test was used to determine a significance level of p ≤ 0.05. Different letters indicate statistical significance between groups. * indicates significance level of p ≤ 0.05 between C-O and OR-O; # indicates significance level of p ≤ 0.05 between C-O and OP-O; $ indicates significance level of p ≤ 0.05 between OR-O and OP-O.

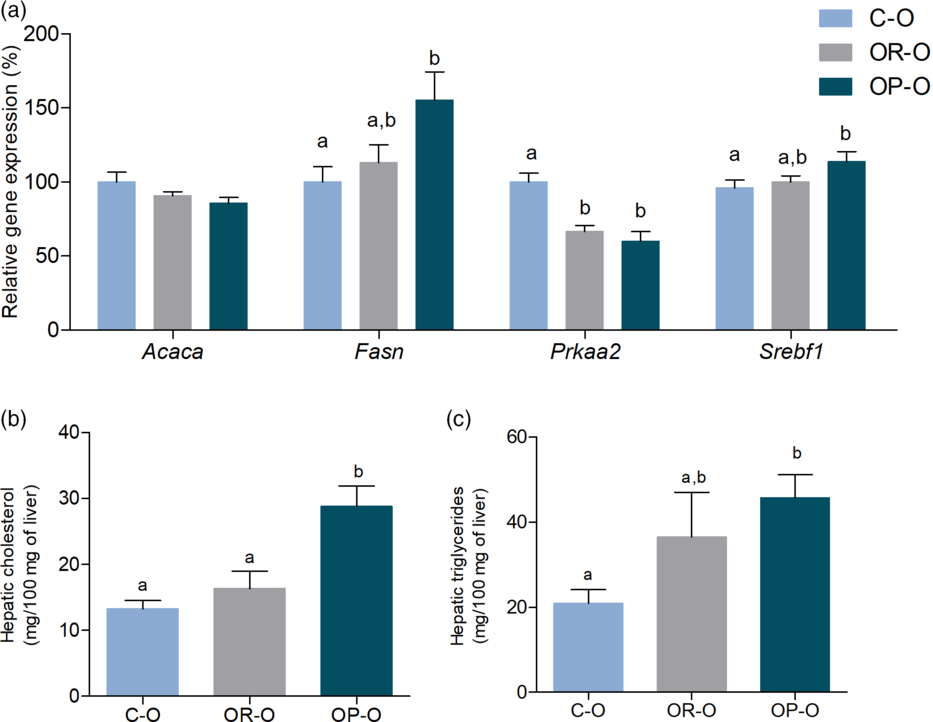
Hepatic lipid metabolism also differed between offspring from OP and OR dams. Although there were no differences in Acaca levels and the hepatic expression of Prkaa2 was downregulated in both OR-O and OP-O, the expression of Srebf1, a transcriptional factor related to lipid synthesis, and Fasn, a key enzyme in fatty acid synthesis, were upregulated only in OP-O in comparison to C-O (Fig. 7a). Furthermore, OP-O showed an increase in hepatic levels of CHOL (Fig. 7b) and TGs (Fig. 7c).
Lipid homeostasis of recently weaned offspring. Hepatic relative expression (qRT-PCR) of Acaca, Fasn, Prkaa2, Srebf1(a), hepatic cholesterol content (mg/100 mg of liver) (b), hepatic triglycerides content (mg/100 mg of liver) (c) of offspring from control (C-O), obesity-resistant (OR-O) and obesity-prone (OP-O) dams at 28 days (d28). One-way ANOVA were used in all analysis to compare C-O, OR-O and OP-O groups. Values are means (n = 6–9/group) with their standard errors represented by vertical bars. Bonferroni post-hoc test was used to determine a significance level of p ≤ 0.05. Different letters indicate statistical significance between groups.

When evaluated together, offspring from HFD dams (OR-O plus OP-O, referred to here as HFD-O) had higher caloric intake, fasting glucose, AUC at GTTip, hepatic CHOL and hepatic TGs, and lower kITT. Also, hepatic expression of Srebf1 and Fasn, which were not altered in OR-O, were higher in HFD-O (Supplementary Fig. S5). Thus, the analysis of OR and OP offspring individually is crucial to better understanding of the contributions of poor maternal dietary intake and obese phenotype to the programming of the deleterious effects.
Additionally, the correlations observed between the altered phenotype of newborn offspring and the maternal pre-pregnancy serum biomarkers were also seen in post-weaning offspring. Serum glucose and TG liver content of d28 offspring were directly correlated with maternal fasting glucose, insulin, and NEFA, and liver glycogen content was inversely correlated with the same maternal parameters (Supplementary Fig. S6).
Recently weaned OR-O and OP-O females presented with higher body weight, adiposity, and serum CHOL compared to C-O, while hepatic expression of Pik3ca was lower in the same groups. On the other hand, serum TG and glucose were elevated only in OP-O, while the liver expression of Prkaa2, G6pc, and Irs1 were lower and Fasn was higher in the same group (Supplementary Fig. S7).
Discussion
It is well established that maternal dietary components, overnutrition, obesity, and metabolic disturbances are essential mediators of offspring metabolic programming. Reference McCurdy, Bishop and Williams5,Reference Catalano, Presley, Minium and de Mouzon11–Reference Thorn, Baquero and Newsom13 We recently showed that maternal HFD consumption prior to conception and during gestation and/or lactation leads to the development of obesity in the offspring, activates pro-inflammatory pathways and the unfolded protein response, modulates autophagy mechanisms, impairs cholinergic anti-inflammatory response, disrupts energy balance control, and negatively impacts glucose and lipid metabolism in mice. Reference Benatti, Melo and Borges8–Reference Reginato, de Fante and Portovedo10,Reference Ashino, Saito and Souza14–Reference Lemes, de Souza and Payolla18 However, as the main goal of these studies was to investigate the consequences of maternal HFD consumption on the metabolic responses of offspring, they did not separately investigate whether the OP females and OR females developed obesity after consumption of a HFD. Although genetic factors contribute to the development of obesity, the literature has shown that 95% of obesity is caused by a combination of a complex set of interactions between genetic risk factors and environment influences, as monogenic defects contribute to less than 5% of all cases of severe obesity. Reference Locke, Kahali and Berndt19–Reference Ranadive and Vaisse21 Then, genetically identical mice may show different metabolic adaptation to the consumption of a HFD.
Here, we aimed to investigate whether the maternal consumption of a HFD without the obese phenotype would have different impacts on the metabolic responses of offspring. Interestingly, only the females that had increased body weight gain during the 4-week HFD exposure before mating showed higher fasting glucose, serum insulin, CHOL, and NEFA. The differences in the metabolic phenotype of OR females are in accordance with other studies. McCurdy et al. Reference McCurdy, Bishop and Williams5 and Thorn et al. Reference Thorn, Baquero and Newsom13 fed female nonhuman primates with a HFD for 2–3 years. The authors observed that females prone to develop obesity had higher insulin levels during GTT and higher serum glycerol and triacylglycerol than resistant females. Reference McCurdy, Bishop and Williams5,Reference Thorn, Baquero and Newsom13 In this study, the caloric intake of pre-pregnant females was not measured, probably due to the complications imposed by the animal model. This metabolic response certainly has influence from the genetic factors of each individual and how the gene response to overnutrition (HFD) led to metabolic disturbances. However, to isolate genetic factors, it would be necessary to include additional groups mating females and males resistant to obesity selected over some generations to compare with females and males prone to the development of obesity.
Food intake and satiety signals are controlled by complex neuronal interactions and hormonal/nutritional signaling. Reference Valassi, Scacchi and Cavagnini22,Reference Chambers, Sandoval and Seeley23 Several studies have shown the effect of HFD consumption on apoptosis in pro-opiomelanocortin (POMC) neurons, adult neurogenesis, and hypothalamic inflammation resulting in hormonal resistance to anorexigenic signals. Reference Moraes, Coope and Morari24–Reference Milanski, Degasperi and Coope27 Here, OP females ingested more calories compared to OR females, which could be associated with the increase in body weight gain. Furthermore, OP mice also had higher fasting glucose, insulin level, serum CHOL, and NEFA compared to control mice. These parameters were not different when we compared control and OR females. These results suggest that hypothalamic mechanisms associated with food intake/satiety control and glucose homeostasis may have been differently modulated by HFD consumption. As previously shown by Souza et al., Reference Souza, Solon and Nascimento28 OP and OR mice showed distinguishable hypothalamic expression of POMC, an anorexigenic neuropeptide. In addition, OP mice were hyperglycaemic, glucose-intolerant, and insulin-resistant when compared to OR and control mice. Reference Souza, Solon and Nascimento28 However, after inhibition of hypothalamic expression of POMC at early stages of the HFD exposure, the mice that were resistant became prone to obesity. Reference Souza, Solon and Nascimento28
There are few studies that aimed to investigate the contribution of the different maternal phenotypes observed after HFD consumption (OP and OR) to the development of metabolic disturbances in offspring. Previously, we showed that maternal obesity leads to lower body weight of offspring on the delivery day. Reference de Paula Simino, de Fante and Figueiredo Fontana9,Reference Reginato, de Fante and Portovedo10,Reference Melo, Benatti and Ignacio-Souza15,Reference Lemes, de Souza and Payolla18 Interestingly, literature has shown that newborns presenting even high or low birth weight have metabolic complications later in life. Reference de Paula Simino, de Fante and Figueiredo Fontana9,Reference Fante, Simino and Reginato17,Reference Desai, Jellyman and Ross29–Reference Parlee and MacDougald31 Here, we showed that only newborn offspring from OP dams had low body weight and Lee index on the delivery day in comparison to offspring from control dams. We did not observe this phenotype in OR-O mice. Furthermore, only OP-O mice had higher serum glucose and insulin and diminished Akt1, Pik3ca, and Prkaa2 compared to control mice, suggesting the reduction of lipid oxidation and insulin signaling. Here, we detected fatty liver deposition in OR-O and OP-O mice, but the amount was more pronounced in OP-O mice. Insulin resistance and disturbances in lipid metabolism have been associated with fatty liver. Reference Chao, Chao, Lin, Ku and Cheng32–Reference Yki-Järvinen34 The Prkaa2 (AMPK) presents important function in the control of lipid metabolism, inhibiting anabolic enzymes (such as acetyl-CoA carboxylase and HMG-CoA reductase) and activating catabolic pathways. Furthermore, Zhou et al. Reference Zhou, Peng and Xu35 showed that the reduction of AMPK activity in the offspring of obese dams decreased expression of genes related to fatty acid oxidation, favoring fat deposition in the liver in response to overnutrition.
The effect of maternal obesity on fetal and adult life outcomes is still controversial. McCurdy et al. Reference McCurdy, Bishop and Williams5 observed that both fetuses of obese or lean HFD dams had lower body mass compared to control. Additionally, the literature has shown that both low and high birth weight predisposes offspring to obesity and metabolic complications later in life. Reference Desai, Jellyman and Ross29–Reference Parlee and MacDougald31 In another study, the authors showed that, in humans, pre-pregnancy maternal obesity and diabetes did not affect birth weight between newborns from diabetic, obese, and control mothers. Reference Duan, Sun, Que, Li, Yang and Liu36 We did not evaluate the offspring in the adult life to suggest any consequences of low birth weight on delivery day. However, it is important to consider that the lactation period has a pivotal role in the hypothalamic development and adaptions of metabolic tissues that in turn may contribute to a harmful or beneficial phenotype in the adult life.
We evaluated body weight gain and adiposity from d0 to d28. OP-O and OR-O mice had similar parameters, but they were higher than control mice. These results suggest that the maternal milk of OR and OP dams should have similar composition, contributing equally for the adiposity of OR-O and OP-O mice. Indeed, Monks et al. Reference Monks, Orlicky and Stefanski37 showed that milk from OR and OP dams of C57Bl/6 J mice fed with HFD have similar insulin, leptin, and fatty acid composition. Furthermore, MUFA, PUFA, n-6/n-3, and 18:2/18:3 ratios were higher in HFD than low-fat dams milk independent of segregation into OR and OP. Reference Monks, Orlicky and Stefanski37 Although we did not evaluate the maternal milk composition, it may be the main cause of the increased weight gain in offspring from HFD dams. Previously, using a cross-fostering protocol, we showed that offspring from control dams nursed by a HFD/obese dam had similar body weight and adiposity, higher serum glucose and TGs, and alterations in hepatic lipid metabolism compared to offspring born and nursed by a HFD/obese dam after weaning. Reference de Paula Simino, de Fante and Figueiredo Fontana9 However, as the HFD dams were also obese in our previous study, it was not possible to address whether the major consequences for the metabolism of the recently weaned offspring come from the maternal diet or phenotype. Generally, the gene expression of Akt1, G6pc, Pck1, and Pik3ca (except Irs1) demonstrated a significant reduction in offspring of dams that consumed a HFD, regardless of maternal phenotype, compared to control offspring. However, glucose homeostasis (fasting glucose, AUC-GTT, kITT, and AUC-PTT) and hepatic lipid metabolism (Fasn, Srebf1, TGs, and CHOL) were markedly affected by maternal phenotype, suggesting that, even the milk composition of the dams been knowingly similar, Reference Monks, Orlicky and Stefanski37 the weight gain of the OP dams during the intrauterine development of offspring reflects a worsening in the metabolic parameters of offspring and potentiates metabolic liver disease after weaning, which possibly persists into late adulthood, maintaining the condition of metabolism dysregulation observed in the OP-O offspring.
Although we have not evaluated the offspring in the adult life stages, we speculate that adult OP-O mice, especially if challenged with a HFD, would have more pronounced metabolic impairments compared to OR-O mice. Both newborn and recently weaned offspring showed positive correlation between serum glucose level and liver fat content with maternal pre-pregnancy serum glucose, insulin, and NEFA, while hepatic glycogen negatively correlated with the same maternal parameters. The high rates of serum glucose, insulin, and NEFA are common findings in insulin-resistant individuals. Reference Wilcox38,Reference Karpe, Dickmann and Frayn39 In this context, Isganaitis et al. Reference Isganaitis, Woo and Ma40 used female mice haploinsufficient for insulin receptor substrate-1 (IRS1) that were hyperinsulinemic and insulin-resistant but had normal serum glucose and body weight. There were observed no differences in adiposity, but male offspring exposed to maternal insulin resistance were glucose-intolerant and had higher serum glucose and insulin. When challenged with a HFD, offspring had increased hepatic lipid accumulation and serum fatty acids. Thus, the authors suggest that maternal insulin resistance can independently promote metabolic perturbations in offspring. Reference Isganaitis, Woo and Ma40
Although the mechanisms by which the metabolic alterations observed in offspring from obese dams are not fully understood, several studies suggest that epigenetic mechanisms may be closely related to this phenomenon. Reference Frihauf, Fekete, Nagy, Levin and Zorrilla7,Reference de Paula Simino, de Fante and Figueiredo Fontana9,Reference Keleher, Zaidi and Shah41–Reference Ivanova, Chen, Segonds-Pichon, Ozanne and Kelsey43 We have previously described that male mice offspring from HFD obese dams presented the same alterations on key hepatic microRNAs involved in the lipid metabolism and their respective targets at d0 and d28, even when a cross-fostering protocol were applied. Reference de Paula Simino, de Fante and Figueiredo Fontana9 This fact is indicative that both the intrauterine environment and milk composition can trigger metabolic changes in the offspring, possibly sharing similar molecular mechanisms. Furthermore, although at that time the objective was not to segregate dams into OP and OR, it was possible to observe a cumulative effect in the offspring that was born and breastfed by obese dams. On the other hand, Frihauf et al. Reference Frihauf, Fekete, Nagy, Levin and Zorrilla7 observed that global DNA methylation levels were reduced in the hypothalamus of newborn rat offspring of OP dams fed with Western diet, increasing the risk for obesity development. Interestingly, the authors observed no effect on global DNA methylation levels of recently weaned offspring of OR dams fed with Western or chow diet, suggesting that the milk composition of dams fed with Western diet did not interfere in the weight gain, adiposity, and food intake demonstrated by OR rats through the same mechanism triggered for OP rats. Reference Frihauf, Fekete, Nagy, Levin and Zorrilla7 Certainly, further experiments are necessary to address this question.
Our findings corroborate previous studies that not only suggest the importance of maternal metabolic and hormonal changes induced by HFD consumption in the fetal outcome but also show that offspring from OP and OR dams should be analyzed separately. Furthermore, the phenotype of HFD OP dams prior to pregnancy potentiates glucose and lipid impairments in male newborn and recently weaned offspring, whereas maternal resistance to diet-induced obesity is able to partially mitigate early metabolic disturbances and risk of non-alcoholic fatty liver disease (NAFLD) in offspring.
Acknowledgments
None.
Financial support
This work was supported by grants from the Coordenação de Aperfeiçoamento de Pessoal de Nível Superior (CAPES, financial Code 001), National Council for Scientific and Technological Development (CNPq, Torsoni AS grant # 310129/2016-8), and São Paulo Research Foundation (FAPESP, Simino LA grant # 2015/01947-7 and Torsoni AS grant # 2016-18321-6). Laboratory of Metabolic Disorders belongs to the Obesity and Comorbidities Research Center (OCRC).
Conflicts of interest
All authors declare no conflicts of interest.
Ethical standards
The authors assert that all procedures contributing to this work comply with the ethical standards of the relevant national guidelines on the care and use of laboratory animals “Brazilian College for Animal Experimentation” (COBEA) and have been approved by the institutional committee “Ethical Committee for Animal Use” (CEUA), Protocol no. 3963-1, State University of Campinas – UNICAMP (Campinas, São Paulo, Brazil).
Supplementary material
For supplementary material for this article, please visit https://doi.org/10.1017/S204017442000094X