Introduction
The aim in no-till seeding is to disturb the soil as little as possible, to preserve the surface residues, and to place the seeds at a proper depth (Derpsch et al. Reference Derpsch, Franzluebbers, Duiker, Reicosky, Koeller and Friedrich2014), which in turn will result in a reliable seed germination and plant emergence. However, harsh soil conditions, like soil undulation and crop residues, increase the difficulty of seeding operation when trying to achieve a constant seeding depth. Overcoming this difficulty requires a seeding machine, which can interact appropriately with the harsh soil conditions. The response of seeder dynamics to the untilled soil undulations and the crop residues, in terms of soil-machine interaction, could be described by the forces arising at the interface, where the coulter and the packer wheel interact with the soil (Chen et al., Reference Chen, Munkholm and Nyord2013). By simulating the response of seeder dynamics, a semi-active dumping system could be developed to reduce the amplitude of these forces leading, thus, to an optimised seeding depth.
The study of farm machinery by simulating its dynamics has been conducted by many researchers. Lawrance (Reference Lawrance1969) developed the mathematical model of a semi-mounted seeding implement and simulated its dynamic response to surface undulations. His research showed that the vertical excessive oscillations of the furrow-opening component, which described the motion behaviour of the seed depositing apparatus, were due to the dynamic response of the machine from soil undulations. To develop an automatic depth control system of a seeder, its dynamic response was modelled and simulated in laboratory condition by Weatherly and Bowers (Reference Weatherly and Bowers1997). By introducing a simulation model of an oscillating subsoiler dynamic behaviour, Shahgoli et al. (Reference Shahgoli, Fielke, Saunders and Desbiolles2010) demonstrated the effect of the field profile and stiffness and damping of subsoiler tyres, on the vertical motion behaviour of the machine, However, limited studies have been conducted on developing a simulation model of no-till direct seeder vertical motion behaviour using the corresponding actual surface profile and measured forces.
Data fusion of modern sensors, such as robotic total stations, inertial measurement units, and laser pointers, whose accuracy have been tested under in-field condition (Paraforos et al., Reference Paraforos, Griepentrog, Vougioukas and Kortenbruck2014 and Reference Paraforos, Griepentrog, Geipel and Stehle2015), could provide the means to assess the seeder performance and optimise its dynamics for precise seed placement. Recent research by Sharipov et al. (Reference Sharipov, Paraforos and Griepentrog2016) showed that the seeder’s performance is highly affected by the soil undulations. In addition, the seeding depth is significantly influenced by the vertical forces, the profile impact forces, and the operation speed. The analysis of the correlation between the measured forces and the seeding depth variation indicated specific critical frequencies, where extreme seeding depth variation occurs. Therefore, there is the necessity to simulate the seeder dynamics in order to be able to optimise the dynamic parameters by taking into account those critical frequencies.
A project was set up to optimise a no-till seeder, in terms of vertical motion stability, to reduce the variation of seeding depth under realistic, high-capacity performance. With the aim to simulate the dynamics parameters of seeder, this paper focuses on developing a mathematical model of the seeding aggregate vertical motion behaviour and perform a simulation of its dynamics using the measured surface profile and vertical forces. To validate the simulation model, the root-mean-squared (RMS) error percentage and correlation coefficient could be used to evaluate the relationship between the simulated and the measured pitch angle and profile impact forces. Furthermore, the simulated profile impact forces should be correlated with the measured ones in the frequency domain to define if the developed model produces forces at similar critical frequencies as the measured ones.
Material and Methods
Instrumentation
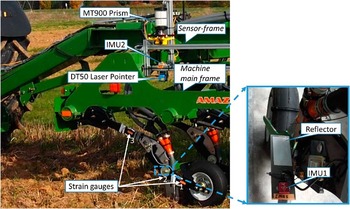
An AMAZONE 12 row no-till direct seeder (AMAZONEN-Werke H. Dreyer GmbH & Co. KG, Hasbergen, Germany) and a 6210 R 156.6 kW tractor (John Deere, Moline, Illinois, USA) were used to perform direct seeding operations. A metal sensor-frame that was mounted on the main frame of the seeder was developed to carry all the needed sensors (Figure 1). An SPS930 total station (Trimble, Sunnyvale, USA), tracking a Trimble MT900 prism fixed on the developed sensor-frame, was used to obtain the in-field absolute geo-referenced position of the main frame of the seeder. Two VN-100 IMUs (VectorNav, Dallas, USA), one on the sensor-frame and a second one fixed to a plate, provided dynamic tilt information of the main frame and the seeding aggregate, respectively. To detect the distance from the sensor-frame to the metal plate mounted on the seeding aggregate, a DT50 laser range finder (SICK AG, Waldkirch, Germany) was employed. The vertical and surface profile impact loads were recorded using three linear 350 Ohm DY41-1.5 strain gauges (HBM GmbH, Darmstadt, Germany) with two parallel measuring grids attached at the critical points on the seeding aggregate.
The developed sensor-frame for capturing machine dynamics.

Data Acquisition
Field experiments with a traveling speed of 10 km h–1, under stubble field condition, while seeding wheat, were conducted. The soil at the field was slightly stagnic luvisol with 9.4% sand, 68.1% silt, and 22.6% clay. The measured stubble density was 177 plants per m2 with an average height of 15 cm. During these experiments, data were acquired related to surface profiles, forces, and machine dynamic parameters. A CatmanEasy-Ap software for a QuantumX-MX840B data acquisition system (HBM GmbH, Darmstadt, Germany) was used to record the data from the strain gauges with a 300 Hz sampling rate. For storing the data from the total station, the IMUs and the laser pointer, a developed software in Microsoft Visual Studio C# 2010 (Paraforos et al., Reference Paraforos, Griepentrog and Vougioukas2016), which had a multi-thread architecture making possible parallel data recording, was employed. The sampling rate of the laser pointer and the IMUs was 62 and 40 Hz, respectively. The total station was providing data with a maximum value of 20 Hz. Due to the different sampling rate from the sensors, a linear interpolation method was used to calculate the values at desired time during post-processing.
Mathematical modelling and simulation
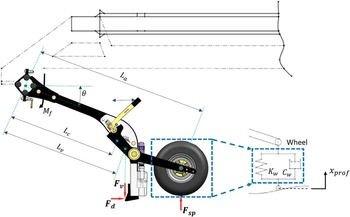
The seeding aggregate together with the main frame of the seeder can be considered as a damped swinging arm mechanism with a rubber wheel (Figure 2). An equation of motion for a damped swinging arm mechanism can be found in the literature in terms of mechanical vibrations (Inman, Reference Inman2014; Saeys et al., Reference Saeys, Mouazen, Anthonis and Ramon2004). By taking into account the moment of the vertical forces on the coulter (F v ), and the applied force from the main frame at the aggregate fixed point (M ƒ), the equation of motion can be described as follows:
 $$\left( {m_{w} {\plus}{{m_{a} } \over 4}} \right)L_{a}^{2} \ddot{\theta }{\,\equals\,}F_{{sp}} L_{a} {\minus}\left( {(m_{w} {\plus}m_{a} )gL_{c} {\plus}F_{v} L_{v})\theta} \right{\minus}M_{f} $$
where m a and m w are the mass of the aggregate and the wheel, respectively [kg]; L a is the distance between the aggregate fixing point on the main frame and the wheel axle [m]; L c is the distance between the aggregate fixing point on the main frame and the centre of mass [m]; L v is the distance between the aggregate fixing point on the main frame and the point that vertical forces acting on the aggregate [m]; and F sp are profile impact forces [N].
The sketch of seeding aggregate that was used for modelling.

The profile impact forces can be defined by the stiffness and damping properties of the tyre, and the vertical surface profile (x prof ). Therefore, the governing equation for the wheel motion behaviour can be derived as:
 $$F_{{sp}} {\,\equals\,}K_{w} \left( {x_{{prof}} {\minus}L_{a} \theta } \right){\plus}C_{w} (\dot{x}_{{prof}} {\minus}L_{a} \dot{\theta })$$
where K w is the stiffness of the tyre [N m–1] and C w is the damping coefficient of the tyre [N s m–1].
The vertical stiffness and damping coefficient of the attached tire (4.80–8 NHS which is non-high way tire with 4.80 [in] width and 8 [in] rim diameter ) were calculated from the following formulas (Lines and Murphy, Reference Lines and Murphy1991)
 $$ K_{w} {\,\equals\,}172{\minus}177R{\plus}5.6A{\plus}34WRP$$
 $$C_{w} {\,\equals\,}C_{o} {\plus}70P$$
where R is rim diameter [in]; W is the tire section width [in]; A is the tire age [years]; P is the inflation pressure [kPa] and C o is the vertical damping of tyre at zero inflation pressure [kN s m–1]
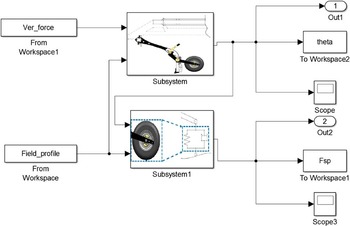
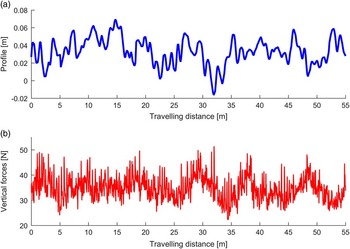
The equations from (1) to (4) were programmed and modelled using MATLAB and Simulink (Figure 3). The model uses as input the measured field surface profile and the measured vertical forces on the coulter, shown in Figure 4 (Sharipov et al., Reference Sharipov, Paraforos and Griepentrog2016), to simulate the profile impact forces and pitch angle of the aggregate vertical motion.
Simulink model.

The measured (a) field surface profile and (b) vertical forces.

Correlation between the measured and the simulated data
The correlation between the simulated and the measured forces and pitch angles was performed by calculating the RMS error percentage. The RMS error percentage explains the errors in the absolute fitting of the simulated data to the measured data. A smaller percentage of RMS errors indicates a higher correlation between those two data sets. The RMS error values that are less than 25% are considered acceptable. The following equations were employed to calculate the errors:
 $${\varepsilon}_{{rms}} {\,\equals\,}{{\left| {Y_{{rms}}^{m} {\minus}Y_{{rms}}^{s} } \right|} \over {Y_{{rms}}^{m} }}{\times}100\,\%\,$$
where
 $Y_{{rms}}^{m} {\equals}\sqrt {\mathop{\sum}\nolimits_{i{\equals}1}^N {(y_{m} (t)^{2} )\,/\,N} } ;\ \ Y_{{rms}}^{s} {\equals}$
 $\sqrt {\mathop{\sum}\nolimits_{i{\equals}1}^N {(y_{s} (t)^{2} )\,/\,N} }; $
y
m
(t) and y
s
(t) are the measured and simulated data, respectively, within the time t spent traveling the specified distance of 20 m; N is the total number of samples in the measured and simulated data.
The fitting accuracy of the simulated data to the measured data was also described with a correlation coefficient. The value of the correlation coefficient ranges between –1 and 1. The greater absolute value of the correlation coefficient expresses a stronger relationship between the two data sets. Conversely, the value closer to 0 shows a weaker relationship. The values higher than 0.5 could be considered as practically acceptable (Ngwangwa et al., Reference Ngwangwa, Heyns, Breytenbach and Els2014). The correlation coefficient can be determined by the following formula:
 $$R{\,\equals\,}1{\minus}\left( {{1 \over {N{\minus}1}}\mathop{\sum}\limits_{i{\,\equals\,}1}^N {\left( {{{y_{m} \left( t \right){\,\minus\,}\overline{{y_{m} \left( t \right)}} } \over {\sigma _{{y_{m} }} }}} \right)} \left( {{{y_{s} \left( t \right){\,\minus\,}\overline{{y_{s} \left( t \right)}} } \over {\sigma _{{y_{s} }} }}} \right)} \right)^{2} $$
where
 $\overline{{y_{m} (t)}} $
and
 $\sigma _{{y_{m} }} $
are the mean and standard deviation of y
m
(t), respectively, and
 $\overline{{y_{s} (t)}} $
and
 $\sigma _{{y_{s} }} $
are the mean and standard deviation of y
s
(t), respectively.
Results and discussion
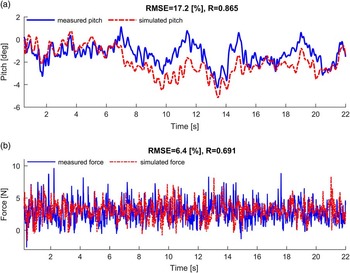
Figure 5 shows the simulated pitch angle of the aggregate vertical motion and profile impact force compared to the measured ones. The calculated RMS error percentage (Equation 5) and the correlation coefficient (Equation 6) are presented on the title of each plot. The RMS error between the simulated and the measured pitch angle (Figure 5a) was equal to 17.2%. In addition, the linear correlation between the measured and the simulated pitch angle indicated a correlation coefficient equal to 0.865, which implied that the goodness of relationship between those two data is practically acceptable. However, the results presented in Figure 5b between the measured and simulated impact forces showed a smaller RMS error equal to 6.4%. The correlation coefficient in this case was 0.691.
The measured and the simulated (a) pitch angle of the aggregate and (b) profile impact forces.

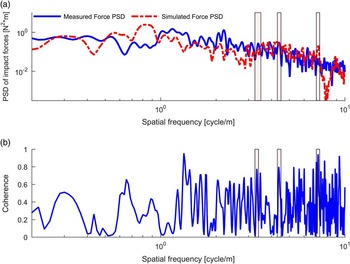
Due to the frequency of interests, a correlation based on coherence analysis between the measured and simulated forces in the frequency domain were carried out. The Power Spectrum Density (PSD) and the coherence function for the measured and the simulated impact forces are presented in Figure 6. Three corresponding peaks responsible for seed depth variation, where the peaks of both datasets matched with more than 95% shape confidence, were detected at the spatial frequencies of 3.34, 4.35 and 8.2 cycles m–1, which are equal to frequencies of 8.3 Hz, 10.7 Hz, and 20.6 Hz, respectively, in both datasets (Figure 6a). The resulting coherence values for these three peaks were equal to 0.73, 0.79 and 0.94, respectively (Figure 6b). This analysis showed that the correlation between the measured and simulated impact forces is high and the corresponding frequencies to the critical frequencies of the measured impact forces were captured in the simulated forces data set.
Power Spectrum Density (PSD) of the measured and simulated forces (a) and the corresponding coherence function (b).

Conclusions
A mathematical model of the seeding aggregate vertical motion behaviour was developed and its dynamic responses, in terms of profile impact forces and pitch angle of the aggregate vertical motion, were simulated using the measured surface profile and vertical forces. To compare the simulated pitch angle and impact force with the measured ones, a linear correlation was performed based on the RMS error percentage. The resulting RMS error percentage depicted a good correlation with the correlation coefficient of 0.865 between the simulated and measured pitch angle of the aggregate vertical motion. However, this value was equal to 0.691, which showed an acceptable correlation between the simulated and the measured profile impact forces.
The frequency content analyses of the simulated measured profile impact forces were executed. The defined critical frequencies of the measured profile impact forces at 8.3 Hz, 10.7 Hz, and 20.6 Hz, where extreme seeding depth variation occurred, were detected in the corresponding frequency content of the simulated profile impact forces with a high coherence values of to 0.73, 0.79 and 0.94, respectively. These values indicated that the developed model can produce similar results as the measured ones. The critical frequencies of the simulated profile impact forces could be used as the main parameter in optimising the seeding aggregate dynamics and implementing a mechanism, which could reduce the effect of these frequencies for better seed placement.
Acknowledgements
The financial support of GA nr 213-2723/001–001–EM Action2 TIMUR (Training of Individuals through Mobility to EU from the Uzbek Republic) project is gratefully acknowledged. The authors would like to thank Ch. Gall from AMAZONEN-WERKE H. Dreyer GmbH & Co.KG for providing the machine and assisting during the field experiments. The project is conducted at the Max-Eyth Endowed Chair (Instrumentation & Test Engineering) at Hohenheim University (Stuttgart, Germany), which is partly grant funded by the Deutsche Landwirtschafts-Gesellschaft (DLG) e.V.