


1. Introduction
The population dynamics can be investigated via reaction–diffusion systems or discrete patch models [Reference Okubo and Levin1, Reference Cantrell and Cosner3]. For some biological species, time delays such as the maturation time and hunting time may have important effect on the population dynamics, and it should be included in the modelling process. Therefore, various reaction–diffusion models with time delay and delayed patch models have been proposed to understand the interaction between biological species [Reference Magal and Ruan30, Reference Wu40].
For reaction–diffusion models with time delay, time delay-induced Hopf bifurcations and double Hopf bifurcations were studied extensively. For example, one can refer to [Reference Faria16, Reference Gourley and So18, Reference Hadeler and Ruan20, Reference Morita31, Reference Shi, Ruan, Su and Zhang33, Reference Yoshida43] and references therein for results on Hopf bifurcations of reaction–diffusion models with time delay under the homogeneous Neumann boundary conditions, and see [Reference Du, Niu, Guo and Li13, Reference Du, Niu, Guo and Wei14] for results on double Hopf bifurcations. For the case of the homogeneous Dirichlet boundary conditions, delay-induced Hopf bifurcations were studied in [Reference Busenberg and Huang2, Reference Chen and Shi10–Reference Chen and Yu12, Reference Guo and Yan19, Reference Hu and Yuan21, Reference Su, Wei and Shi37, Reference Su, Wei and Shi38, Reference Yan and Li42] and references therein, and the bifurcating stable periodic solutions through Hopf bifurcation are usually spatially heterogeneous. Moreover, spatial heterogeneity was recently taken into consideration for reaction–diffusion models with time delay, and the associated Hopf bifurcations were investigated in [Reference Chen, Lou and Wei6, Reference Chen, Wei and Zhang9, Reference Huang and Chen22, Reference Jin and Yuan24, Reference Li and Dai26, Reference Shi, Shi and Song34].
There are also extensive results on bifurcations for delayed patch models. For the spatially homogeneous environments, one can refer to [Reference Chang, Duan, Sun and Jin4, Reference Duan, Chang and Jin15, Reference Fernandes and de Aguiar17] and references therein for dispersal-induced Turing bifurcations, and delay-induced Hopf bifurcations were also studied extensively, see, for example, [Reference Chang, Liu, Sun, Wang and Jin5, Reference Madras, Wu and Zou29, Reference Petit, Asllani, Fanelli, Lauwens and Carletti32, Reference So, Wu and Zou36, Reference Tian and Ruan39]. Considering the spatial heterogeneity, Liao and Lou [Reference Liao and Lou27] investigated the following two-patch model, which models the growth of a single species:
 \begin{equation} \begin{cases} \displaystyle \frac{d u_{1}}{d t}=d\left(\alpha _{11}u_{1}+\alpha _{12} u_{2}\right)+\mu u_{1}\left [m_{1}-u_{1}(t-r)\right ], & \quad t\gt 0, \\[10pt] \displaystyle \frac{d u_{2}}{d t}=d\left(\alpha _{21}u_{1}+\alpha _{22} u_{2}\right)+\mu u_{2}\left [m_{2}-u_{2}(t-r)\right ], & \quad t\gt 0, \end{cases} \end{equation}
where
 $u_j$
denotes the population density in patch
 $j$
and time
 $t$
,
 $d$
is the dispersal rate,
 $\mu$
is a scalar factor,
 $r$
represents the maturation time and
 $m_j$
is the intrinsic growth rate in patch
 $j$
, which depends on patch
 $j$
and represents the spatial heterogeneity. Dispersion matrix
 $A\,:\!=\,(\alpha _{jk})_{2\times 2}$
in [Reference Liao and Lou27] is chosen to be
 \begin{equation*} (a) \;\alpha _{11}=\alpha _{22}=-1, \alpha _{12}=\alpha _{21}=1, \;\;\text {or}\;\;(b) \;\alpha _{11}=\alpha _{22}=-2, \alpha _{12}=\alpha _{21}=1, \end{equation*}
where
 $\alpha _{jk}(j\ne k)\ge 0$
denotes the rate of population movement from patch
 $k$
to patch
 $j$
, and
 $\alpha _{jj}\lt 0$
denotes the rate of population leaving patch
 $j$
. Model (1.1) with dispersion matrix
 $(a)$
(respectively,
 $(b)$
) can be regarded as a discrete form of Hutchinson’s model under the homogeneous Neumann (respectively, Dirichlet) boundary condition. For case
 $(a)$
, the dispersion matrix satisfies
 $-\alpha _{jj}=\sum _{k \neq j} \alpha _{kj}$
for
 $j=1,2$
, which implies that the two-patch habitat is closed, and there is no population loss during the dispersal. For case
 $(b)$
, the dispersion matrix satisfies
 $-\alpha _{jj}\gt \sum _{k \neq j} \alpha _{kj}$
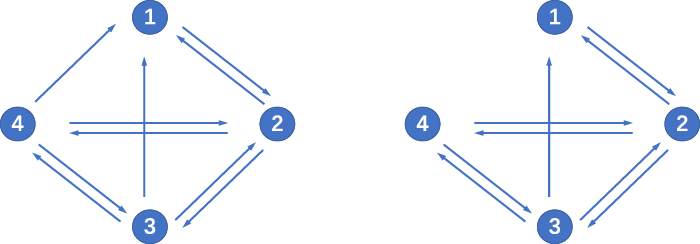
, and the species has population loss at the boundary, see Figure 1.
The connection between two patches. (Left) Dispersion matrix
 $(a)$
; (right) dispersion matrix
 $(b)$
.

A natural question is whether Hopf bifurcations can occur for model (1.1) when the number of patches is finite but arbitrary, and in such a case, the connection among patches may also be complex. One can also refer to [Reference Xiao, Zhou and Tang41, Reference Zhu, Yan and Jin45] for detailed discussions on complex connection among patches. In this paper, we aim to answer this question and consider the following patch model:
 \begin{equation} \begin{cases} \displaystyle \frac{d u_{j}}{d t}=d \sum _{k=1}^{n} \alpha _{jk} u_{k}+ u_j f_j \left(u_j, u_{j}(t-\tau )\right), & t\gt 0,\,\, j=1, \cdots, n, \\[10pt] \displaystyle \boldsymbol{u}(t)=\boldsymbol{\psi }(t) \geq \boldsymbol{0}, & t \in [{-}\tau, 0]. \end{cases} \end{equation}
Here
 $\boldsymbol{u}= (u_{1}, \cdots, u_{n} )^{T}$
, where
 $u_j$
stands for the number of individuals in patch
 $j$
,
 $n \ge 2$
is the number of patches,
 $f_j(\cdot,\cdot )$
is the growth rate per capita,
 $d \gt 0$
is the dispersal rate of the population and time delay
 $\tau \ge 0$
represents the maturation time of the population. Moreover,
 $A\,:\!=\,( \alpha _{jk})_{n \times n}$
is the dispersion matrix, where
 $\alpha _{jk}(j \neq k)\ge 0$
denotes the rate of population movement from patch
 $k$
to patch
 $j$
, and
 $\alpha _{jj}\le 0$
denotes the rate of population leaving patch
 $j$
.
We remark that if there is no population loss during the dispersal (
 $-\alpha _{jj}=\sum _{k \neq j} \alpha _{kj}$
for
 $j=1,\ldots,n$
), Hopf bifurcation can occur when the dispersal rate is small, large or near some critical value, see [Reference Chen, Shen and Wei7, Reference Huang, Chen and Zou23]. Therefore, in this paper, we consider model (1.2) when the species has population loss during the dispersal. That is, the following assumption holds:
-
(H0)
 $A\,:\!=\,( \alpha _{jk})_{n \times n}$
is irreducible and essentially nonnegative; and
$-\alpha _{jj}\ge \sum _{k \neq j} \alpha _{kj}$
for all
$ j=1,\cdots,n$
, and
$-\alpha _{j j}\gt \sum _{k \neq j} \alpha _{kj}$
for some
$j$
.


Here, we remark that real matrices with nonnegative off-diagonal elements are referred as essentially nonnegative matrices. Throughout the paper, we also impose the following assumption:
-
(H1) For
$j=1,2,\cdots,n$
,
$f_j(x,y)\in C^4(\mathbb{R}\times \mathbb{R},\mathbb{R})$
,
$f_j(0,0)=m_j\gt 0$
and
$g^{\prime}_j(x)\lt 0$
for
$x\gt 0$
with
$g_j(x)=f_j(x,x)$
.



Here,
 $m_j$
represents the intrinsic growth rate in patch
 $j$
. The smooth condition that
 $f_j(x,y)\in C^4(\mathbb{R}\times \mathbb{R},\mathbb{R})$
is used to determine the direction of the Hopf bifurcation and the stability of the bifurcating periodic solutions, and we do not include this part in the paper for simplicity. We remark that for the case of population loss, we need to modify the arguments in [Reference Chen, Shen and Wei7, Reference Huang, Chen and Zou23] to derive a priori estimates for eigenvalue problem. Moreover, we show the effect of dispersal rate
 $d$
and network topology on the Hopf bifurcation values for the logistic population model.
For simplicity, we give some notations here. For a matrix
 $D$
, we denote the spectral bound of
 $D$
by
 \begin{equation*}s(D)\,:\!=\,\max \{\mathcal {R}e \mu \,:\,\mu \text { is an eigenvalue of } D\}. \end{equation*}
For
 $\mu \in \mathbb{C}$
, we denote the real and imaginary parts by
 $\mathcal{R}e\mu$
and
 $\mathcal{I}m \mu$
, respectively. For a space
 $Z$
, we denote complexification of
 $Z$
to be
 $Z_{\mathbb{C}}\,:\!=\, Z \oplus \textrm{i}Z = \{x_1+\textrm{i}x_2 | x_1, x_2 \in Z\}$
. For a linear operator
 $T$
, we define the domain and the kernel of
 $T$
by
 $\mathscr{D}(T)$
and
 $\mathscr{N}(T)$
, respectively. For
 $\mathbb{C}^n$
, we choose the inner product
 $\langle \boldsymbol{u}, \boldsymbol{v}\rangle =\sum _{j=1}^{n} \overline{u}_{j} v_{j}$
for
 $\boldsymbol{u}, \boldsymbol{v} \in \mathbb{C}^{n}$
and define the norm
 \begin{equation*}\|\boldsymbol{u}\|_{2}=\left(\sum _{j=1}^{n}\left |u_{j}\right |^{2}\right)^{1/ 2}. \end{equation*}
For
 $\boldsymbol{u}=(u_1,\cdots, u_n)^T\in \mathbb R^n$
, we write
 $\boldsymbol{u}\gg \boldsymbol{0}$
if
 $u_j\gt 0$
for all
 $j=1,\cdots,n$
.
The rest of the paper is organised as follows. In Section 2, we give some preliminaries and show that model (1.2) admits a unique positive equilibrium
 $\boldsymbol{u}_d$
for
 $d\in (0,d_*)$
. In Section 3, we show the existence of the Hopf bifurcation when
 $0\lt d\ll 1$
and
 $0\lt d_*-d\ll 1$
, respectively. In Section 4, we apply the obtained theoretical results to a logistic population model, discuss the effect of network topology on Hopf bifurcation values and give some numerical simulations.
2. Some preliminaries
In this section, we cite some results on the properties of the spectrum bound
 $s (dA+\text{diag}(m_j) )$
and the global dynamics of model (1.2) for
 $\tau =0$
. The first one is from [Reference Chen, Shi, Shuai and Wu8].
Lemma 2.1.
Assume that
 $\bf (H0)$
holds, and denote
 $s(d)\,:\!=\,s (dA+\text{diag}(m_j) )$
. Then
 $s(d)$
is strictly decreasing in
 $d\in (0,\infty )$
,
 $\lim _{d\to 0}s(d)=\max _{1\le j\le n}\{m_j\}$
, and
 $\lim _{d\to \infty } s(d)=-\infty$
. Moreover, there exists
 $d_*\gt 0$
such that
 $s(d_*)=0$
,
 $s(d)\gt 0$
for
 $d\in (0,d_*)$
and
 $s(d)\lt 0$
for
 $d\gt d_*$
.
This, combined with [Reference Chen, Shi, Shuai and Wu8, Reference Li and Shuai25, Reference Lu and Takeuchi28, Reference Zhao44], implies that:
Lemma 2.2.
Assume that
 $\bf (H0)$
-
 $\bf (H1)$
hold, and
 $\tau =0$
. Then the trivial equilibrium
 $\boldsymbol{0}= (0,\cdots,0)^T$
of (1.2) is globally asymptotically stable for
 $d\ge d_*$
, and for
 $d\lt d_*$
, system (1.2) admits a unique positive equilibrium
 $\boldsymbol{u}^d=\left(u^d_{1},\cdots, u^d_{n}\right)^T\gg \boldsymbol{0}$
, which is globally asymptotically stable.
It follows directly from the Perron–Frobenius theorem that
 $s (d_*A+\text{diag}(m_j) )({=}0)$
is a simple eigenvalue of
 $d_*A+\text{diag}(m_j)$
with corresponding eigenvector
 $\boldsymbol \eta \gg \boldsymbol{0}$
(or respectively, a simple eigenvalue of
 $d_* A^T+\text{diag}(m_j)$
with corresponding eigenvector
 $\boldsymbol \varsigma \gg \boldsymbol{0}$
), where
 \begin{equation} \begin{split} &\boldsymbol \eta =(\eta _1, \cdots, \eta _n)^T\;\;\text{where}\;\;\eta _j\gt 0\;\;\text{for all}\;\;j=1,2,\cdots,n, \;\;\text{and}\;\; \sum _{j=1}^n{\eta _j}=1,\\ &\boldsymbol \varsigma =(\varsigma _1, \cdots, \varsigma _n)^T,\;\;\text{where}\;\;\varsigma _j\gt 0 \;\;\text{for all}\;\;j=1,2,\cdots,n, \;\;\text{and}\;\; \sum _{j=1}^n{\varsigma _j}=1. \end{split} \end{equation}
Then, we have the following decomposition:
 \begin{equation} \mathbb{R}^{n}=\textrm{span}\{{\boldsymbol \eta }\} \oplus{X}_{1}=\textrm{span}\{\boldsymbol \varsigma \} \oplus \widetilde{X}_{1}, \end{equation}
where
 \begin{equation} \begin{split}{X}_{1}&\,:\!=\,\left \{\boldsymbol{x}\in \mathbb R^n\,:\, \langle \boldsymbol \varsigma,\boldsymbol{x}\rangle =0\right \} =\left \{\left [d_*A+\text{diag}(m_j)\right ]\boldsymbol{y}\,:\,\boldsymbol{y}\in \mathbb R^n\right \},\\[3pt]\widetilde{X}_{1}&\,:\!=\,\left \{\boldsymbol{x}\in \mathbb R^n\,:\, \langle \boldsymbol \eta,\boldsymbol{x}\rangle =0\right \}=\left \{\left [d_*A^T+\text{diag}(m_j)\right ]\boldsymbol{y}\,:\, \boldsymbol{y}\in \mathbb R^n\right \}. \end{split} \end{equation}
To show the existence of Hopf bifurcation, we describe the profile of the unique positive equilibrium
 $\boldsymbol{u}^d$
as
 $d\to 0$
or
 $d\to d_*$
. Clearly,
 $\boldsymbol{u}^d=(u^d_{1},\cdots,u^d_{n})^T$
satisfies
 \begin{equation} \displaystyle d\sum _{k=1}^{n} \alpha _{jk} u_{k}+ u_j f_j\left( u_{j}, u_{j}\right)=0,\;\; j=1, \cdots, n. \end{equation}
Lemma 2.3.
Assume that
 $\bf (H0)$
-
 $\bf (H1)$
hold. Let
 $\boldsymbol{u}^d$
be the unique positive equilibrium of (1.2) obtained in Lemma 2.2 for
 $d\in (0,d_*)$
, and denote
 \begin{equation} \tilde a\,:\!=\,\sum _{j=1}^{n}a_j \eta _j^2 \varsigma _j,\;\;\tilde b\,:\!=\,\sum _{j=1}^{n}b_j \eta _j^2 \varsigma _j, \end{equation}
where
 $\boldsymbol \eta =(\eta _1, \cdots, \eta _n)^T$
and
 $\boldsymbol \varsigma =(\varsigma _1, \cdots, \varsigma _n)^T$
are defined in (2.1), and
 \begin{equation} a_j\,:\!=\,\frac{\partial f_j(0,0)}{\partial x},\;\; b_j\,:\!=\,\frac{\partial f_j(0,0)}{\partial y}\;\;\textit{for}\;\; j=1,2,\cdots,n. \end{equation}
Then the following statements hold.
-
(i) Let
$\boldsymbol{u}^d=\left(u_1^{0}, \cdots, u_n^{0}\right)^T$
for
$d=0$
, where
$u_j^{0}$
is the unique positive solution of
$f_j(x,x)=0$
for
$j=1,\cdots,n$
. Then
$\boldsymbol{u}^d$
is continuously differentiable for
$d\in [0,d_*)$
. -
(ii) There exists a continuously differentiable mapping
$d \mapsto \left(\beta ^{d}, \boldsymbol{\xi }^{d} \right)$
from
$ (0,d_{*} ]$
to
$\mathbb{R}^{+} \times X_{1}$
such that, for any
$d \in (0,d_{*} )$
, the unique positive equilibrium of (1.2) can be represented as the following form:
(2.7)Moreover,
\begin{equation} \boldsymbol{u}^d=\beta ^{d}\!\left(d_{*}-d\right)\left [\boldsymbol{\eta }+\left(d_{*}-d\right) \boldsymbol{\xi }^{d}\right ]. \end{equation}
(2.8)and
\begin{equation} \beta ^{d_{*}}=\frac{\sum _{j=1}^{n} m_j \eta _{j} \varsigma _j}{-d_{*} \!\left(\tilde a+\tilde b\right)}\gt 0, \end{equation}
$\boldsymbol{\xi }^{d_{*}}= \left(\xi ^{d_{*}}_1, \cdots, \xi ^{d_{*}}_n \right)^{T} \in X_1$
is the unique solution of the following equation:
(2.9)
\begin{equation} d_*\!\left(d_*\sum _{k=1}^{n} \alpha _{jk} \xi _{k}+ m_j \xi _{j}\right)+{\eta }_{j}\!\left [m_j+ d_{*} \beta ^{d_{*}}\left(a_j+b_j\right){\eta }_{j} \right ]=0, \;\; j=1, \cdots, n. \end{equation}


Proof. We first prove
 $(i)$
. It follows from assumption
 $\bf (H1)$
that
 $f_j(x,x)=0$
admits a unique positive solution, denoted by
 $u_j^{0}$
. Define
 \begin{equation*} \begin{split} &\boldsymbol{G}(d,\boldsymbol{u})= \left(\begin{array}{c} d\sum _{k=1}^n\alpha _{1k}u_k+u_1 f_1(u_1,u_1) \\[4pt] d\sum _{k=1}^n\alpha _{2k}u_k+u_2 f_2(u_2,u_2) \\[4pt] \vdots \\[4pt] d\sum _{k=1}^n\alpha _{nk}u_k+u_n f_n(u_n,u_n) \\ \end{array}\right). \end{split} \end{equation*}
Clearly,
 $\boldsymbol{G}\!\left(0,\boldsymbol{u}^0\right)=\boldsymbol{0}$
and
 $D_{\boldsymbol{u}} \boldsymbol{G}\!\left(0,\boldsymbol{u}^{0}\right)=\textrm{diag} \!\left(u_j^0 \left(a_j^0+b_j^0\right) \right)$
, where
 $D_{\boldsymbol{u}} \boldsymbol{G}\!\left(0,\boldsymbol{u}^{0}\right)$
is the Fréchet derivative of
 $\boldsymbol{G}(d,\boldsymbol{u})$
with respect to
 $\boldsymbol{u}$
at
 $\left(0,\boldsymbol{u}^{0}\right)$
, and
 \begin{equation} a_{j}^{0}=\left .\frac{\partial f_j}{\partial x}\right |_{\left( u_{j}^0,u_{j}^0\right)},\;\; b_{j}^{0}=\left .\frac{\partial f_j}{\partial y}\right |_{\left( u_{j}^0,u_{j}^0\right)},\;\;j=1,\cdots,n. \end{equation}
By assumption
 $\bf (H1)$
, we see that
 \begin{equation} a_j^0+b_j^0 \lt 0 \;\;\text{for all}\;\;j=1, \cdots, n, \end{equation}
which implies that
 $D_{\boldsymbol{u}} \boldsymbol{G}\!\left(0,\boldsymbol{u}^{0}\right)$
is invertible. It follows from the implicit function theorem that there exist
 $ d_1\gt 0$
and a continuously differentiable mapping
 \begin{equation*}d\in [0, d_1]\mapsto {{\boldsymbol{u}}}(d)=({u}_1(d),\cdots,{u}_n(d))^T\gg \boldsymbol {0}\end{equation*}
such that
 $\boldsymbol{G}(d,{{\boldsymbol{u}}}(d))=\boldsymbol{0}$
and
 ${{\boldsymbol{u}}}(0)=\boldsymbol{u}^0$
. Therefore,
 $\boldsymbol{u}^d=\boldsymbol{u}(d)$
, and
 $\boldsymbol{u}^d$
is continuously differentiable for
 $d\in [0,d_1]$
. Note that
 $G(d,\boldsymbol{u}^d)=\boldsymbol{0}$
for
 $d\in (0,d_*)$
, and
 $\boldsymbol{u}^d$
is stable. Then, by the implicit function theorem, we obtain that
 $\boldsymbol{u}^d$
is continuously differentiable for
 $d\in (0,d_*)$
. Here, we omit the proof for simplicity.
Now, we prove
 $(ii)$
. It follows from (2.2) that
 $\boldsymbol{u}^d$
can be represented as (2.7). Since
 $\boldsymbol{u}^d$
is continuously differentiable for
 $d\in (0,d_*)$
, we see that
 $\beta ^d$
and
 $\boldsymbol{\xi }^{d}$
are also continuously differentiable for
 $d\in (0, d_*)$
. Then, we will show that
 $\beta ^d$
and
 $\boldsymbol{\xi }^{d}$
are continuously differentiable for
 $d=d_*$
.
It follows from (2.11) that
 \begin{equation} \tilde a+\tilde b \lt 0, \end{equation}
which implies that
 $\beta ^{d_*}$
is positive. Since
 \begin{equation*}\sum _{j=1}^n m_j {\eta }_{j} \varsigma _j+ d_{*}\beta ^{d_{*}} \left(\tilde a+\tilde b\right) =0,\end{equation*}
we see that
 \begin{equation*}\left({\eta }_{1}\left [m_1+ d_{*} \beta ^{d_{*}}(a_1+b_1) {\eta }_{1} \right ],\cdots,{\eta }_{n}\left [m_n+ d_{*} \beta ^{d_{*}}(a_n+b_n) {\eta }_{n} \right ]\right)^T\in X_1,\end{equation*}
and consequently
 $\boldsymbol{\xi }^{d_{*}}\in X_1$
is uniquely defined.
Multiplying (2.4) by
 $d_*$
, we have
 \begin{equation} \displaystyle d\left [d_*\sum _{k=1}^{n} \alpha _{jk} u_{k}+m_ju_j\right ]+(d_*-d)u_jm_j+ d_*u_j \left [f_j\left( u_{j}, u_{j}\right)-m_j\right ]=0,\;\; j=1, \cdots, n. \end{equation}
Substituting
 \begin{equation*}\boldsymbol{u}=\beta (d_*-d)\left [{\boldsymbol \eta }+(d_*-d){\boldsymbol \xi }\right ]\end{equation*}
into (2.13), where
 $\boldsymbol \eta$
is defined in (2.1) and
 $\boldsymbol \xi =(\xi _1,\cdots, \xi _n)^T\in X_1$
, we see that
 $(\beta,\boldsymbol \xi )$
satisfies, for all
 $j=1,\cdots,n$
,
 \begin{align*} p_j(d,\beta,\boldsymbol \xi ) \,:\!=\,d \left(d_{*}\sum _{k=1}^n \alpha _{jk}\xi _k+ m_j \xi _j\right) +[\eta _j+(d_{*}-d)\xi _j]\left(m_j+d_{*} q_j(d,\beta,\boldsymbol \xi )\right)=0, \end{align*}
where
 \begin{equation} q_{j}(d,\beta,\boldsymbol \xi )=\begin{cases} \begin{array}{l@{\quad}l} \displaystyle \frac{f_j \left(u_j, u_j\right)-m_j}{d_{*}-d}, & d \neq d_{*} \\[10pt] \displaystyle \beta \left(a_j+b_j\right) \eta _j, & d=d_{*} \end{array} \end{cases} \end{equation}
with
 $u_j=\beta (d_*-d) [\eta _j+(d_*-d){\xi _j} ]$
. Define
 $\boldsymbol{p}(d, \beta,\boldsymbol \xi )\,:\,\mathbb R\times \mathbb R\times X_1\mapsto \mathbb R^n$
by
 \begin{equation*} \boldsymbol{p}(d, \beta,\boldsymbol \xi )=\left(p_1(d,\beta,\boldsymbol \xi ),\cdots,p_n(d,\beta,\boldsymbol \xi )\right)^T. \end{equation*}
Then
 $(d,\boldsymbol{u})$
solves (2.4) if and only if
 $\boldsymbol{p}(d,\beta,\boldsymbol \xi )=\boldsymbol{0}$
for
 $(\beta,\boldsymbol \xi )\in \mathbb R\times X_1$
. Clearly,
 $\boldsymbol{p}\left(d_*,\beta ^{d_*},{\boldsymbol \xi }^{d_*}\right)=\boldsymbol{0}$
, and the Fréchet derivative of
 $\boldsymbol{p}$
with respect to
 $(\beta,\boldsymbol \xi )$
at
 $\left(d_*,\beta ^{d_*},{\boldsymbol \xi }^{d_*}\right)$
is
 \begin{equation*} D_{(\beta,\boldsymbol \xi )}\boldsymbol{p}\left(d_*,\beta ^{d_*},{\boldsymbol \xi }^{d_*}\right)[\epsilon,\boldsymbol{v}]=d_*\left(\begin {array}{c} d_*\sum _{k=1}^n\alpha _{1k}v_k+m_1v_1+ (a_1+b_1) \eta _1^2\epsilon \\[5pt] d_*\sum _{k=1}^n\alpha _{2k}v_k+m_2v_2+ (a_2+b_2) \eta _2^2\epsilon \\ \vdots \\ d_*\sum _{k=1}^n\alpha _{nk}v_k+m_nv_n+ (a_n+b_n) \eta _n^2\epsilon \\ \end {array}\right), \end{equation*}
where
 $\epsilon \in \mathbb R$
and
 $\boldsymbol{v} =(v_1,\cdots,v_n)^T\in X_1$
. Since
 $\tilde a+\tilde b\lt 0$
from (2.12), we see that
 $D_{(\beta,\boldsymbol \xi )}\boldsymbol{p}\left(d_*,\beta ^{d_*},{\boldsymbol \xi }^{d_*}\right)$
is bijective from
 $\mathbb R\times X_1$
to
 $\mathbb R^n$
. It follows from the implicit function theorem that there exist
 $d_1\lt d_*$
and a continuously differentiable mapping
 $d\in [d_1,d_*]\mapsto \left(\tilde \beta ^d,\tilde{\boldsymbol \xi }^d\right)\in{\mathbb R}\times X_1$
such that
 ${\boldsymbol{p}}\left(d,\tilde \beta ^d,\tilde{\boldsymbol \xi }^d\right)=\boldsymbol{0}$
, and
 $\tilde \beta ^d=\beta ^{d_*}$
and
 $\tilde{\boldsymbol \xi }^{d}={\boldsymbol \xi }^{d_*}$
for
 $d=d_*$
. The uniqueness of the positive equilibrium of (1.2) implies that
 $\beta ^d=\tilde \beta ^d$
and
 $\boldsymbol{\xi }^{d}=\tilde{\boldsymbol \xi }^d$
for
 $d\in [d_1,d_*)$
. Therefore,
 $\beta ^d$
and
 $\boldsymbol{\xi }^{d}$
are continuously differentiable for
 $d\in (0, d_*]$
.
3. Stability and Hopf bifurcation
In this section, we consider the stability of the unique positive equilibrium
 $\boldsymbol{u}^d$
and show the existence/nonexistence of a Hopf bifurcation for model (1.2). Linearizing (1.2) at
 $\boldsymbol{u}^d$
, we have
 \begin{equation} \displaystyle \frac{d \boldsymbol{v}}{d t} =dA\boldsymbol{v}+\textrm{diag}\!\left(f_j\left(u_j^d,u_j^d\right)\right)\boldsymbol{v}+\textrm{diag}\!\left(u_j^d a_j^d\right)\boldsymbol{v}+ \textrm{diag}\!\left(u_j^d b_j^d\right)\boldsymbol{v}(t-\tau ), \end{equation}
where
 \begin{equation} a_{j}^{d}=\left .\frac{\partial f_j}{\partial x}\right |_{\left( u_{j}^d,u_{j}^d\right)},\;\; b_{j}^{d}=\left .\frac{\partial f_j}{\partial y}\right |_{\left( u_{j}^d,u_{j}^d\right)}. \end{equation}
It follows from [Reference Wu40] that the solution semigroup of (3.1) has the infinitesimal generator
 $A_{\tau } (d)$
satisfying
 \begin{equation*}A_{\tau }(d) \boldsymbol {\Psi }=\dot {\boldsymbol {\Psi }}, \end{equation*}
and the domain of
 $A_{\tau }(d)$
is

where
 $C_{\mathbb C}=C([{-}{\tau },0],\mathbb{C}^n)$
and
 $C^1_{\mathbb{C}}=C^1([{-}{\tau },0],\mathbb{C}^n)$
. Then, we see that
 $\mu \in \mathbb{C}$
is an eigenvalue of
 $A_{\tau }(d)$
, if and only if there exists
 $\boldsymbol{\varphi }=(\varphi _1,\cdots,\varphi _n)^T({\ne} \boldsymbol{0})\in \mathbb{C}^n$
such that
 \begin{equation} \begin{split} \Delta (d, \mu, \tau )\boldsymbol{\varphi }\,:\!=\,&dA\boldsymbol{\varphi }+ \textrm{diag} \!\left(f_j \left(u^d_{j},u^d_{j}\right)\right)\boldsymbol{\varphi } + \textrm{diag}\!\left(u^d_{j} a_{j}^{d}\right)\boldsymbol{\varphi }\\ &+ e^{-\mu \tau }\textrm{diag}\!\left(u^d_{j} b_{j}^{d}\right)\boldsymbol{\varphi } - \mu \boldsymbol{\varphi }=\boldsymbol{0}. \end{split} \end{equation}
Here, the dispersion matrix
 $A$
may be asymmetric, and the environment can also be spatially heterogeneous. Therefore, one cannot obtain the explicit expression of
 $\boldsymbol{u}^d$
. By Lemma 2.3, we obtain the asymptotic profile of
 $\boldsymbol{u}^{d}$
as
 $d\to 0$
or
 $d\to d_*$
. Then, the following discussion is divided into two cases: (I)
 $0\lt d_*-d\ll 1$
and (II)
 $0\lt d\ll 1$
.
3.1. The case of
$0\lt \boldsymbol{d}_*-\boldsymbol{d} \ll 1$

In this section, we will consider the existence of a Hopf bifurcation for (1.2) with
 $0\lt d_*-d \ll 1$
. First, we obtain a priori estimates for solutions of (3.3).
Lemma 3.1.
Assume that
 $ (\mu _{d}, \tau _{d}, \boldsymbol{\psi }_d )$
solves (3.3) for
 $d \in (0,d_*)$
, where
 $\mathcal{R}e \mu _{d}, \tau _{d} \ge 0$
, and
 $\boldsymbol{\psi }_d=(\psi _{d,1},\cdots,\psi _{d,n})^T({\ne} \boldsymbol{0}) \in \mathbb{C}^n$
. Then there exists
 $d_1\in (0,d_*)$
such that
 $\left |\displaystyle \frac{\mu _d}{d_*-d}\right |$
is bounded for
 $d\in [d_1,d_*)$
. Moreover, ignoring a scalar factor,
 $\boldsymbol \psi _{{d}}$
can be represented as follows:
 \begin{equation} \begin{cases} \boldsymbol \psi _{{d}}=r_{{d}} \boldsymbol \eta + \boldsymbol{w}_{{d}}, \;\boldsymbol{w}_{{d}} \in \left(X_{1}\right)_{\mathbb{C}}, \; r_{{d}} \geq 0, \\[9pt] \|\boldsymbol{\psi }_d\|_2^2=\|\boldsymbol \eta \|_2^2, \end{cases} \end{equation}
where
 $\boldsymbol \eta$
is defined in (2.1), and
 $r_{{d}}$
,
 $\boldsymbol{w}_{{d}}$
and
 $\boldsymbol \psi _{{d}}$
satisfy
 \begin{equation*}\lim _{d \rightarrow d_*}r_{d}=1,\;\;\lim _{d \rightarrow d_*} \boldsymbol{w}_{d}=\boldsymbol {0},\;\;\lim _{d \rightarrow d_*}\boldsymbol \psi _{{d}}=\boldsymbol \eta. \end{equation*}
Proof. We first show that
 $|\mu _d|$
is bounded for
 $d\in (0,d_*)$
. Substituting
 $ (\mu _{d}, \tau _{d}, \boldsymbol{\psi }_d )$
into (3.3), we have
 \begin{equation} \displaystyle d\sum _{k=1}^n \alpha _{jk}\psi _{d,k}+f_j \left(u^d_{j},u^d_{j}\right)\psi _{d,j}+u^d_{j}a_{j}^{d} \psi _{d,j}+u^d_{j} b_{j}^{d}\psi _{d,j}e^{-\mu _d\tau _d} -\mu _d\psi _{d,j}=0,\;\;j=1,\cdots,n. \end{equation}
Multiplying (3.5) by
 $\overline \psi _{d,j}$
and summing the result over all
 $j$
yield

Since
 $\|\boldsymbol{\psi }_d\|_2^2=\|\boldsymbol \eta \|_2^2$
, we see that, for
 $d\in (0,d_*)$
,
 \begin{align*} |\mu _d|\le & \max _{d\in [0,d_*],1\le j\le n}|f_j\left(u^d_{j},u^d_{j}\right)|+ \max _{d\in [0,d_*],1\le j\le n}|u^d_{j}a_j^{d}| + \max _{d\in [0,d_*],1\le j\le n}|u^d_{j}b_j^{d}|+n d_*\max _{1\le j,k\le n} |\alpha _{jk}|, \end{align*}
which implies that
 $|\mu _d|$
is bounded for
 $d\in (0,d_*)$
.
Clearly, ignoring a scalar factor,
 $\boldsymbol \psi _{{d}}$
can be represented as (3.4). Note from (3.4) that
 $\|\boldsymbol{\psi }_d\|_2^2=\|\boldsymbol \eta \|_2^2$
. Then, up to a subsequence, we can assume that
 \begin{equation} \lim _{d\to d_*}\mu _{d}=\gamma,\;\;\lim _{d\to d_*}\boldsymbol{\psi }_{d}=\lim _{d\to d_*}\left(r_{d}\boldsymbol \eta + \boldsymbol{w}_{d}\right)=\boldsymbol \psi ^* \end{equation}
with
 $\mathcal{R}e \gamma \ge 0$
and
 $\|\boldsymbol{\psi }^*\|_2^2=\|\boldsymbol \eta \|_2^2$
. This, combined with (3.3), implies that
 \begin{equation*}(d_*A+\text {diag}(m_j))\boldsymbol {\psi }^*-\gamma \boldsymbol {\psi }^*=\boldsymbol {0}, \end{equation*}
and consequently,
 $\gamma$
is an eigenvalue of
 $d_*A+\text{diag}(m_j)$
. Then, by [Reference Smith35, Corollary 4.3.2], we have
 $\gamma =s(d_*A+\text{diag}(m_j))=0$
. This, combined with (3.4) and (3.6), implies that
 $\boldsymbol{\psi }^*=\boldsymbol \eta$
, and consequently,
 \begin{equation} \lim _{d\to d_*}r_{d}=1,\;\;\lim _{d\to d_* } \boldsymbol{w}_{d}=\boldsymbol{0}. \end{equation}
Then multiplying (3.5) by
 $d_*$
, we have
 \begin{align} 0 & = d\left [d_*\displaystyle \sum _{k=1}^n \alpha _{jk}\psi _{d,k}+m_j\psi _{d,j}\right ]+(d_*-d)m_j\psi _{d,j}+d_*\left [f_j \left(u^d_{j},u^d_{j}\right)-m_j\right ]\psi _{d,j}\nonumber\\ &\quad +d_*u^d_{j}a_{j}^{d} \psi _{d,j}+d_*u^d_{j} b_{j}^{d}\psi _{d,j}e^{-\mu _d\tau _d} -d_*\mu _d\psi _{d,j},\;\;\;\;\;\;\;j=1,\cdots,n. \end{align}
Plugging (2.7) and (3.4) into (3.8), we have, for
 $j=1,\cdots,n$
,
 \begin{align} &0=\displaystyle d\left(d_*\sum _{k=1}^n \alpha _{jk}w_{{d},k}+ m_j w_{{d},j} \right)+(d_*-d) \left [m_j+d_* q_j\left(d,\beta ^d,\boldsymbol \xi ^d\right)\right ]\left(r_{d} \eta _j+w_{{d},j}\right)\nonumber\\ &\quad \,\,\,\,-d_* \mu _{d}\left(r_{d} \eta _j+ w_{{d},j}\right)+d_*(d_*-d) \beta ^{d}\left(a_j^{d}+b_j^{d}e^{-\mu _{d} \tau _{d}}\right)\left [\eta _j+(d_*-d)\xi ^{d}_j\right ]\left(r_{d} \eta _j+w_{{d},j}\right), \end{align}
where
 $q_j(d,\beta,\boldsymbol \xi )$
is defined in (2.14). Note that
 $\boldsymbol \varsigma$
is the eigenvector of
 $d_*A^T+\text{diag}(m_j)$
with respect to eigenvalue
 $0$
. This, combined with (2.3), implies that
 \begin{equation*}\sum _{j=1}^n\left(d_*\sum _{k=1}^n \alpha _{jk}w_{{d},k}+ m_j w_{{d},j} \right)\varsigma _{j}=0,\;\;\sum _{j=1}^n w_{{d},j}\varsigma _{j}=0.\end{equation*}
Then multiplying (3.9) by
 $\varsigma _{j}$
and summing the result over all
 $j$
yield

This, combined with (3.7), implies that there exists
 $d_1\in (0,d_*)$
such that
 $\left |\displaystyle \frac{\mu _d}{d_*-d}\right |$
is bounded for
 $d\in [d_1,d_*)$
.
By Lemma 3.1, we have the following result.
Theorem 3.2.
Assume that
 $\bf (H0)$
-
 $\bf (H1)$
hold, and
 $\tilde a-\tilde b\lt 0$
, where
 $\tilde a$
and
 $\tilde b$
are defined in (2.5). Then there exists
 $d_2\in [d_1,d_*)$
, such that
 \begin{equation*}\sigma \left(A_{\tau }(d)\right) \subset \{x+ \textit{i} y\,:\, x, y \in \mathbb {R}, x\lt 0\}\;\;\textit{for}\;\;d\in [d_2,d_*)\;\;\textit{and}\;\;\tau \ge 0.\end{equation*}
Proof. If the conclusion is not true, then there exists a positive sequence
 $ \{d_{l} \}_{l=1}^{\infty }$
such that
 $\lim _{l \rightarrow \infty } d_{l}=d_*,$
and, for
 $l \geq 1$
,
 $\Delta (d_{l}, \mu, \tau )\boldsymbol \psi =0$
is solvable for some value of
 $ (\mu _{{d_l}}, \tau _{{d_l}},\boldsymbol \psi _{{d_l}} )$
with
 $\mathcal{R} e \mu _{{d_l}}, \mathcal{I} m \mu _{{d_l}} \geq 0, \tau _{{d_l}} \geq 0$
and
 $\boldsymbol{0} \neq \boldsymbol \psi _{{d_l}} \in{\mathbb{C}}^n$
. Note from the proof of Lemma 3.1 that
 $\left \{\left |\frac{\mu _{d_l}}{d_*-d_l}\right |\right \}_{l=1}^\infty$
and
 $ \{ | \mu _{d_l} | \}_{l=1}^\infty$
are bounded. Then, we see that there exists a subsequence
 $ \{d_{l_{k}} \}_{k=1}^{\infty }$
(we still use
 $\{{d}_l\}_{l=1}^{\infty }$
for convenience) such that
 \begin{equation} \lim _{l\to \infty }\frac{\mu _{d_l}}{d_*-d}=\mu ^*,\;\;\lim _{l\to \infty }\left(e^{{-\tau _{d_l}}(\mathcal{R} e \mu _{{d_l}})}, e^{{-\textrm{i}\tau _{d_l}}\left(\mathcal{I} m \mu _{{d_l}}\right)}\right)=\left(\sigma ^*,e^{-\textrm{i}\theta ^*}\right), \end{equation}
where
 \begin{equation*} \sigma ^*\in [0,1],\;\;\theta ^*\in [0,2\pi ),\;\;\mu ^* \in \mathbb {C}\left(\mathcal {R} e \mu ^{*},\mathcal {I} m \mu ^{*} \geq 0\right). \end{equation*}
It follows from Lemma 3.1 that
 $\lim _{l \rightarrow \infty }r_{d_l}=1$
,
 $\lim _{l \rightarrow \infty }\boldsymbol{w}_{d_l}=\boldsymbol{0}$
. By (2.7) and (3.2), we have
 $a_j^d=a_j$
and
 $b_j^d=b_j$
for
 $d=d_*$
, where
 $a_j$
and
 $b_j$
are defined in (2.6). Then, substituting
 $d=d_l$
,
 $\mu _d=\mu _{d_l}$
,
 $r_d=r_{d_l}$
and
 $\boldsymbol{w}_{d}=\boldsymbol{w}_{d_l}$
into (3.10) and taking
 $l\to \infty$
, we see from (2.14) and (3.11) that
 \begin{equation} \begin{split} \displaystyle \mu ^*= \frac{\sum _{j=1}^n\eta _j\varsigma _j\big \{[m_j+d_* \beta ^{d_*}\eta _j \left(a_j+b_j\right)]+d_* \beta ^{d_*}\eta _j\left(a_j +b_j \sigma ^* e^{-\textrm{i} \theta ^*}\right)\big \} }{d_*\sum _{j=1}^n \eta _j \varsigma _j}. \end{split} \end{equation}
By (2.8), we have
 \begin{equation*}\sum _{j=1}^n\eta _j\varsigma _j\big \{\left[m_j+d_* \beta ^{d_*}\eta _j \left(a_j+b_j\right)\right]=0.\end{equation*}
This, combined with (2.5) and (3.12), yields
 \begin{equation} \begin{cases} \displaystyle \beta ^{d_*}\left(\tilde a+\sigma ^* \tilde b \cos \theta ^* \right)=\mathcal{R} e \mu ^{*}\sum _{j=1}^n\eta _j\varsigma _j\ge 0,\\ \mathcal{I}m \mu ^{*}\sum _{j=1}^n\eta _j\varsigma _j+ \beta ^{d_*}\sigma ^* \tilde b \sin \theta ^* =0. \end{cases} \end{equation}
It follows from
 $\bf (H1)$
(see also (2.12)) that
 $\tilde a+\tilde b\lt 0$
. Then if
 $\tilde a-\tilde b\lt 0$
, we have
 \begin{equation*} \tilde a\lt \min \left \{\tilde b,-\tilde b\right \} \leq 0 \text { and }-1\lt -\frac {\tilde b}{\tilde a}\lt 1. \end{equation*}
This, combined with the first equation of (3.13), yields
 \begin{equation*} -\frac {\tilde b}{\tilde a} \sigma ^{*}\cos \theta ^{*} \geq 1,\end{equation*}
which is a contradiction. This completes the proof.
From Theorem 3.2, we see that if
 $\tilde a -\tilde b\lt 0$
, then the positive equilibrium
 $\boldsymbol{u}^d$
is locally asymptotically stable for
 $0\lt d_*-d\ll 1$
, and Hopf bifurcations cannot occur. Next, we show the existence of a Hopf bifurcation for
 $\tilde a -\tilde b\gt 0$
. Clearly,
 $A_\tau (d)$
has a purely imaginary eigenvalue
 $\mu = \textrm{i} \nu (\nu \gt 0)$
for some
 $\tau \ge 0$
, if and only if
 \begin{equation} \begin{split} \boldsymbol H(d,\nu,\theta, \boldsymbol{\varphi })\,:\!=\,&dA\boldsymbol{\varphi }+\textrm{diag}\!\left(f_j\left(u_j^d,u_j^d\right)\right)\boldsymbol{\varphi }+\textrm{diag}\!\left(u_j^d a_{j}^{d}\right)\boldsymbol{\varphi }\\ &+e^{-\textrm{i}\theta }\textrm{diag}\!\left(u_j^d b_{j}^{d}\right)\boldsymbol{ \varphi }-\textrm{i}\nu \boldsymbol{\varphi }=\boldsymbol{0} \end{split} \end{equation}
is solvable for some value of
 $ \nu \gt 0, \theta \in [0, 2\pi )$
and
 $\boldsymbol{\varphi } ({\ne} \boldsymbol{0})\in \mathbb{C}^n$
. Ignoring a scalar factor,
 $\boldsymbol \psi ({\ne} \boldsymbol{0})\in \mathbb{C}^n$
in (3.14) can be represented as follows:
 \begin{equation} \begin{split} &\boldsymbol \psi =r \boldsymbol \eta + \boldsymbol{w}, \;\; \boldsymbol{w} \in \left(X_{1}\right)_{\mathbb{C}}, \;\; r \geq 0, \\ &\|\boldsymbol \psi \|_2^{2}=r^2\|\boldsymbol \eta \|_2^2+r \sum _{j=1}^n\eta _j\left(w_j+\overline w_j\right)+ \|\boldsymbol{w}\|_2^2=\|\boldsymbol \eta \|_2^2. \end{split} \end{equation}
Then, we obtain an equivalent problem of (3.14) as follows.
Lemma 3.3.
Assume that
 $d\in (0,d_*)$
. Then
 $(\nu,\theta,\boldsymbol \psi )$
is a solution of (3.14), where
 $\nu =(d_*-d)h\gt 0$
,
 $\theta \in [0,2\pi )$
and
 $\boldsymbol \psi$
satisfies (3.15), if and only if
 $(\boldsymbol{w},r, h,\theta )$
solves the following system:
 \begin{equation} \begin{cases} \boldsymbol F(\boldsymbol{w},r, h,\theta, d)=(F_{1,1}, \cdots, F_{1,n},F_2,F_3)^T=\boldsymbol 0,\\[4pt] \boldsymbol{w} \in (X_1)_{\mathbb C},\;r\ge 0,\;h \gt 0, \;\theta \in [0,2 \pi ). \end{cases} \end{equation}
Here,
 $\boldsymbol F(\boldsymbol{w},r, h,\theta, d)\,:\,(X_1)_{\mathbb C}\times \mathbb{R}^4 \mapsto (X_1)_{\mathbb C}\times \mathbb{C}\times \mathbb{R}$
is continuously differentiable, and
 \begin{equation} \begin{cases} \begin{aligned} &\displaystyle F_{1,j}(\boldsymbol{w},r, h,\theta, d)\,:\!=\, d \left(d_*\sum _{k=1}^n \alpha _{jk}w_{k}+ m_j w_{j}\right)-(d_*-d)F_2(\boldsymbol{w},r,h,\theta, d)\\[4pt] &\,\,\,\,\,\,\,\,\,\,\,\,\,\,\,\,\,\,\,\,\,\,\,+(d_*-d)\left [m_j+d_*q_j\left(d,\beta ^d,\boldsymbol \xi ^d\right)-\textit{i}d_*h\right ]\left(r \eta _j+ w_{j}\right)\\[4pt] &\,\,\,\,\,\,\,\,\,\,\,\,\,\,\,\,\,\,\,\,\,\,\,+d_* (d_*-d)\beta ^{d}\left [\eta _j+(d_*-d)\xi ^d_j\right ]\left(a_j^{d}+b_j^{d}e^{-\textit{i}\theta }\right)\left(r \eta _j+ w_{j}\right),\\ &\displaystyle F_2(\boldsymbol{w},r,h,\theta, d)\,:\!=\,\sum _{j=1}^n\varsigma _j\left [m_j+d_*q_j\left(d,\beta ^d,\boldsymbol \xi ^d\right)-\textit{i}d_*h\right ]\left(r \eta _j+ w_{j}\right)\\ &\,\,\,\,\,\,\,\,\,\,\,\,\,\,\,\,\,\,\,\,\,\,\,+\sum _{j=1}^n\varsigma _jd_*\beta ^{d}[\eta _j+(d_*-d)\xi ^{d}_j]\left(a_j^{d}+b_j^{d}e^{-\textit{i}\theta }\right)\left(r \eta _j+ w_{j}\right),\\ &\displaystyle F_3(\boldsymbol{w},r,h,\theta, d)\,:\!=\,(r^2-1)\|\boldsymbol \eta \|_2^2+r \sum _{j=1}^n\eta _j\left(w_j+\overline w_j\right)+ \|\boldsymbol{w}\|_2^2, \end{aligned} \end{cases} \end{equation}
where
 $q_j(d,\beta,\boldsymbol \xi )$
and
 $a_j^{d}$
,
 $b_j^{d}$
are defined in (2.14) and (3.2), respectively.
Proof. Multiplying (3.14) by
 $d_*$
, we have
 \begin{align} 0 & = d\left [d_*\displaystyle \sum _{k=1}^n \alpha _{jk}\varphi _{k}+m_j\varphi _{j}\right ]+(d_*-d)m_j\varphi _{j}+d_*\left [f_j \left(u^d_{j},u^d_{j}\right)-m_j\right ]\varphi _{j}\nonumber\\[4pt] & \quad +d_*u^d_{j}a_{j}^{d} \varphi _{j}+d_*u^d_{j} b_{j}^{d}\varphi _{j}e^{-\textrm{i}\theta } -\textrm{i}d_*\nu \varphi _{j},\;\;\;\;\;\;\;j=1,\cdots,n. \end{align}
Then plugging (2.7), the first equation of (3.15), and
 $\nu =(d_*-d)h$
into (3.18), we have
 $\boldsymbol{y}=(y_1,\cdots,y_n)^T=\boldsymbol{0}$
, where
 \begin{align} y_j s & \,:\!=\,\displaystyle d \left(d_*\sum _{k=1}^n \alpha _{jk}w_{k}+ m_j w_{j}\right)\nonumber\\[3pt] & \quad +(d_*-d)\left [m_j+d_*q_j\left(d,\beta ^d,\boldsymbol \xi ^d\right)-\textrm{i}d_*h\right ]\left(r \eta _j+ w_{j}\right)\nonumber\\[3pt] & \quad +d_* (d_*-d)\beta ^{d}\left [\eta _j+(d_*-d)\xi ^d_j\right ]\left(a_j^{d}+b_j^{d}e^{-\textrm{i}\theta }\right)\left(r \eta _j+ w_{j}\right). \end{align}
Since
 \begin{equation*}\mathbb C^n=\textrm{span}\{{\boldsymbol \rho }\} \oplus \left({X}_{1}\right)_{\mathbb C}\;\;\text {with}\;\;\boldsymbol \rho =(1,\cdots,1)^T,\end{equation*}
we see that
 \begin{equation*} \boldsymbol{y}=(d_*-d)F_2(\boldsymbol{w},r,h,\theta, d)\boldsymbol \rho +\left(F_{1,1}(\boldsymbol{w},r, h,\theta, d),\cdots,F_{1,n}(\boldsymbol{w},r, h,\theta, d)\right)^T.\end{equation*}
Therefore,
 $\boldsymbol{y}=\boldsymbol{0}$
if and only if
 $F_2(\boldsymbol{w},r,h,\theta, d)=0$
and
 $F_{1,j}(\boldsymbol{w},r, h,\theta, d)=0$
for all
 $j=1,\cdots,n$
. Clearly, the second equation of (3.15) is equivalent to
 $F_{3}(\boldsymbol{w},r, h,\theta, d)=0$
. This completes the proof.
We first show that
 $\boldsymbol F(\boldsymbol{w},r,h,\theta,d)=\boldsymbol{0}$
has a unique solution for
 $d=d_*$
.
Lemma 3.4.
Assume that
 $\bf (H0)$
-
 $\bf (H1)$
hold, and
 $\tilde a-\tilde b\gt 0$
, where
 $\tilde a$
and
 $\tilde b$
are defined in (2.5). Then the following equation:
 \begin{equation} \left \{\begin{array}{l} \displaystyle{\boldsymbol F(\boldsymbol{w},r, h, \theta,d_*)=\boldsymbol{0}} \\[9pt] \displaystyle{\boldsymbol{w} \in (X_1)_{\mathbb C},\;r\ge 0,\;h \geq 0, \;\theta \in [0,2 \pi ]} \end{array}\right. \end{equation}
has a unique solution
 $ (\boldsymbol{w}_{d_*},r_{d_*}, h_{d_*},\theta _{d_*} )$
, where
 \begin{align} \boldsymbol{w}_{d_*}=\boldsymbol{0},\;\; r_{d_*}=1,\;\;h_{d_*}=\frac{ \beta ^{d_*}\sqrt{{\tilde b}^2-{\tilde a}^2}}{\sum _{j=1}^n \eta _j \varsigma _j},\;\;\theta _{d_*}=\arccos \left({-}\tilde a/ \tilde b\right), \end{align}
and
 $\beta ^{d_*}$
is defined in (2.8).
Proof. Set
 $\boldsymbol F_1=(F_{1,1}, \cdots, F_{1,n})^T$
, and
 $\boldsymbol F_1(\boldsymbol{w},r,h, \theta,d_*)=\boldsymbol{0}$
if and only if
 $\boldsymbol{w}=\boldsymbol{w}_{d_*}=\boldsymbol{0}$
. This, together with
 $F_3(\boldsymbol{w},r,h,\theta,d_*)= 0$
, implies
 $r=r_{d_*}=1$
. Note from (2.7) and (3.2) that
 $a_j^d=a_j$
and
 $b_j^d=b_j$
for
 $d=d_*$
, where
 $a_j$
and
 $b_j$
are defined in (2.6). Then, substituting
 $\boldsymbol{w}=\boldsymbol{w}_{d_*}$
and
 $r=r_{d_*}$
into
 $F_2(\boldsymbol{w},r,h,\theta,d_*)= 0$
, we see from (2.5) and (2.8) that
 \begin{equation} d_* \beta ^{d_*} \left(\tilde a+\tilde b e^{-\textrm{i}\theta } \right) -\textrm{i}d_*h \sum _{j=1}^n \eta _j \varsigma _j=0, \end{equation}
which implies that
 \begin{equation} \begin{cases} \tilde a +\tilde b \cos \theta =0, \\[5pt] \beta ^{d_*} \tilde b \sin \theta +h\sum _{j=1}^n \eta _j \varsigma _j=0. \end{cases} \end{equation}
It follows from
 $\bf (H1)$
(see also (2.12)) that
 $\tilde a+\tilde b\lt 0$
. Then if
 $\tilde a-\tilde b\gt 0$
, we have
 \begin{equation} \tilde b\lt \min \left \{\tilde a,-\tilde a\right \} \leq 0 \text{ and }-1\lt -\tilde a/ \tilde b\lt 1. \end{equation}
This, combined with (3.23), yields
 \begin{equation*}\begin {aligned} \theta =\theta _{d_*}=\arccos \left({-}\tilde a/ \tilde b\right),\;\;h=h_{d_*}=\frac { \beta ^{d_*}\sqrt {{\tilde b}^2-{\tilde a}^2}}{\sum _{j=1}^n \eta _j \varsigma _j}. \end {aligned} \end{equation*}
This completes the proof.
Then we solve
 $\boldsymbol F(\boldsymbol{w},r,h,\theta,d)= \boldsymbol{0}$
for
 $0\lt d_*-d\ll 1$
.
Theorem 3.5.
Assume that
 $\bf (H0)$
-
 $\bf (H1)$
hold, and
 $\tilde a-\tilde b\gt 0$
, where
 $\tilde a$
and
 $\tilde b$
are defined in (2.5). Then there exists
 $\tilde d_2$
 $(0\lt d_*-\tilde d_2\ll 1)$
and a continuously differentiable mapping
 $d \mapsto (\boldsymbol{w}_{d}, r_d,h_{d},\theta _{d})$
from
 $\left[\tilde d_2, d_*\right]$
to
 $ (X_1)_{\mathbb C} \times \mathbb{R}^3$
such that
 $\left(\boldsymbol{w}_{d},r_d, h_{d},\theta _{d}\right)$
is the unique solution of the following problem:
 \begin{equation} \begin{cases} \boldsymbol F(\boldsymbol{w},r, h, \theta,d)=\boldsymbol{0} \\[5pt] \boldsymbol{w} \in (X_1)_{\mathbb C},\;r\ge 0,\;h \gt 0, \;\theta \in [0,2 \pi ) \end{cases} \end{equation}
for
 $d \in \big[\tilde d_2, d_*\big)$
.
Proof. Let
 $\boldsymbol T(\boldsymbol \chi,\kappa, \epsilon,\vartheta )=(T_{1,1},\cdots,T_{1,n},T_2,T_3)^T\,:\, (X_1)_{\mathbb C} \times \mathbb{R}^3 \mapsto (X_1)_{\mathbb C} \times \mathbb{C} \times \mathbb{R}$
be the Fréchet derivative of
 $\boldsymbol F(\boldsymbol{w},r,h,\theta,d)$
with respect to
 $(\boldsymbol{w},r, h, \theta )$
at
 $(\boldsymbol{w}_{d_*}, r_{d_*}, h_{d_*}, \theta _{d_*},{d_*})$
. A direct computation yields
 \begin{align*} T_{1j}(\boldsymbol \chi,\kappa, \epsilon,\vartheta ) & = d_*\left(d_*\sum _{k=1}^{n} \alpha _{jk} \chi _{k}+ m_j\chi _{j}\right),\;\;j=1,\cdots,n, \\ T_{2}(\boldsymbol \chi,\kappa, \epsilon,\vartheta ) & = \sum _{j=1}^n\varsigma _j(\kappa \eta _j+\chi _j) \left \{m_j+d_*\beta ^{d_*}\left(a_j+b_j\right)\eta _j +d_*\beta ^{d_*}(a_j +b_j e^{-\textrm{i}\theta _{d_*}})\eta _j-\textrm{i}d_*h_{d_*}\right \} \\ &\quad -\textrm{i}\epsilon d_*\sum _{j=1}^n\varsigma _j\eta _j-\textrm{i}\vartheta d_*\beta ^{d_*} \tilde b e^{-\textrm{i}\theta _{d_*}}, \\ T_{3}(\boldsymbol \chi,\kappa, \epsilon,\vartheta ) & = \sum _{j=1}^{n}\eta _j\left(\chi _j+\overline \chi _j\right)+2\kappa \|\boldsymbol \eta \|_2^2, \end{align*}
where we have used (2.5) and (2.14) to obtain
 $T_{2}$
.
Now, we show that
 $\boldsymbol T$
is a bijection and only need to show that
 $\boldsymbol T$
is an injective mapping. By (2.1)–(2.3), we see that
 $d_*A+\text{diag}{(m_j)}$
is a bijection from
 $(X_1)_{\mathbb C}$
to
 $(X_1)_{\mathbb C}$
. Then if
 $ T_{1j}(\boldsymbol \chi,\kappa, \epsilon,\vartheta )=\boldsymbol{0}$
for all
 $j=1,\cdots,n$
, we have
 $\boldsymbol \chi = \boldsymbol{0}$
. Substituting
 $\boldsymbol \chi =\boldsymbol{0}$
into
 $T_{3}(\boldsymbol \chi,\kappa, \epsilon,\vartheta )=0$
, we have
 $\kappa =0$
. Then plugging
 $\boldsymbol \chi =\boldsymbol{0}$
and
 $\kappa =0$
into
 $\boldsymbol T_{2}(\boldsymbol \chi,\kappa, \epsilon,\vartheta )=\boldsymbol{0}$
, we see from (3.21) that
 $\epsilon =\vartheta =0$
. Therefore,
 $\boldsymbol T$
is an injection. It follows from the implicit function theorem that there exists
 $\tilde d_2 \in [d_2, d_*)$
and a continuously differentiable mapping
 $d \mapsto (\boldsymbol{w}_{d},r_d, h_{d}, \theta _{d})$
from
 $[\tilde d_2, d_*]$
to
 $(X_1)_{\mathbb C} \times \mathbb{R}^3$
such that
 $(\boldsymbol{w}_{d},r_d, h_{d}, \theta _{d})$
satisfies (3.25).
Then, we prove the uniqueness of the solution of (3.25). Actually, we only need to verify that if
 $\left(\boldsymbol{w}^{d},r^d, h^{d}, \theta ^{d}\right)$
satisfies (3.25), then
 $\displaystyle \left(\boldsymbol{w}^{d},r^d, h^{d},\theta ^{d} \right) \rightarrow \left(\boldsymbol{w}_{d_*}, r_{d_*},h_{d_*},\theta _{d_*} \right)= \left(\boldsymbol{0},1,h_{d_*},\theta _{d_*} \right)$
as
 $d \rightarrow d_*.$
It follows from Lemma 3.1 that
 $h^d$
is bounded for
 $d\in [\tilde d _2,{d_*})$
. Then, up to a subsequence, we can assume that
 $\lim _{d\to d_*}\theta ^{d}=\theta ^{d_*}$
and
 $\lim _{d\to d_*}h^{d}=h^{d_*}$
. It follows from Lemma 3.1 that
 $\lim _{d\to d_*}r^{d}=r_{d_*}=1,$
 $\lim _{d\to d_*}\boldsymbol{w}^{d}=\boldsymbol{w}_{d_*}=\boldsymbol{0}.$
Taking the limits of
 $\boldsymbol F\!\left(\boldsymbol{w}^{d},r^{d}, h^{d},\theta ^{d}, d\right)=\boldsymbol{0}$
as
 $d\to d_*$
, we have
 \begin{equation*} \boldsymbol F\!\left(\boldsymbol{w}_{d_*},r_{d_*}, h^{d_*},\theta ^{d_*}, d_*\right)=\boldsymbol {0}. \end{equation*}
This, combined with Lemma 3.4, implies that
 $\theta ^{d_*}=\theta _{d_*}$
and
 $h^{d_*}=h_{d_*}$
, Therefore,
 $ \left(\boldsymbol{w}^{d},r^d, h^{d},\theta ^{d} \right) \rightarrow \left(\boldsymbol{w}_{d_*}, r_{d_*},h_{d_*},\theta _{d_*} \right)$
as
 $d\rightarrow{d_*}$
. This completes the proof.
By Theorem 3.5, we obtain the following result.
Theorem 3.6.
Assume that
 $\bf (H0)$
-
 $\bf (H1)$
hold, and
 $\tilde a-\tilde b\gt 0$
, where
 $\tilde a$
and
 $\tilde b$
are defined in (2.5). Then for each
 $d\in [\tilde d_2, d_*)$
, where
 $0\lt d_*-\tilde d_2\ll 1$
, the following equation:
 \begin{equation*} \left \{\begin {array}{l} {\Delta (d, \textrm{i} \nu, \tau )\boldsymbol \psi =\boldsymbol {0}} \\[5pt] {\nu \gt 0,\; \tau \geq 0,\; \boldsymbol \psi (\neq \boldsymbol {0}) \in \mathbb {C}^{n}} \end {array}\right. \end{equation*}
has a solution
 $(\nu,\tau, \boldsymbol \psi )$
, if and only if
 \begin{equation} \nu = \nu _{d}=(d_*-d)h_{d},\;\boldsymbol \psi =c \boldsymbol \psi _{d},\; \tau =\tau _{d,l}=\frac{\theta _d+2 l \pi }{\nu _d},\;\; l=0,1,2, \cdots, \end{equation}
where
 $\boldsymbol \psi _{d}=r_{d}\boldsymbol \eta +\boldsymbol{w}_{d}$
,
 $c$
is a nonzero constant, and
 $\boldsymbol{w}_{d},r_d, \theta _{d}, h_{d}$
are defined in Theorem
3.5.
For further application, we consider the adjoint eigenvalue problem of (3.3). For
 $\boldsymbol \psi, \widetilde{\boldsymbol \psi } \in \mathbb C^n$
, we have
 \begin{equation*} \left\langle \widetilde {\boldsymbol \psi }, \Delta (d,\textrm{i}\nu _d, \tau _{d,l})\boldsymbol \psi \right\rangle =\left\langle \widetilde {\Delta }(d,\textrm{i}\nu _d, \tau _{d,l}) \widetilde {\boldsymbol \psi }, \boldsymbol \psi \right\rangle, \end{equation*}
where
 \begin{align} \widetilde{\Delta }(d,\textrm{i}\nu _{d}, \tau _{d,l}) \widetilde{\boldsymbol \psi }= &d A^T\widetilde{\boldsymbol \psi } + \textrm{diag} \!\left(f_j \left(u^d_{j},u^d_{j}\right)\right)\widetilde{\boldsymbol \psi } + \textrm{diag}\!\left(u^d_{j} a_{j}^{d}\right)\widetilde{\boldsymbol \psi }\nonumber\\[2pt] &+ \textrm{diag}\!\left(u^d_{j} b_{j}^{d}\right)\widetilde{\boldsymbol \psi } e^{\textrm{i}\nu _d \tau _{d,l}}+\textrm{i}\nu _d \widetilde{\boldsymbol \psi }. \end{align}
Here,
 $\widetilde{\Delta }(d, \textrm{i}\nu _d, \tau _{d,l})$
is the conjugate transpose matrix of
 ${\Delta }(d,\textrm{i}\nu _d, \tau _{d,l})$
. Clearly,
 $0$
is also an eigenvalue of
 $\widetilde{\Delta }(d, \textrm{i}\nu _d, \tau _{d,l})$
.
Proposition 3.7.
Let
 $\widetilde{\boldsymbol \psi }_{d}$
be the corresponding eigenvector of
 $\widetilde{\Delta } (d, \textrm{i}{\nu _d},{\tau }_{d,l} )$
with respect to eigenvalue
 $0$
. Then, ignoring a scalar factor,
 $\widetilde{\boldsymbol \psi }_{d}$
can be represented as follows:
 \begin{equation} \begin{cases} \widetilde{\boldsymbol \psi }_{d}=\widetilde{r}_{d} \boldsymbol \varsigma + \widetilde{\boldsymbol{w}}_{d}, \;\widetilde{\boldsymbol{w}}_{d} \in \left(\widetilde{X}_{1}\right)_{\mathbb{C}}, \; \widetilde{r}_{d}\geq 0, \\[5pt] \|\widetilde{\boldsymbol \psi }_d\|_2^2=\|\boldsymbol \varsigma \|_2^2, \end{cases} \end{equation}
and satisfies
 \begin{equation} \lim _{d\to d_*} \widetilde{\boldsymbol \psi }_{d}=\boldsymbol \varsigma, \end{equation}
where
 $\boldsymbol \varsigma$
is defined in (2.1).
Proof. It follows from (3.28) that
 $\widetilde{\boldsymbol \psi }_{d}$
is bounded. Then, up to a subsequence, we can assume that
 $\lim _{d\to d_*}\widetilde{\boldsymbol \psi }_{d}=\widetilde{\boldsymbol \psi }^*$
. Substituting
 $\widetilde{\boldsymbol \psi }=\widetilde{\boldsymbol \psi }_{d}$
into (3.27), and taking
 $d\to d_*$
, we have
 \begin{equation} \left(d_* A^T+ \text{diag}(m_j) \right)\widetilde{\boldsymbol \psi }^*=\boldsymbol{0}, \end{equation}
Noticing that
 $(d_* A^T+ \text{diag}(m_j) )\boldsymbol \varsigma = \boldsymbol{0}$
, we see from (3.28) and (3.30) that
 $\widetilde{\boldsymbol \psi }^*=\boldsymbol \varsigma$
. This completes the proof.
For simplicity, we will always assume
 $d \in [\tilde d_2,d_*)$
in the following Theorems 3.8–3.10, where
 $0\lt d_*-\tilde d_2\ll 1$
. Actually,
 $\tilde d_2$
may be chosen bigger than the one in Theorem 3.5 since further perturbation arguments are used. Next, we show that
 $\textrm{i}\nu _{d}$
(obtained in Theorem 3.6) is simple, and the transversality condition holds.
Theorem 3.8.
Assume that
 $\bf (H0)$
-
 $\bf (H1)$
hold,
 $\tilde a-\tilde b\gt 0$
, and
 $d \in [\tilde d_2,d_*)$
, where
 $0\lt d_*-\tilde d_2\ll 1$
. Then
 $\mu =\textrm{i} \nu _{d}$
is a simple eigenvalue of
 $A_{\tau _{d,l}}(d)$
for
 $l=0,1,2, \cdots$
.
Proof. It follows from Theorem 3.6 that
 $\mathscr{N} [A_{\tau _{d,l}}(d)-\textrm{i} \nu _{d} ]=\textrm{span} [e^{\textrm{i} \nu _{d} \theta }\boldsymbol \psi _d ]$
, where
 $\theta \in [{-} \tau _{d,l},0]$
and
 $\boldsymbol \psi _{d}$
is defined in Theorem 3.6. Then, we show that
 \begin{equation*}\mathscr {N}\left [A_{\tau _{d,l}}(d)-\textrm{i} \nu _{d}\right ]^{2}=\mathscr {N}\left [{A}_{\tau _{d,l}}(d)-\textrm{i} \nu _{d}\right ].\end{equation*}
If
 $\boldsymbol \phi \in \mathscr{N} [A_{\tau _{d,l}}(d)-\textrm{i} \nu _{d} ]^2$
, then
 \begin{equation*} \left [A_{\tau _{d,l}}(d)-\textrm{i} \nu _{d}\right ]\boldsymbol \phi \in \mathscr {N}\left [A_{\tau _{d,l}}(d)-\textrm{i} \nu _{d}\right ]=\textrm{span}\left [e^{\textrm{i} \nu _{d} \theta }\boldsymbol \psi _d \right ], \end{equation*}
and consequently, there exists a constant
 $\gamma$
such that
 \begin{equation*} \left [A_{\tau _{d,l}}(d)-\textrm{i} \nu _{d}\right ]\boldsymbol \phi =\gamma e^{\textrm{i} \nu _{d} \theta }\boldsymbol \psi _d, \end{equation*}
which yields
 \begin{align} \dot{\boldsymbol \phi }(\theta ) & = \textrm{i} \nu _{d}\boldsymbol \phi (\theta )+\gamma e^{\textrm{i} \nu _{d} \theta }\boldsymbol \psi _d, \quad \theta \in \left [{-}\tau _{d,l}, 0\right ], \nonumber\\[5pt] \dot{\boldsymbol \phi }(0) & = dA\boldsymbol \phi (0)+ \textrm{diag} \!\left(f_j \left(u^d_{j},u^d_{j}\right)\right)\boldsymbol \phi (0) + \textrm{diag}\!\left(u^d_{j} a_{j}^{d}\right)\boldsymbol \phi (0) + \textrm{diag}\!\left(u^d_{j} b_{j}^{d}\right)\boldsymbol \phi ({-}\tau _{d,l}). \end{align}
By the first equation of equation (3.31), we obtain that
 \begin{align} \boldsymbol \phi (\theta ) &=\boldsymbol \phi (0) e^{\textrm{i} \nu _{d} \theta }+\gamma \theta e^{\textrm{i} \nu _{d} \theta }\boldsymbol \psi _d, \nonumber\\ \dot{\boldsymbol \phi }(0) &=\textrm{i} \nu _{d}\boldsymbol \phi (0)+\gamma \boldsymbol \psi _d. \end{align}
This, together with the second equation of (3.31), yields
 \begin{align} \Delta \left(d, \textrm{i} \nu _d, \tau _{d,l}\right)\boldsymbol \phi (0) & = dA\boldsymbol \phi (0)+ \textrm{diag} \!\left(f_j \left(u^d_{j},u^d_{j}\right)\right)\boldsymbol \phi (0) + \textrm{diag}\!\left(u^d_{j} a_{j}^{d}\right)\boldsymbol \phi (0)\nonumber\\ & \quad + e^{-\textrm{i} \theta _{d}}\textrm{diag}\!\left(u^d_{j} b_{j}^{d}\right)\boldsymbol \phi (0) - \textrm{i}\nu _{d} \boldsymbol \phi (0)\nonumber\\ & = \gamma \left(\boldsymbol \psi _d+ \tau _{d,l} e^{-\textrm{i} \theta _{d}}\textrm{diag}\!\left(u^d_{j} b_{j}^{d}\right)\boldsymbol \psi _d\right). \end{align}
Multiplying both sides of (3.33) by
 $\left(\overline{\widetilde \psi }_{d,1}, \cdots, \overline{\widetilde \psi }_{d,n}\right)$
to the left, we have
 \begin{equation*} \begin {aligned} 0 &=\left \langle \widetilde \Delta \left(d, \textrm{i} \nu _{d},\tau _{d,l}\right)\widetilde {\boldsymbol \psi }_{d}, \boldsymbol \phi (0)\right \rangle =\left \langle \widetilde {\boldsymbol \psi }_d, \Delta \left({d}, \textrm{i} \nu _{d}, \tau _{d,l}\right)\boldsymbol \phi (0)\right \rangle \\ & = \gamma \left(\sum _{j=1}^n\overline {\widetilde \psi }_{d,j}\psi _{d,j}+ \tau _{d,l} e^{-\textrm{i} \theta _{d}} \sum _{j=1}^n u^d_{j}b_{j}^{d}\overline {\widetilde \psi }_{d,j}\psi _{d,j}\right). \end {aligned} \end{equation*}
Define
 \begin{equation} S_{l}(d)\,:\!=\,\sum _{j=1}^n\overline{\widetilde{\psi }}_{d,j}\psi _{d,j}+ \tau _{d,l} e^{-\textrm{i} \theta _d} \sum _{j=1}^n u^d_{j}b_j^{d}\overline{\widetilde{\psi }}_{d,j}\psi _{d,j}. \end{equation}
By Theorems 3.5, 3.6 and (3.29), we have
 $\boldsymbol \psi _d\to \boldsymbol \eta$
,
 $\widetilde{\boldsymbol \psi }_d\to \boldsymbol \varsigma$
,
 $\theta _d\to \theta _{d_*}$
,
 $(d_*-d)\tau _{d,l}\to \frac{\theta _{d_*}+2l\pi }{h_{d_*}}$
and
 $b_j^{d}\to b_j$
for
 $j=1,\cdots,n$
as
 $d\to d_*$
, where
 $\theta _{d_*}$
and
 $h_{d_*}$
are defined in (3.21). Then we see from (2.7) and (3.21) that
 \begin{equation*} \lim _{d\to {d_*}}S_l(d)=\sum _{j=1}^n \varsigma _j \eta _j \left [1+\left(\theta _{d_*}+2 l \pi \right)\left(\frac {-\tilde a}{\sqrt {\tilde {b}^{2}-\tilde a^{2}}} +\textrm{i}\right)\right ] \neq 0, \end{equation*}
which implies that
 $\gamma =0$
for
 $d \in [\tilde d_2, d_*)$
, where
 $0\lt d_*-\tilde d_2\ll 1$
. Therefore, for any
 $l=0,1,2,\cdots$
,
 \begin{equation*} \mathscr {N}[A_{\tau _{d,l}}(d)-\textrm{i}\nu _d]^j =\mathscr {N}[A_{\tau _{d,l}}(d)-\textrm{i}\nu _d],\;\;j= 2,3,\cdots, \end{equation*}
and consequently,
 $\textrm{i}\nu _d$
is a simple eigenvalue of
 $A_{\tau _{d,l}}(d)$
for
 $l=0,1,2,\cdots$
.
By Theorem 3.8, we see that
 $\mu =\textrm{i}\nu _{d}$
is a simple eigenvalue of
 $A_{\tau _{d,l}}(d)$
. Then, it follows from the implicit function theorem, for each
 $l=0,1,\cdots$
, there exists a neighbourhood
 $O_{l}\times D_{l}\times H_{l}$
of
 $(\tau _{d,l},\textrm{i}\nu _d,{\boldsymbol \psi }_d)$
and a continuously differentiable function
 $(\mu (\tau ),\boldsymbol \psi (\tau ))\,:\,O_{q,l}\rightarrow D_{q,l}\times H_{q,l}$
such that
 $ \mu (\tau _{d,l})=\textrm{i}\nu _d$
,
 $\boldsymbol \psi (\tau _{d,l})={\boldsymbol \psi }_d$
, and for each
 $\tau \in O_{l}$
, the only eigenvalue of
 $A_\tau (d)$
in
 $D_{l}$
is
 $\mu (\tau ),$
and
 \begin{equation} \begin{split} \Delta (d,\mu (\tau ),\tau )\boldsymbol \psi (\tau )\,=\,&dA\boldsymbol \psi (\tau )+ \textrm{diag} \!\left(f_j \left(u^d_{j},u^d_{j}\right)\right)\boldsymbol \psi (\tau ) + \textrm{diag}\!\left(u^d_{j} a_{j}^{d}\right)\boldsymbol \psi (\tau )\\ &+\, e^{-\mu (\tau ) \tau }\textrm{diag}\!\left(u^d_{j} b_{j}^{d}\right)\boldsymbol \psi (\tau ) - \mu (\tau ) \boldsymbol \psi (\tau )=\boldsymbol{0}. \end{split} \end{equation}
Then, we prove that the following transversality condition holds.
Theorem 3.9.
Assume that
 $\bf (H0)$
-
 $\bf (H1)$
hold,
 $\tilde a-\tilde b\gt 0$
, and
 $d \in [\tilde d_2, d_*)$
, where
 $0\lt d_*-\tilde d_2\ll 1$
. Then
 \begin{equation*} \frac {d \mathcal {R} e\left [\mu \left(\tau _{d,l}\right)\right ]}{d \tau }\gt 0, \quad l=0,1,2, \cdots. \end{equation*}
Proof. Differentiating equation (3.35) with respect to
 $\tau$
at
 $\tau =\tau _{d,l}$
, we have
 \begin{equation} \begin{split} \displaystyle -\frac{d \mu \left(\tau _{d,l}\right)}{d \tau } &\left( \tau _{d,l}\textrm{diag}\!\left(u^d_{j}b_{j}^{d}\right)\boldsymbol \psi _{d}e^{-\textrm{i}\theta _{d}}+\boldsymbol \psi _d \right)+\Delta \left(d, \textrm{i} \nu _d, \tau _{d,l}\right) \frac{\boldsymbol \psi \left(\tau _{d,l}\right)}{d \tau }\\ &- \textrm{i} \nu _d \textrm{diag}\!\left(u^d_{j}b_{j}^{d}\right)\boldsymbol \psi _{d}e^{-\textrm{i}\theta _d} =\boldsymbol{0}. \end{split} \end{equation}
Clearly,
 \begin{equation*} \left \langle \widetilde {\boldsymbol \psi }_d,\Delta \left(d, \textrm{i} \nu _d, \tau _{d,l}\right) \frac {d \boldsymbol \psi \left(\tau _{d,l}\right)}{d \tau }\right \rangle =\left \langle \widetilde \Delta \left(d,\textrm{i} \nu _d,\tau _{d,l}\right) \widetilde {\boldsymbol \psi }_d, \frac {d \boldsymbol \psi \left(\tau _{d,l}\right)}{d \tau }\right \rangle = 0. \end{equation*}
Then, multiplying both sides of equation (3.36) by
 $(\overline{\widetilde \psi }_{d,1}, \cdots, \overline{\widetilde \psi }_{d,n})$
to the left, we have
 \begin{equation*} \begin {aligned} \frac {d \mu \left(\tau _{d,l}\right)}{d \tau }=& \frac {-\textrm{i} \nu _{d}\sum _{j=1}^{n} u^d_{j} b_{j}^{d}\overline {\widetilde \psi }_{d,j}\psi _{d,j}e^{-\textrm{i}\theta _{d}}}{\sum _{j=1}^{n}\overline {\widetilde \psi }_{d,j}\psi _{d,j}+ \tau _{d,l} \sum _{j=1}^{n} u^d_{j} b_{j}^{d} \overline {\widetilde \psi }_{d,j}\psi _{d,j} e^{-\textrm{i}\theta _{d}}} \\ =&\frac {1}{\left |S_{l}(d)\right |^{2}}\left [{-}\textrm{i} \nu _{d}e^{-\textrm{i}\theta _{d}}\left(\sum _{j=1}^{n}{\widetilde \psi }_{d,j}\overline {\psi }_{d,j} \right) \sum _{j=1}^{n} u^d_{j} b_{j}^{d} \overline {\widetilde \psi }_{d,j}\psi _{d,j}\right .\\ &\left .-\textrm{i} \nu _{d}\tau _{d,l} \left(\sum _{j=1}^{n} u^d_{j} b_{j}^{d} \overline {\widetilde \psi }_{d,j}\psi _{d,j}\right) \left(\sum _{j=1}^{n} u^d_{j} b_{j}^{d} {\widetilde \psi }_{d,j}\overline {\psi }_{d,j}\right)\right ]. \end {aligned} \end{equation*}
It follows from Theorems 3.5, 3.6 and (3.29) that
 $\boldsymbol \psi _{d}\to \boldsymbol \eta$
,
 $\widetilde{\boldsymbol \psi }_{d}\to \boldsymbol \varsigma$
,
 $\theta _d\to \theta _{d_*}$
,
 $\displaystyle \frac{\nu _{d}}{d_*-d}={h_{d}}\to{h_{d_*}}$
and
 $b_j^{d}\to b_j$
for
 $j=1,\cdots,n$
as
 $d\to d_*$
, where
 $\theta _{d_*}$
and
 $h_{d_*}$
are defined in (3.21). Then we see that
 \begin{equation*}\begin {aligned} \lim _{d \rightarrow {d_*}} &\frac {1}{(d_*-d)^2}\frac {d \mathcal {R} e\left [\mu \left(\tau _{d,l}\right)\right ]}{d \tau }=\frac { \left(\beta ^{d_*} \right)^2 \left({\tilde b}^2-{\tilde a}^2\right)}{\lim _{d\rightarrow d_*}\left |S_{l}(d)\right |^{2}}\gt 0, \end {aligned}\end{equation*}
where we have used (3.24) in the last step. This completes the proof.
By Theorems 3.6, 3.8 and 3.9, we obtain the main result for this subsection.
Theorem 3.10.
Assume that
 $\bf (H0)$
-
 $\bf (H1)$
hold and
 $d \in [\tilde d_2, d_*)$
, where
 $0\lt d_*-\tilde d_2 \ll 1$
. Let
 $\boldsymbol{u}^{d}$
be the positive equilibrium of model (1.2) obtained in Lemma 2.2
. Then the following statements hold.
-
(i) If
$\tilde a-\tilde b\lt 0$
, where
$\tilde a$
and
$\tilde b$
are defined in (2.5), then
$\boldsymbol{u}^{d}$
is locally asymptotically stable for
$\tau \in [0, \infty )$
. -
(ii) If
$\tilde a-\tilde b\gt 0,$
then there exists
$\tau _{d,0}\gt 0$
such that
$\boldsymbol{u}^{d}$
of (1.2) is locally asymptotically stable for
$\tau \in [0, \tau _{d,0} )$
, and unstable for
$\tau \in (\tau _{d,0}, \infty ).$
Moreover, when
$\tau =\tau _{d,0},$
system (1.2) undergoes a Hopf bifurcation at
$\boldsymbol{u}^{d}$
.


3.2. The case of
$0\lt \boldsymbol{d}\ll 1$

In this section, we will consider the case of
 $0\lt d\ll 1$
. First, we give a priori estimates for solutions of (3.3).
Lemma 3.11.
Assume that
 $ \left(\mu ^d,{\tau }^d, \boldsymbol{\varphi }^d \right)$
solves (3.3), where
 $\mathcal{R}e \mu ^{d},{\tau }^d \ge 0$
, and
 $\boldsymbol{\varphi }^d=\left(\varphi _1^d,\cdots,\varphi _n^d\right)^T({\ne} \boldsymbol{0}) \in \mathbb{C}^n$
. Then for any
 $\tilde d\gt 0$
,
 $ |\mu ^d |$
is bounded for
 $d\in (0,\tilde d]$
.
Proof. Without loss of generality, we assume that
 $\|\boldsymbol{\varphi }^d\|_2^2=1$
. Substituting
 $\left(\mu ^d,{\tau }^d, \boldsymbol{\varphi }^d\right)$
into (3.3) and multiplying both sides of (3.3) by
 $ (\overline{\varphi _1^d},\cdots,\overline{\varphi _n^d} )$
to the left, we obtain that
 \begin{align*} \left(\overline{\varphi _1^d},\cdots,\overline{\varphi _n^d}\right)&\Big[dA\boldsymbol{\varphi }^d+\textrm{diag}\!\left(f_j\left(u_j^d,u_j^d\right)\right)\boldsymbol{\varphi }^d+\textrm{diag}\!\left(u_j^d a_{j}^{d}\right)\boldsymbol{ \varphi }^d\\ &\left .+e^{-\mu ^d{\tau }^d}\textrm{diag}\!\left(u_j^d b_{j}^{d}\right)\boldsymbol{ \varphi }^d-\mu ^d\boldsymbol{\varphi }^d\right ]=0. \end{align*}
Then, for
 $d\in (0,\tilde d]$
, we have
 \begin{equation*} \left |\mu ^d\right |\le \max _{d\in [0,\tilde d],1\le j\le n}|f_j\left(u_j^d,u_j^d\right)|+ \max _{d\in [0,\tilde d],1\le j\le n}|u_{j}^{d} a_{j}^{d}|+ \max _{d\in [0,\tilde d],1\le j\le n}|u_{j}^{d} b_{j}^{d}|+\tilde d n\max _{1\le j,k\le n} |\alpha _{jk}|, \end{equation*}
and consequently,
 $ |\mu ^d |$
is bounded for
 $d\in (0,\tilde d]$
.
Using similar arguments as in the proof of Theorem 3.2, we can obtain the following result, and here we omit the proof for simplicity.
Theorem 3.12.
Assume that
 $\bf (H0)$
-
 $\bf (H1)$
hold, and
 $a_j^0-b_j^0\lt 0$
for all
 $j=1,\cdots,n$
, where
 $a_j^0$
and
 $b_j^0$
are defined in (2.10). Then there exists
 $\hat d_1\in (0,d_*]$
, such that
 \begin{equation*}\sigma \left(A_{\tau }(d)\right) \subset \{x+ \textit{i} y\,:\, x, y \in \mathbb {R}, x\lt 0\}\;\;\textit{for}\;\;d\in (0,\hat d_1]\;\;\textit{and}\;\;\tau \ge 0.\end{equation*}
It follows from Theorem 3.12 that if
 $a_j^0-b_j^0\lt 0$
for all
 $j=1,\cdots,n$
, then Hopf bifurcations cannot occur for
 $0\lt d\ll 1$
. Then we define
 \begin{equation} \mathcal{M}=\left \{j\in 1, \cdots, n\,:\,a_j^0-b_j^0\gt 0\right \}, \end{equation}
and show that Hopf bifurcations can occur when
 $\mathcal{M} \ne \emptyset$
. For simplicity, we impose the following assumption:
-
$\bf (H2)$
$a_j^0-b_j^0\gt 0$
for
$j=1,\cdots,p$
, and
$a_j^0-b_j^0\lt 0$
for
$j=p+1,\cdots,n$
, where
$1\le p\le n$
.


In fact, if the patches are independent of each other (
 $d=0$
), we have
 \begin{equation} \displaystyle u^{\prime}_{j}= u_j f_j \left(u_j, u_{j}(t-\tau )\right),\; t\gt 0,\;\;j=1, \cdots, n. \end{equation}
A direct computation implies the following result.
Lemma 3.13.
Assume that
 $\bf (H1)$
-
 $\bf (H2)$
hold. Then for each
 $1\le j\le n$
, model (3.38) admits a unique positive equilibrium
 $u_j^0$
, where
 $u_j^0$
(defined in Lemma 2.3) is the unique positive solution of
 $f_j(x,x)=0$
. Moreover, the following statements hold.
-
(i) For each
$1\le j \le p$
, the unique positive equilibrium
$u_j^0$
of model (3.38) is locally asymptotically stable when
$\tau \in [0, \tau _{j}^0)$
, and unstable when
$\tau \in (\tau _{j}^0,\infty )$
. Moreover, when
$\tau =\tau _{j}^0$
, model (3.38) undergoes a Hopf bifurcation, where
(3.39)
\begin{equation} \displaystyle \tau _{j}^0=\frac{\theta _j^0}{\nu _j^0}\;\;\textit{with}\;\;\theta _j^0=\arccos \left({-}a_{j}^{0}/b_{j}^{0}\right)\in (0,\pi )\;\ \textit{and}\;\; \nu _j^0=u_j^0\sqrt{\left(b_{j}^{0}\right)^2-\left(a_{j}^{0}\right)^2}\gt 0. \end{equation}
-
(ii) For each
$p+1\le j \le n$
, the unique positive equilibrium
$u_j^0$
of model (3.38) is locally asymptotically stable for
$\tau \ge 0$
.


Now, we consider the solution of (3.14) for
 $d=0$
.
Lemma 3.14.
Assume that
 $\bf (H1)$
-
 $\bf (H2)$
hold,
 $d=0$
, and
 \begin{equation} \displaystyle \left({{\nu _j^0}, \theta _j^0}\right)\ne \left({{\nu _k^0},\theta _k^0}\right) \;\;\textit{for any}\;\;j\ne k \;\;\textit{and}\;\;1\le j,k\le p, \end{equation}
where
 $\theta _j^0$
and
 $\nu _j^0$
are defined in (3.39) for
 $j=1,\cdots,p$
. Then
 \begin{equation} \left \{(\nu,\theta )\,:\,\nu \ge 0,\;\theta \in [0,2\pi ], \;\mathcal S^0(\nu,\theta )\ne \{\boldsymbol{0}\}\right \}=\left \{\left(\nu _q^0,\theta _q^0\right)\right \}_{q=1}^p, \end{equation}
where
 $\left(\nu _q^0,\theta _q^0\right)\in (0,\infty )\times (0,\pi )$
, and
 \begin{equation*} \mathcal S^0(\nu,\theta )\,:\!=\,\{\boldsymbol {\varphi }\,:\, \boldsymbol H(0, \nu,\theta,\boldsymbol {\varphi })=\boldsymbol {0}\} \end{equation*}
with
 $\boldsymbol H(d,\nu,\theta, \boldsymbol{\varphi })$
defined in (3.14). Moreover, denoting
 $\mathcal S_q=\mathcal S^0\left(\nu _q^0,\theta _q^0\right)$
for any
 $q=1,\cdots,p$
, we have
 $\mathcal S_q=\left\{c\boldsymbol{\varphi }_q^0\,:\,c\in \mathbb C\right\}$
, where
 ${\boldsymbol{\varphi }}^{0}_q=\left(\varphi ^{0}_{q,1},\cdots,\varphi ^{0}_{q,n}\right)$
,
 $\varphi ^{0}_{q,q}=1$
and
 $\varphi ^{0}_{q,j}=0$
for
 $j\ne q$
.
Proof. It follows from Lemma 2.3 that
 $u_j^{0}$
satisfies
 $f_j\left(u_j^{0},u_j^{0}\right)=0$
for
 $j=1,\cdots,n$
. Therefore, if there exists
 $\boldsymbol{\varphi }\ne \boldsymbol{0}$
such that
 $\boldsymbol H(0, \nu,\theta,\boldsymbol{\varphi })=\boldsymbol{0}$
, then
 \begin{equation*} \prod _{i=1}^n\left(u_j^0a_{j}^{0}+u_j^0 b_{j}^{0}e^{-\textrm{i}\theta }-\textrm{i} \nu \right)=0, \end{equation*}
and consequently, for
 $j=1,\cdots,n$
,
 \begin{equation*} \begin {cases} a_{j}^{0} +b_{j}^{0} \cos \theta =0, \\[4pt] u_j^0 b_{j}^{0} \sin \theta +\nu =0. \end {cases} \end{equation*}
It follows from
 $\bf (H1)$
and
 $\bf (H2)$
that
 $a_j^0+b_j^0\lt 0$
for
 $j=1, \cdots, n$
and
 $a_j^0-b_j^0\gt 0$
for
 $j=1, \cdots, p$
. Then, for
 $j=1,\cdots,p$
,
 \begin{equation} b_{j}^{0}\lt \min \left \{a_{j}^{0},-a_{j}^{0}\right \} \leq 0 \text{ and }-1\lt -a_{j}^{0}/ b_{j}^{0}\lt 1, \end{equation}
which leads to
 $\nu =\nu _q^0$
,
 $\theta =\theta _q^0$
for
 $q=1,\cdots,p$
, where
 $\nu _q^0$
and
 $\theta _q^0$
are defined in (3.39). Since
 $\displaystyle ({{\nu _j^0}, \theta _j^0} )\ne ({{\nu _k^0},\theta _k^0} )$
for any
 $j\ne k$
and
 $1\le j,k\le p$
, it follows that
 $\mathcal S^0_q=\{c\boldsymbol{\varphi }_q^0\,:\,c\in \mathbb C\}$
. This completes the proof.
Remark 3.15. We remark that if
 \begin{equation} \displaystyle \frac{\theta _j^0}{\nu _j^0}\ne \frac{\theta _k^0}{\nu _k^0} \;\;\text{for any}\;\;j\ne k \;\;\text{and}\;\;1\le j,k\le p, \end{equation}
then (3.40) in Lemma 3.14 hold. By Lemma 3.13, we see that (3.43) implies that the first Hopf bifurcation values of model (3.38) for
 $1\le j\le p$
are not identical. That is, the first Hopf bifurcation values of each isolated patch
 $j$
for
 $1\le j\le p$
are not identical.
Then we consider the solution of (3.14) for
 $0\lt d\ll 1$
.
Lemma 3.16.
Assume that
 $\bf (H0)$
-
 $\bf (H2)$
and (3.40) hold, and
 $d\in (0,\tilde d)$
with
 $0\lt \tilde d\ll 1$
. Then there exists
 $p$
pairs of
 $\left(\nu _q^d,\theta _q^d\right)\in (0,\infty )\times (0,\pi )$
such that
 \begin{equation} \left \{(\nu,\theta )\,:\,\nu \ge 0,\;\theta \in [0,2\pi ), \;\mathcal S^d(\nu,\theta )\ne \{\boldsymbol{0}\}\right \}=\left \{\left(\nu _q^d,\theta _q^d\right)\right \}_{q=1}^p, \end{equation}
where
 \begin{equation*} \mathcal S^d(\nu,\theta )\,:\!=\,\{\boldsymbol {\varphi }\,:\, \boldsymbol H(d, \nu,\theta,\boldsymbol {\varphi })=\boldsymbol {0}\} \end{equation*}
with
 $\boldsymbol H(d,\nu,\theta, \boldsymbol{\varphi })$
defined in (3.14). Moreover, denoting
 $\mathcal S^d_q=S^d\left(\nu _q^d,\theta _q^d\right)$
for any
 $q=1,\cdots,p$
, we have
 $\mathcal S^d_q=\left\{c\boldsymbol{\varphi }_q^d\,:\,c\in \mathbb C\right\}$
, and
 \begin{equation*}\label {limd} \lim _{d\to 0} \nu _q^d= \nu _q^0=u_q^0\sqrt {\left(b_{q}^{0}\right)^2-\left(a_{q}^{0}\right)^2}, \;\;\lim _{d\to 0} \theta _q^d= \theta _q^0=\arccos \left({-}a_{q}^{0}/b_{q}^{0}\right) \;\;\textit {and}\;\;\lim _{d\to 0}\boldsymbol {\varphi }_q^d=\boldsymbol {\varphi }_q^0, \end{equation*}
where
 $\nu _q^0$
,
 $\theta _q^0$
and
 $\boldsymbol{\varphi }_q^0$
are defined in Lemma 3.14
.
Proof. First, we show the existence. Here, we will only show the existence of
 $(\nu _1^d,\theta _1^d)$
, and the others could be obtained similarly. Let
 \begin{equation*}Y_1\,:\!=\,\{\boldsymbol{x}=(x_1,\cdots,x_n)^T\in \mathbb {C}^n\,:\,x_1=0\},\end{equation*}
and consequently
 $\mathbb C^n=\textrm{span}\{\boldsymbol{\varphi }_1^0\}\oplus Y_1$
. Let
 \begin{equation*}\boldsymbol H_1\left(d, \nu,\theta,\boldsymbol \xi _1\right)\,:\!=\,\boldsymbol H\left(d, \nu,\theta,\boldsymbol {\varphi }^0_1+\boldsymbol \xi _1\right)\,:\,\mathbb R^3\times Y_1\to \mathbb C^n.\end{equation*}
Clearly, we have
 $\boldsymbol H_1\left(0,\nu _1^0,\theta _1^0,\boldsymbol{0}\right)=\boldsymbol{0}$
, and the Fréchet derivative of
 $\boldsymbol H_1$
with respect to
 $(\nu,\theta,\boldsymbol \xi _1)$
at
 $\left(0,\nu _1^0,\theta _1^0,\boldsymbol{0}\right)$
is
 \begin{align*} D_{(\nu,\theta,\boldsymbol \xi _1)}\boldsymbol H_1\left(0,\nu _1^0,\theta _1^0,\boldsymbol{0}\right)[\vartheta,\epsilon,\boldsymbol \chi ]=\left(\begin{array}{c} \displaystyle -\textrm{i} e^{-\textrm{i} \theta _1^0}b_{1}^{0}u_1^0\epsilon -\textrm{i}\vartheta \\[4pt] \displaystyle \left(a_{2}^{0}u_2^0+b_{2}^{0}u_2^0e^{-\textrm{i} \theta _1^0} -\textrm{i} \nu _1^0\right) \chi _2\\ \vdots \\ \displaystyle \left(a_{n}^{0}u_n^0+ b_{n}^{0}u_n^0e^{-\textrm{i} \theta _1^0} -\textrm{i} \nu _1^0\right) \chi _n\\ \end{array}\right), \end{align*}
where
 $\vartheta,\epsilon \in \mathbb R$
and
 $\boldsymbol \chi =(\chi _1,\cdots,\chi _n)\in Y_1$
. Note from (3.40) that
 $D_{(\nu,\theta,\boldsymbol \xi )}\boldsymbol H_1\left(0,\nu _1^0,\theta _1^0,\boldsymbol{0}\right)$
is a bijection. Then from the implicit function theorem, there exists a constant
 $\delta \gt 0$
, a neighbourhood
 $N_1$
of
 $\left(\nu _1^0,\theta _1^0,\boldsymbol{0}\right)$
and a continuously differentiable function
 \begin{equation*} \left(\nu _1^d,\theta _1^d,\boldsymbol \xi _1^d\right)\,:\,[0,\delta )\mapsto N_1 \end{equation*}
such that for any
 $d\in [0,\delta )$
, the unique solution of
 $\boldsymbol H_1(d, \nu,\theta,\boldsymbol \xi _1)=\boldsymbol{0}$
in the neighbourhood
 $N_1$
is
 $\left(\nu _1^d,\theta _1^d,\boldsymbol \xi _1^d\right)$
. Letting
 $\boldsymbol{\varphi }_1^d=\boldsymbol{\varphi }_1^0+\boldsymbol \xi _1^d$
, we see that
 \begin{equation} \textrm{span}\left(\boldsymbol{\varphi }_1^d\right)\subset \mathcal S^d_1 \;\;\text{for any}\;\; d\in [0,\delta ). \end{equation}
Since the dimension of
 $\mathcal S^d_1$
is upper semicontinuous, then there exists
 $\delta _1\lt \delta$
such that
 $\dim \mathcal S_1^d\le 1$
for any
 $d\in [0,\delta _1)$
. This, together with (3.45), implies that
 $\mathcal S^d_1=\{c\boldsymbol{\varphi }_1^d\,:\,c\in \mathbb C\}$
. By (3.39), we see that
 $\left(\nu _q^0,\theta _q^0\right)\in (0,\infty )\times (0,2\pi )$
, which yields
 $\left(\nu _q^d,\theta _q^d\right)\in (0,\infty )\times (0,2\pi )$
for
 $0\lt d\ll 1$
. This completes the part of existence.
Now we show that (3.44) holds. If it is not true, then there exist sequences
 $\{d_j\}_{j=1}^\infty$
and
 $ \{ (\nu ^{d_j},\theta ^{d_j},\boldsymbol{\varphi }^{d_j} ) \}_{j=1}^\infty$
such that
 $\lim _{j\to \infty }d_j=0$
, and for each
 $j=1,2,\cdots,$
 $ (\nu ^{d_j},\theta ^{d_j} )\ne (\nu _q^{d_j},\theta _q^{d_j})(q=1,\cdots,p)$
,
 $ \|\boldsymbol{\varphi }^{d_j} \|_2=1$
,
 $\nu ^{d_j}\gt 0$
,
 $\theta ^{d_j}\in [0,2\pi )$
, and
 \begin{equation*}\boldsymbol H\left(d_j, \nu ^{d_j},\theta ^{d_j},\boldsymbol {\varphi }^{d_j}\right)=\boldsymbol {0}.\end{equation*}
By Lemma 3.11, we see that
 $\{\nu ^{d_j}\}$
is bounded. Using similar arguments as in the proof of [Reference Chen, Shen and Wei7, Lemma 3.4], we show that there exists
 $1\le q_0\le p$
such that
 $ (\nu ^{d_j},\theta ^{d_j} )=(\nu ^{d_j}_{q_0},\theta ^{d_j}_{q_0})$
for sufficiently large
 $j$
. This is a contradiction. Therefore, (3.44) holds.
From Lemma 3.16, we obtain the following result.
Theorem 3.17.
Assume that
 $\bf (H0)$
-
 $\bf (H2)$
and (3.40) hold, and
 $d\in (0,\tilde d)$
, where
 $0\lt \tilde d\ll 1$
. Then
 $(\nu,\tau,\boldsymbol{\varphi })$
solves
 \begin{equation*} \begin {cases} \Delta (d,\textit{i}\nu,\tau )\boldsymbol {\varphi }=\boldsymbol {0},\\[4pt] \nu \gt 0,\;\tau \ge 0,\;\boldsymbol {\varphi } ({\ne} \boldsymbol {0}) \in \mathbb C^n,\\ \end {cases} \end{equation*}
if and only if there exists
 $1\le q\le p$
such that
 \begin{equation} \nu =\nu ^d_q,\;\boldsymbol{\varphi }= c{\boldsymbol{\varphi }}^d_q,\; \tau =\tau ^d_{q,l}=\frac{\theta ^d_q+2l\pi }{\nu ^d_q},\;\; l=0,1,2,\cdots, \end{equation}
where
 $\nu ^d_q$
,
 $\theta ^d_q$
, and
 ${\boldsymbol{\varphi }}^d_q$
are defined in Lemma 3.16
.
Then we show that the purely imaginary eigenvalue is simple.
Theorem 3.18.
Assume that
 $\bf (H0)$
-
 $\bf (H2)$
and (3.40) hold. Then, for each
 $d\in (0,\tilde d)$
, where
 $0\lt \tilde d\ll 1$
,
 $\mu =\textrm{i} \nu _{q}^{d}$
is a simple eigenvalue of
 $A_{\tau ^d_{q,l}}(d)$
for
 $q=1, \cdots, p$
and
 $l=0, 1, 2, \cdots .$
Proof. It follows from Theorem 3.17 that
 \begin{equation*}\mathscr {N}\left [A_{\tau ^d_{q,l}}(d)-\textrm{i} \nu _{q}^{d}\right ]=\textrm{span}\left [e^{\textrm{i} \nu _{q}^{d} \theta }\boldsymbol {\varphi }_{q}^{d} \right ],\end{equation*}
where
 $\theta \in [{-}\tau ^d_{q,l},0 ]$
, and
 $\boldsymbol{\varphi }_{q}^{d}$
is defined in Theorem 3.17. Then, we will show that
 \begin{equation*}\mathscr {N}\left [A_{\tau ^d_{q,l}}(d)-\textrm{i} \nu _{q}^{d}\right ]^{2}=\mathscr {N}\left [A_{\tau ^d_{q,l}}(d)-\textrm{i} \nu _{q}^{d}\right ].\end{equation*}
If
 $\boldsymbol \phi \in \mathscr{N} [A_{\tau ^d_{q,l}}(d)-\textrm{i} \nu _{q}^{d} ]^{2}$
, then
 \begin{equation*} \left [A_{\tau ^d_{q,l}}(d)-\textrm{i} \nu _{q}^{d}\right ]\boldsymbol \phi \in \mathscr {N}\left [A_{\tau ^d_{q,l}}(d)-\textrm{i} \nu _{q}^{d}\right ]=\textrm{span}\left [e^{\textrm{i} \nu _{q}^{d} \theta }\boldsymbol {\varphi }_{q}^{d} \right ], \end{equation*}
and consequently, there exists a constant
 $\gamma$
such that
 \begin{equation*} \left [A_{\tau ^d_{q,l}}(d)-\textrm{i} \nu _{q}^{d}\right ]\boldsymbol \phi =\gamma e^{\textrm{i} \nu _{q}^{d} \theta }\boldsymbol {\varphi }_{q}^{d}, \end{equation*}
which yields
 \begin{align} \dot{\boldsymbol \phi }(\theta ) =&\textrm{i} \nu _{q}^{d}\boldsymbol \phi (\theta )+\gamma e^{\textrm{i} \nu _{q}^{d} \theta }\boldsymbol{\varphi }_{q}^{d}, \quad \theta \in \left [{-}\tau ^d_{q,l}, 0\right ], \nonumber\\ \dot{\boldsymbol \phi }(0)=&dA\boldsymbol \phi (0)+ \textrm{diag} \!\left(f_j \left(u^d_{j},u^d_{j}\right)\right)\boldsymbol \phi (0) + \textrm{diag}\!\left(u^d_{j} a_{j}^{d}\right)\boldsymbol \phi (0)\nonumber\\ &+ \textrm{diag}\!\left(u^d_{j} b_{j}^{d}\right)\boldsymbol \phi \left({-}\tau ^d_{q,l}\right). \end{align}
From the first equation of equation (3.47), we have
 \begin{align} \boldsymbol \phi (\theta ) &=\boldsymbol \phi (0) e^{\textrm{i} \nu _{q}^{d} \theta }+\gamma \theta e^{\textrm{i} \nu _{q}^{d} \theta }\boldsymbol{\varphi }_{q}^{d}, \nonumber\\ \dot{\boldsymbol \phi }(0) &=\textrm{i} \nu _{q}^{d}\boldsymbol \phi (0)+\gamma \boldsymbol{\varphi }_{q}^{d}. \end{align}
Then it follows from equations (3.47) and (3.48) that
 \begin{align} \Delta \left(d, \textrm{i} \nu _{q}^{d}, \tau ^d_{q,l}\right)\boldsymbol \phi (0) & = dA\boldsymbol \phi (0)+ \textrm{diag} \!\left(f_j \left(u^d_{j},u^d_{j}\right)\right)\boldsymbol \phi (0) + \textrm{diag}\!\left(u^d_{j} a_{j}^{d}\right)\boldsymbol \phi (0)\nonumber\\ &\quad + e^{-\textrm{i} \theta _{q}^{d}}\textrm{diag}\!\left(u^d_{j} b_{j}^{d}\right)\boldsymbol \phi (0) - \textrm{i}\nu _{q}^{d} \boldsymbol \phi (0)\nonumber\\ &= \gamma \left(\boldsymbol{\varphi }_{q}^{d}+ \tau ^d_{q,l} e^{-\textrm{i} \theta _{q}^{d}}\textrm{diag}\!\left(u^d_{j} b_{j}^{d}\right)\boldsymbol{\varphi }_{q}^{d}\right). \end{align}
Let
 $\widetilde{\Delta } \left(d, \textrm{i}{\nu _{q}^d},{\tau }^{d}_{q,l} \right)$
be the conjugate transpose matrix of
 $\Delta (d, \textrm{i} \nu _{q}^{d}, \tau ^d_{q,l} )$
, and let
 $\widetilde{\boldsymbol{\varphi }}^d_{q}=\left(\widetilde \varphi _{q,1}^{d},\cdots, \widetilde \varphi _{q,n}^{d}\right)^T$
be the the corresponding eigenvector of
 $\widetilde{\Delta } \left(d, \textrm{i}{\nu _{q}^d},{\tau }^{d}_{q,l} \right)$
with respect to eigenvalue
 $0$
. Then, using similar arguments as in the proof of Proposition 3.7, we see that, ignoring a scalar factor,
 $\widetilde{\boldsymbol{\varphi }}^d_{q}$
satisfies
 \begin{equation} \lim _{d\to 0}\widetilde{\boldsymbol{\varphi }}^d_{q}=\boldsymbol{\varphi }^0_{q}, \end{equation}
where
 $\boldsymbol{\varphi }^0_{q}$
is defined in Lemma 3.14. Multiplying both sides of (3.49) by
 $(\overline{\widetilde \varphi }_{q,1}^{d},\cdots, \overline{\widetilde \varphi }_{q,n}^{d})$
to the left, we have
 \begin{equation*} \begin {aligned} 0 &=\left \langle \widetilde \Delta \left(d, \textrm{i} \nu _{q}^{d},\tau ^d_{q,l}\right)\widetilde {\boldsymbol {\varphi }}_{q}^{d}, \boldsymbol \phi (0)\right \rangle =\left \langle \widetilde {\boldsymbol {\varphi }}_{q}^{d}, \Delta \left({d}, \textrm{i} \nu _{q}^{d}, \tau ^d_{q,l}\right)\boldsymbol \phi (0)\right \rangle \\ & = \gamma \left(\sum _{j=1}^n\overline {\widetilde \varphi }^d_{q,j}\varphi _{q,j}^{d}+ \tau ^d_{q,l} e^{-\textrm{i} \theta _{q}^{d}} \sum _{j=1}^n u^d_{j}b_{j}^{d}\overline {\widetilde \varphi }_{q,j}^{d}\varphi ^d_{q,j}\right)\,:\!=\,\gamma S_{q}(d). \end {aligned} \end{equation*}
It follows from Lemma 3.16, Theorem 3.17 and equation (3.50) that
 \begin{equation*} \displaystyle \lim _{d\to 0}S_{q}(d)\ne 0. \end{equation*}
which implies that
 $\gamma =0$
for
 $d\in (0,\tilde d)$
, where
 $0\lt \tilde d\ll 1$
, and consequently,
 $\textrm{i}\nu _{q}^{d}$
is a simple eigenvalue of
 $A_{\tau ^d_{q,l}}(d)$
for
 $q=1, \cdots, p$
and
 $l=0, 1, 2, \cdots$
.
By Theorem 3.18 and the implicit function theorem, we see that, for each
 $q=1,\cdots,p$
and
 $l=0,1,2,\cdots$
, there exists a neighbourhood
 $O_{q,l}\times D_{q,l}\times H_{q,l}$
of
 $\left({\tau ^d_{q,l}},\textrm{i}\nu _q^{d},{\boldsymbol{\varphi }}_q^{d}\right)$
and a continuously differentiable function
 $(\mu (\tau ),\boldsymbol{\varphi }(\tau ))\,:\,O_{q,l}\rightarrow D_{q,l}\times H_{q,l}$
such that
 $ \mu \left(\tau ^d_{q,l}\right)=\textrm{i}\nu _q^d$
,
 $\boldsymbol{\varphi }\left(\tau ^d_{q,l}\right)={\boldsymbol{\varphi }}_q^d$
, and for each
 $\tau \in O_{q,l}$
, the only eigenvalue of
 $A_{\tau }(d)$
in
 $D_{q,l}$
is
 $\mu (\tau ),$
and
 \begin{equation} \begin{split} \Delta (d,\mu (\tau ),\tau )\boldsymbol{\varphi }(\tau )\,=\,&dA\boldsymbol{\varphi }(\tau )+ \textrm{diag} \!\left(f_j \left(u^d_{j},u^d_{j}\right)\right)\boldsymbol{\varphi }(\tau ) + \textrm{diag}\!\left(u^d_{j} a_{j}^{d}\right)\boldsymbol{\varphi }(\tau )\\ &+ e^{-\mu (\tau ) \tau }\textrm{diag}\!\left(u^d_{j} b_{j}^{d}\right)\boldsymbol{\varphi }(\tau ) - \mu (\tau ) \boldsymbol{\varphi }(\tau )=\boldsymbol{0}. \end{split} \end{equation}
Then, using similar arguments as Theorem 3.9, we obtain the following transversality condition.
Theorem 3.19.
Assume that
 $\bf (H0)$
-
 $\bf (H2)$
and (3.40) hold. Then
 \begin{equation*} \frac {d \mathcal {R} e\left [\mu \left(\tau ^d_{q,l}\right)\right ]}{d \tau }\gt 0, \;\; q=1,\cdots, p,\;\; l=0,1,2,\cdots. \end{equation*}
By Theorems 3.12 and 3.17– 3.19, we obtain the following result.
Theorem 3.20.
Assume that
 $\bf (H0)$
-
 $\bf (H1)$
hold, and
 $d\in (0,\tilde d)$
, where
 $0\lt \tilde d\ll 1$
. Let
 $\boldsymbol{u}^d$
be the unique positive equilibrium obtained in Lemma 2.2
. Then the following statements hold.
-
(i) If
$a_j^0-b_j^0\lt 0$
for all
$j=1,\cdots,n$
, then
$\boldsymbol{u}^d$
is locally asymptotically stable for
$\tau \in [0,\infty )$
-
(ii) If
$\bf (H2)$
and (3.43) holds, then
$\boldsymbol{u}^d$
is locally asymptotically stable for
$\tau \in \left[0, \tau ^d_{\hat q,0}\right)$
, and unstable for
$\tau \in \left( \tau ^d_{\hat q,0},\infty \right)$
, where
$\tau ^d_{\hat q,0}=\displaystyle \min _{1\le q\le p}\tau _{q,0}^d$
. Moreover, when
$\tau =\tau ^d_{\hat q,0}$
, system (1.2) undergoes a Hopf bifurcation.


4. An example
In this section, we apply the obtained results in Section 3 to a concrete example and discuss the effect of network topology on Hopf bifurcations. Choose the growth rate per capita as follows:
 \begin{equation*}f_j(u_j, u_j(t-\tau ))=m_j- \hat{a}_j u_j(t)- \hat b_j u_j(t-\tau ) \;\;\;\text {for}\;\;\; j=1, \cdots, n.\end{equation*}
Then model (1.2) takes the following form:
 \begin{equation} \begin{cases} \displaystyle \frac{d u_{j}}{d t}=d \sum _{k=1}^{n} \alpha _{jk} u_{k}+ u_j \left(m_j- \hat{a}_j u_j(t)- \hat b_j u_j(t-\tau )\right), &t\gt 0,\,\, j=1, \cdots, n,\\[14pt] \displaystyle \boldsymbol{u}(t)=\boldsymbol \psi (t) \geq \boldsymbol{0}, & t \in [{-}\tau, 0], \end{cases} \end{equation}
where
 $(\alpha _{jk})$
satisfies assumption
 $\bf (H0)$
,
 $m_j$
represents the intrinsic growth rate in patch
 $j$
and
 $\hat{a}_j,\hat b_j\gt 0$
represent the instantaneous and delayed dependence of the growth rate in patch
 $j$
, respectively. Clearly, assumption
 $\bf (H1)$
holds. We remark that the continuous space version of model (4.1) with spatially homogeneous environments has been investigated in [Reference Su, Wei and Shi38].
4.1. Stability and Hopf bifurcations
For case (I) (
 $0\lt d_*-d\ll 1$
), the quantities
 $\tilde a$
and
 $\tilde b$
take the following form:
 \begin{equation} \tilde a=-\sum _{j=1}^{n}\hat{a}_j \eta _j^2 \varsigma _j,\;\;\tilde b=-\sum _{j=1}^{n}\hat b_j \eta _j^2 \varsigma _j, \end{equation}
where
 $\boldsymbol \eta$
and
 $\boldsymbol \varsigma$
are defined in (2.1). Then, by Theorem 3.10, we obtain the following result.
Proposition 4.1.
Let
 $\boldsymbol{u}^d$
be the unique positive equilibrium of (4.1) obtained in Lemma 2.2 for
 $d\in (0,d_*)$
. Then, for
 $d \in [\tilde d_2, d_*)$
with
 $0\lt d_*-\tilde d_2 \ll 1$
, the following statements hold.
-
(i) If
$\sum _{j=1}^n \left(\hat{a}_j-\hat b_j \right)\eta _j^2 \varsigma _j\gt 0$
, then
$\boldsymbol{u}^{d}$
of model (4.1) is locally asymptotically stable for
$\tau \in [0, \infty )$
. -
(ii) If
$\sum _{j=1}^n \left(\hat{a}_j-\hat b_j \right)\eta _j^2 \varsigma _j\lt 0$
, then
$\boldsymbol{u}^{d}$
is locally asymptotically stable for
$\tau \in [0, \tau _{d,0} ),$
and unstable for
$\tau \in (\tau _{d,0}, \infty )$
, where
$\tau _{d,0}$
is defined in Theorem
3.6. Moreover, when
$\tau =\tau _{d,0},$
system (4.1) undergoes a Hopf bifurcation at
$\boldsymbol{u}^{d}$
.


Now we consider case (II) (
 $(0\lt d\ll 1$
). The quantities for this case take the following form:
 \begin{equation} a_j^0=-\hat{a}_j,\;\; b_j^0=-\hat b_j, \;\;\nu _j^0=\frac{m_j \sqrt{\left(\hat b_j\right)^2-\left(\hat{a}_j\right)^2}}{\hat{a}_j+\hat b_j}, \;\; \theta _j^0= \arccos \left({-}\frac{\hat{a}_j }{ \hat b_j }\right). \end{equation}
Moreover,
 $\bf (H2)$
is reduced as follows:
-
$(\tilde{\textbf{H}}\textbf{2})$
$\hat{a}_j-\hat b_j\lt 0$
for
$j=1,\cdots,p$
, and
$\hat{a}_j-\hat b_j\gt 0$
for
$j=p+1,\cdots,n$
, where
$1\le p\le n$
.


Then, by Theorem 3.20, we have the following result.
Proposition 4.2.
Let
 $\boldsymbol{u}^d$
be the unique positive equilibrium of (1.2) obtained in Lemma 2.2 for
 $d\in (0,d_*)$
. Then, for
 $d \in (0, \tilde d)$
with
 $0\lt \tilde d \ll 1$
, the following statements hold.
-
(i) If
$\hat{a}_j-\hat b_j\gt 0$
for all
$j=1,\cdots,n$
, then
$\boldsymbol{u}^d$
is locally asymptotically stable for
$\tau \in [0,\infty )$
. -
(ii) If
$(\tilde{\textbf{H}}\textbf{2})$
holds and
$\displaystyle \frac{\theta _j^0}{\nu _j^0}\ne \frac{\theta _k^0}{\nu _k^0}$
for any
$j\ne k$
and
$1\le j,k\le p$
, then
$\boldsymbol{u}^d$
is locally asymptotically stable for
$\tau \in \left[0, \tau ^d_{\hat q,0}\right)$
, and unstable for
$\tau \in \left( \tau ^d_{\hat q,0},\infty \right)$
, where
$\tau ^d_{\hat q,0}$
is defined in Theorem
3.20. Moreover, when
$\tau =\tau ^d_{\hat q,0}$
, system (1.2) undergoes a Hopf bifurcation at
$\boldsymbol{u}^{d}$
.


Remark 4.3. We remark that Proposition 4.2 (ii) also holds if
 $(\tilde{\textbf{H}}\textbf{2})$
is replaced by the following assumption:
-
$(\tilde{\textbf{A}}2)$
$\{\hat{a}_j-\hat b_j\}_{j=1}^n$
changes sign and
$\hat{a}_j-\hat b_j\ne 0$
for all
$j=1,\cdots,n$
.


The proof is similar, and here we omit the details for simplicity.
4.2. The effect of network topologies
In this subsection, we discuss the effect of network topologies on Hopf bifurcations values for
 $0\lt d\ll 1$
. Since the computation is tedious, we only consider a special case for simplicity. Letting
 $\hat{a}_j=0$
and
 $\hat b_j=1$
for
 $j=1,\cdots,n$
, model (4.1) is reduced to the following system:
 \begin{equation} \begin{cases} \displaystyle \frac{d u_{j}}{d t}=d \sum _{k=1}^{n} \alpha _{jk} u_{k}+ u_j \left(m_j- u_j(t-\tau )\right), &t\gt 0,\,\, j=1, \cdots, n,\\[16pt] \displaystyle \boldsymbol{u}(t)=\boldsymbol \psi (t) \geq \boldsymbol{0}, & t \in [{-}\tau, 0], \end{cases} \end{equation}
where
 $(\alpha _{jk})$
satisfies assumption
 $\bf (H0)$
, and
 $m_j\gt 0$
for
 $j=1, \cdots, n$
. Clearly,
 $\bf (H1)$
-
 $\bf (H2)$
hold. By Proposition 4.2 (ii) and a direct computation, we see that, if
 \begin{equation} m_j\ne m_k\;\;\text{for any}\;\; j\ne k, \end{equation}
then model (4.4) undergoes a Hopf bifurcation for
 $0\lt d\ll 1$
with the first Hopf bifurcation value
 $\tau =\tau ^d_{\hat q,0}$
, where
 $\hat q$
satisfies
 $m_{\hat q}=\displaystyle \max _{1\le j\le n} m_j$
. By Lemma 3.16 and Theorem 3.17, we see that
 \begin{equation} \tau ^d_{\hat q,0}=\displaystyle \frac{\theta _{\hat q}^d}{\nu _{\hat q}^d}\;\;\text{and}\;\; \lim _{d \to 0}\tau ^d_{\hat q,0}=\displaystyle \frac{\pi }{2 m_{\hat q}}. \end{equation}
Therefore, to obtain the effect of network topologies, we need to compute the first derivative of
 $\tau ^d_{\hat q,0}$
with respect to
 $d$
in the following.
Proposition 4.4.
Let
 $\tau ^d_{\hat q,0}$
be defined in (4.6), where
 $\hat q$
satisfies
 $m_{\hat q}=\max _{1\le j\le n} m_j$
. Then
 \begin{equation} \left(\tau ^d_{\hat q,0} \right)^{\prime}\big |_{d=0}=\displaystyle \frac{\mathcal T(A)}{ m^2_{\hat q}}, \end{equation}
where
 \begin{equation} \mathcal T(A)\,:\!=\,-\displaystyle \frac{\pi }{2}\alpha _{{\hat q}{\hat q}}+\left(1-\displaystyle \frac{\pi }{2}\right)\displaystyle \frac{1}{m_{\hat q}}\sum _{k\ne{\hat q}}{\alpha _{{\hat q}k}m_k}. \end{equation}
Proof. By (4.6), we have
 \begin{equation} \left({\tau ^d_{\hat q,0}}\right)^{\prime}=\displaystyle \left(\frac{\theta _{\hat q}^d}{\nu _{\hat q}^d}\right)^{\prime}=\frac{\left({\theta _{\hat q}^d}\right)^{\prime}{\nu _{\hat q}^d}-{\theta _{\hat q}^d}\left({\nu _{\hat q}^d}\right)^{\prime}}{\left({\nu _{\hat q}^d}\right)^2}, \end{equation}
where
 $^{\prime}$
is the derivative with respect to
 $d$
. Substituting
 $\nu =\nu _{\hat q}^{d}$
,
 $\theta =\theta _{\hat q}^{d}$
and
 $\boldsymbol{\varphi }=\boldsymbol{\varphi }_{\hat q}^{d}$
into (3.14), we have
 \begin{align} dA\boldsymbol{\boldsymbol{\varphi }}^d_{\hat q}+ \textrm{diag} \!\left(m_j-u^d_{j}\right){\boldsymbol{\varphi }}^d_{\hat q} - e^{-\textrm{i} \theta _{\hat q}^{d}}\textrm{diag}\!\left(u^d_{j}\right){\boldsymbol{\varphi }}^d_{\hat q} - \textrm{i}\nu _{\hat q}^{d}{\boldsymbol{\varphi }}^d_{\hat q}=\boldsymbol{0}. \end{align}
Differentiating (4.10) with respect to
 $d$
, we have
 \begin{equation} \begin{split} -\Delta \left(d, \textrm{i} \nu _{\hat q}^{d}, \tau ^d_{\hat q,0}\right)\left({\boldsymbol{\varphi }}^d_{\hat q}\right)^{\prime}=&A\boldsymbol{\boldsymbol{\varphi }}^d_{\hat q} -\textrm{diag} \!\left((u^d_{j})^{\prime}\right){\boldsymbol{\varphi }}^d_{\hat q}+\textrm{i} \left(\theta _{\hat q}^{d}\right)^{\prime}e^{-\textrm{i} \theta _{\hat q}^{d}}\textrm{diag}\!\left(u^d_{j}\right){\boldsymbol{\varphi }}^d_{\hat q} \\&-e^{-\textrm{i} \theta _{\hat q}^{d}}\textrm{diag}\!\left((u^d_{j})^{\prime}\right){\boldsymbol{\varphi }}^d_{\hat q} - \textrm{i}\left(\nu _{\hat q}^{d}\right)^{\prime}{\boldsymbol{\varphi }}^d_{\hat q}, \end{split} \end{equation}
where
 $\Delta (d,\mu,\tau )$
is defined in (3.3). Let
 $\widetilde{\boldsymbol{\varphi }}^d_{\hat q}=\left(\widetilde \varphi _{\hat q,1}^{d},\cdots, \widetilde \varphi _{\hat q,n}^{d}\right)^T$
be the corresponding eigenvector of
 $\widetilde{\Delta } (d, \textrm{i}{\nu _{\hat q}^d},{\tau }^{d}_{\hat q,0} )$
with respect to eigenvalue
 $0$
, where
 $\widetilde{\Delta } \left(d, \textrm{i}{\nu _{\hat q}^d},{\tau }^{d}_{\hat q,0} \right)$
is the conjugate transpose matrix of
 $\Delta \left(d, \textrm{i} \nu _{\hat q}^{d}, \tau ^d_{\hat q,0} \right)$
. Using similar arguments as in the proof of Proposition 3.7, we see that, ignoring a scalar factor,
 $\widetilde{\boldsymbol{\varphi }}^d_{\hat q}$
satisfies
 \begin{equation} \lim _{d\to 0}\widetilde{\boldsymbol{\varphi }}^d_{\hat q}=\boldsymbol{\varphi }^0_{\hat q}, \end{equation}
where
 $\boldsymbol{\varphi }^0_{q}$
is defined in Lemma 3.14. Note that
 \begin{equation*} 0=\left \langle \widetilde \Delta \left(d, \textrm{i} \nu _{\hat q}^{d},\tau ^d_{\hat q,0}\right)\widetilde {\boldsymbol {\varphi }}_{\hat q}^{d}, \left({\boldsymbol {\varphi }}^d_{\hat q}\right)^{\prime}\right \rangle =\left \langle \widetilde {\boldsymbol {\varphi }}_{\hat q}^{d}, \Delta \left({d}, \textrm{i} \nu _{\hat q}^{d}, \tau ^d_{\hat q,0}\right)\left({\boldsymbol {\varphi }}^d_{\hat q}\right)^{\prime}\right \rangle. \end{equation*}
Then, multiplying both sides of (4.11) by
 $(\overline{\widetilde \varphi }_{\hat q,1}^{d},\cdots, \overline{\widetilde \varphi }_{\hat q,n}^{d})$
to the left, we have
 \begin{align} 0 & =-\left \langle \widetilde{\boldsymbol{\varphi }}^d_{\hat q}, \Delta \left(d, \textrm{i} \nu _{\hat q}^{d}, \tau ^d_{\hat q,0}\right)\left({\boldsymbol{\varphi }}^d_{\hat q}\right)^{\prime} \right \rangle \nonumber\\ &= \left \langle \widetilde{\boldsymbol{\varphi }}^d_{\hat q}, A\boldsymbol{\boldsymbol{\varphi }}^d_{\hat q}\right \rangle -\left \langle \widetilde{\boldsymbol{\varphi }}^d_{\hat q},\textrm{diag} \!\left((u^d_{j})^{\prime}\right){\boldsymbol{\varphi }}^d_{\hat q}\right \rangle +\textrm{i} \left(\theta _{\hat q}^{d}\right)^{\prime}e^{-\textrm{i} \theta _{\hat q}^{d}}\left\langle \widetilde{\boldsymbol{\varphi }}^d_{\hat q},\textrm{diag}\!\left(u^d_{j}\right){\boldsymbol{\varphi }}^d_{\hat q}\right\rangle \nonumber\\ & \quad -e^{-\textrm{i} \theta _{\hat q}^{d}}\left \langle \widetilde{\boldsymbol{\varphi }}^d_{\hat q},\textrm{diag}\!\left(\left(u^d_{j}\right)^{\prime}\right){\boldsymbol{\varphi }}^d_{\hat q}\right \rangle - \textrm{i}\left(\nu _{\hat q}^{d}\right)^{\prime}\left \langle \widetilde{\boldsymbol{\varphi }}^d_{\hat q},{\boldsymbol{\varphi }}^d_{\hat q}\right \rangle. \end{align}
It follows from Lemma 2.3 that
 $\boldsymbol{u}^d$
is continuously differentiable for
 $d\in [0,d_*)$
, if we define
 $u_j^{0}=m_j$
for
 $j=1,\cdots,n$
. A direct computation yields
 \begin{equation} \left(u_{j}^d\right)^{\prime}\big |_{d=0}=\displaystyle \frac{1}{m_j}\sum _{k=1}^{n} \alpha _{jk} m_k. \end{equation}
By (4.12) and Lemma 3.16, we have
 \begin{equation} {\boldsymbol{\varphi }}^d_{\hat q},\widetilde{\boldsymbol{\varphi }}^d_{\hat q} \to{\boldsymbol{\varphi }}^0_{\hat q},\;\;\nu _{\hat q}^{d}\to m_{\hat q}, \text{and}\;\; \theta _{\hat q}^{d}\to \theta _{\hat q}^{0}=\frac{\pi }{2} \;\;\text{as}\;\; d\to 0, \end{equation}
where
 ${\boldsymbol{\varphi }}^{0}_{\hat q}$
satisfies
 $\varphi ^{0}_{{\hat q},{\hat q}}=1$
and
 $\varphi ^{0}_{{\hat q},k}=0$
for
 $k\ne{\hat q}$
. This, combined with (4.13) and (4.14), implies that
 \begin{equation} \left(\theta _{\hat q}^{d}\right)^{\prime}\big |_{d=0}=\frac{1}{m_{\hat q}^2}\sum _{k\ne{\hat q}}\alpha _{\hat q k}m_k\;\;\text{and}\;\;\left(\nu _{\hat q}^{d}\right)^{\prime}\big |_{d=0} =\displaystyle \frac{1}{m_{\hat q}}\sum _{k=1}^{n} \alpha _{{\hat q}k} m_k. \end{equation}
Substituting (4.16) into (4.9), we obtain that (4.7) holds. This completes the proof.
Therefore, for
 $0\lt d\ll 1$
and a given dispersal matrix
 $A$
, we obtain from (4.6) and (4.7) that
 \begin{equation} \tau ^d_{\hat q,0} = \displaystyle \frac{\pi }{2 m_{\hat q}}+ \displaystyle \frac{d}{ m^2_{\hat q}}\mathcal T(A)+\mathcal O(d^2), \end{equation}
where
 $\mathcal T(A)$
is defined in (4.8).
Then, by Proposition 4.4, we obtain the effect of network topologies as follows.
Proposition 4.5.
Let
 $\tau ^d_{\hat q,0} (A_i )$
be the first Hopf bifurcation of model (4.4) for
 $A=A_i$
, where
 $A_i= \left(\alpha _{jk}^{(i)} \right)$
(
 $i=1,2$
) satisfies
 $\bf (H0)$
. If
 $\mathcal T(A_1)\gt \mathcal T(A_2)$
, then there is
 $\hat d\gt 0$
, depending on
 $A_1$
and
 $A_2$
, such that
 $\tau ^d_{\hat q,0}(A_1)\gt \tau ^d_{\hat q,0}(A_2)$
for
 $d \in (0,\hat d ]$
.
Remark 4.6. We remark that if
 $\alpha _{\hat q k}^{(1)}\lt \alpha _{\hat q k}^{(2)}$
for all
 $k=1,\cdots,n$
, then
 $\mathcal T(A_1)\gt \mathcal T(A_2)$
.
By Proposition 4.4, we can also show the monotonicity of
 $\tau ^d_{\hat q,0}$
for
 $0\lt d\ll 1$
.
Proposition 4.7.
Let
 $\tau ^d_{\hat q,0}$
be the first Hopf bifurcation of model (4.4), where
 $\hat q$
satisfies
 $m_{\hat q}=\max _{1\le j\le n} m_j$
. Then the following statements hold.
-
(i) If
$\mathcal T(A)\gt 0$
, then
$ ({\tau ^d_{\hat q,0}} )^{\prime}\gt 0$
for
$0\lt d \ll 1$
. -
(ii) If
$\mathcal T(A)\lt 0$
, then
$ ({\tau ^d_{\hat q,0}} )^{\prime}\lt 0$
for
$0\lt d \ll 1$
.


Therefore, network topologies also affect the monotonicity of
 $\tau ^d_{\hat q,0}$
for
 $0\lt d\ll 1$
.
4.3. Numerical simulations
Now, we give some numerical simulations to illustrate our theoretical results for model (4.4). Let
 $n=4$
and
 $(m_j)=(7.5, 7, 6.5, 6)$
and choose the following two dispersal matrices:
 \begin{equation*} A_1=\left(\alpha _{jk}^{(1)}\right)=\left( {\begin {array}{*{20}{c}} {-1}& \quad {0.2}& \quad {0.5}& \quad {0.6}\\[4pt] {0.5}& \quad {-1.2}& \quad {0.2}& \quad {0.1}\\[4pt] {0}& \quad {0.1}& \quad {-0.9}& \quad {0.1}\\[4pt] {0}& \quad {0.1}& \quad {0.2}& \quad {-1.2} \end {array}} \right), \end{equation*}
and
 \begin{equation*}A_2=\left(\alpha _{jk}^{(2)}\right)=\left( {\begin {array}{*{20}{c}} {-2}& \quad {0.2}& \quad {0.5}& \quad {0}\\[4pt] {0.5}& \quad {-1.2}& \quad {0.2}& \quad {0.1}\\[4pt] {0}& \quad {0.1}& \quad {-0.9}& \quad {0.1}\\[4pt] {0}& \quad {0.1}& \quad {0.2}& \quad {-1.2} \end {array}} \right). \end{equation*}
Then, corresponding network topologies with respect to
 $A_1$
and
 $A_2$
are different, see Figure 2.
Two different network topologies. (Left):
 $A=A_1$
; (right):
 $A=A_2$
.

We first choose
 $A=A_1$
and numerically show that delay
 $\tau$
can induce a Hopf bifurcation, and periodic solutions can occur when
 $0\lt d\ll 1$
or
 $0\lt d_*-d\le 1$
, see Figure 3.
Periodic solutions induced by a Hopf bifurcation for model (4.4) with
 $A=A_1$
. (Left) The small dispersal case:
 $d=0.3$
and
 $\tau =0.5$
. (Right) The large dispersal case:
 $d = 10$
and
 $\tau = 1.2$
.

Then, we discuss the effects of network topologies. Clearly,
 $\hat q=1$
and
 $\mathcal T(A_1)\gt \mathcal T(A_2)$
, where
 $\mathcal T(A)$
is defined in (4.8). This, combined with Proposition 4.4, implies that
 $\tau ^d_{1,0}(A_1)\gt \tau ^d_{1,0}(A_2)$
. To confirm this, we fix
 $\tau _1({=}0.2144)$
and numerically show that the positive equilibrium of model (4.4) is stable with
 $A=A_1$
, while model (4.4) admits a positive periodic solution with
 $A=A_2$
, see Figure 4. Therefore,
 $\tau ^d_{1,0}(A_1)\gt \tau ^d_{1,0}(A_2)$
.
The effect of network topologies. We only plot two patches for simplicity. Here
 $\tau _1=0.2144$
. (Left):
 $A=A_1$
; (right):
 $A=A_2$
.

Moreover, an interesting question is whether Hopf bifurcation can occur when
 $d$
is intermediate. It is a challenge if
 $n\ge 3$
. For the two-patch model, one can compute the Hopf bifurcation value
 $\tau _{\hat q,0}^d$
for
 $d\in (0,d_*)$
, see [Reference Liao and Lou27] with a symmetric dispersal matrix. Now we consider the asymmetric case. Let
 $(m_1,m_2)=(1,2)$
and choose the following two dispersal matrices:
 \begin{equation*}A_3=\left( {\begin {array}{*{20}{c}} {-2}& \quad {1}\\[4pt] {0.9}& \quad {-1} \end {array}} \right),\;\;A_4=\left( {\begin {array}{*{20}{c}} {-20}& \quad {1}\\[4pt] {15}& \quad {-1} \end {array}} \right). \end{equation*}
For
 $A=A_i$
with
 $i=3,4$
, we numerically obtain a Hopf bifurcation curve
 $\tau _{\hat q,0}^d(A_i)$
, respectively. Here
 $\lim _{d\to 0}\tau _{\hat q,0}^d(A_i)={\pi }/{4}$
and
 $\lim _{d\to d_{*}^{(i)}}\tau _{\hat q,0}^d(A_i)=\infty$
with
 $d_{*}^{(i)}$
satisfies
 $s(d_{*}^{(i)}A_i+\textrm{diag}(m_j))=0$
for
 $i=3,4$
. By Proposition 4.7, we see that network topologies also affect the monotonicity of
 $\tau ^d_{\hat q,0}$
for
 $0\lt d\ll 1$
. As is shown in Figure 5,
 ${\tau ^d_{\hat q,0}}(A_3)$
is monotone increasing for
 $0\lt d\ll 1$
with
 $\mathcal T(A_3)=1.3139\gt 0$
, and
 ${\tau ^d_{\hat q,0}}(A_4)$
is monotone decreasing for
 $0\lt d\ll 1$
with
 $\mathcal T(A_4)= -2.7102\lt 0$
.
5. Discussion
Due to the limits of the method, we only show the existence of a Hopf bifurcation for two cases: (I)
 $0\lt d_*-d\ll 1$
and (II)
 $0\lt d\ll 1$
.
For case (I),
 $\tilde a-\tilde b$
is critical to determine the existence of a Hopf bifurcation. We remark that
 $\tilde a$
and
 $\tilde b$
are usually negative (see model (4.1) for example), where
 $-\tilde a\gt 0$
and
 $-\tilde b\gt 0$
represent the instantaneous and delayed dependence of the growth rate, respectively. Therefore,
 $\tilde a-\tilde b\lt 0$
means that the instantaneous term is dominant, and consequently, delay-induced Hopf bifurcations cannot occur;
 $\tilde a-\tilde b\gt 0$
means that the delay term is dominant, and consequently, delay-induced Hopf bifurcations can occur. By (2.7), we conjecture that
 $\boldsymbol{v}(t)$
in (3.1) can be represented as follows:
 \begin{equation} \boldsymbol{v}(t)= (d_*-d)\left [c(t)\boldsymbol \eta +(d_*-d){\boldsymbol{z}}(t)\right ],\;\;\text{where}\;\;c(t)\in \mathbb R\;\; \text{and}\;\; \boldsymbol{z}(t)\in X_1. \end{equation}
Substituting (2.7) into (3.1), we rewrite (3.1) as follows:
 \begin{equation} \begin{split} \boldsymbol{v}^{\prime}(t)=&\left [\displaystyle \frac{d}{d_*}\left(d_*A+\textrm{diag}(m_j)\right)\right ]\boldsymbol{v}(t)+(d_*-d)\textrm{diag}\!\left(\frac{m_j}{d_*}+q_j\left(d,\beta ^d,\boldsymbol \xi ^d\right)\right)\boldsymbol{v}(t)\\ &+(d_*-d)\textrm{diag}\!\left( a_j^d\beta ^d\left(\eta _j+(d_*-d)\xi _j^d\right)\right)\boldsymbol{v}(t)\\ &+(d_*-d)\textrm{diag}\!\left( b_j^d\beta ^d\left(\eta _j+(d_*-d)\xi _j^d\right)\right)\boldsymbol{v}(t-\tau ),\\ \end{split} \end{equation}
where
 $q_j(d,\beta,\boldsymbol \xi )$
and
 $a_j^{d}$
,
 $b_j^{d}$
are defined in (2.14) and (3.2), respectively. Note that
 $a_j^d=a_j$
and
 $b_j^d=b_j$
for
 $d=d_*$
, where
 $a_j$
and
 $b_j$
are defined in (2.6). Then, plugging (5.1) into (5.2) and removing higher order terms
 $\mathcal{O}(d_*-d)^2$
, we see that
 $c(t)$
satisfies
 \begin{equation} \begin{split} c^{\prime}(t)\eta _j=&\left(\displaystyle \frac{m_j}{d_*}+q_j\left(d_*,\beta ^{d_*},\boldsymbol \xi ^{d_*}\right)\right)\eta _jc(t)+\beta ^{d_*} a_j\eta ^2_jc(t)+\beta ^{d_*} b_j\eta ^2_jc(t-\tau ),\;\; j=1,2,\cdots, \end{split} \end{equation}
where
 $q_j\left(d_*,\beta ^{d_*},\boldsymbol \xi ^{d_*}\right)=\beta ^{d_*}\left(a_j+b_j\right)\eta _j$
by (2.14). Multiplying (5.3) by
 $\varsigma _j$
and summing these over all
 $j$
, we see that
 \begin{equation} \begin{split} c^{\prime}(t)\sum _{j=1}^n\varsigma _j\eta _j=&\left [\displaystyle \frac{1}{d_*}\sum _{j=1}^nm_j\varsigma _j\eta _j+\beta ^{d_*}\left(\tilde a+\tilde b\right)\right ]c(t)+\beta ^{d_*} \tilde ac(t)+\beta ^{d_*} \tilde b c(t-\tau )\\ =&\beta ^{d_*} \tilde ac(t)+\beta ^{d_*} \tilde b c(t-\tau ), \end{split} \end{equation}
where we have used (2.8) in the first step. Therefore, removing higher order terms
 $\mathcal{O}(d_*-d)^2$
, the linearized system (3.1) can be approximated by (5.4). This also explains why
 $\tilde a-\tilde b$
is crucial for the existence of a Hopf bifurcation.
The Hopf bifurcation curve. (Left):
 $A=A_3$
; (right):
 $A=A_4$
.

For case (II), we also show the existence of a Hopf bifurcation and discuss the effect of network topology on Hopf bifurcation values for a concrete model. Our method can only apply to the case of spatial heterogeneity, since it is based on the fact that
 $\mathcal S_q$
is one dimensional (see Lemma 3.16). For example, we need to impose assumption (4.5) on model (4.4) to guarantee the existence of a Hopf bifurcation. The case of spatial homogeneity awaits further investigation.
Acknowledgements
We thank two anonymous reviewers for their insightful suggestions which greatly improve the manuscript. We also thank Dr. Zuolin Shen for helpful suggestions on numerical simulations.
This work was supported by the National Natural Science Foundation of China (Nos. 12171117, 11771109) and Shandong Provincial Natural Science Foundation of China (No. ZR2020YQ01).
Conflict of interest
There are no conflicts of interest.