


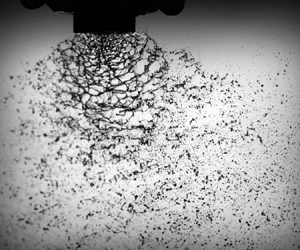



1. Introduction
The droplet size distribution produced in sprays is of crucial importance for many spray applications, such as drug delivery and agriculture. In drug delivery, inhaled drops of 1– $5\ \mathrm {\mu }$m reach and deposit well into the lungs, while larger particles generally deposit in the upper airways and smaller droplets evaporate before deposition or are exhaled (Usmani Reference Usmani2015; El Baou et al. Reference El Baou, Di Santostefano, Alfonso-Cristancho, Suarez, Stempel, Everard and Barnes2017). For agricultural pesticide spraying, drops need to be small for good coverage (Lake Reference Lake1977), while the smallest drops (
 ${\lesssim }100\ \mathrm {\mu }$m) are prone to airborne drift and pollute the environment (Stainier et al. Reference Stainier, Destain, Schiffers and Lebeau2006; Matthews Reference Matthews2007; Reichenberger et al. Reference Reichenberger, Bach, Skitschak and Frede2007). The breakup mechanisms that govern the formation of droplets from liquid jets (Lin & Reitz Reference Lin and Reitz1998; Lefebvre & McDonell Reference Lefebvre and McDonell2017; Villermaux Reference Villermaux2020) and sheets (Squire Reference Squire1953; Dombrowski & Fraser Reference Dombrowski and Fraser1954; Dombrowski & Johns Reference Dombrowski and Johns1963; Fraser, Dombrowski & Routley Reference Fraser, Dombrowski and Routley1963; Villermaux & Clanet Reference Villermaux and Clanet2002; Villermaux Reference Villermaux2020) have therefore been studied intensively.
Understanding the breakup mechanisms in sprays has paved the way for the development of different drift-reducing techniques for agricultural ground sprayers to control the potential toxicity of pesticides on the environment. Many pesticides, however, are aerially applied by planes and helicopters. The National Agricultural Aviation Association (NAAA) (2019) estimated 28 % of the 347 million acres of cropland in the United States to be treated by aerial application. A major downside of aerial spraying is the relatively large amount of drift produced and the lack of drift-reducing techniques for spraying at high wind speeds.
In a recent study, Kooij et al. (Reference Kooij, Sijs, Denn, Villermaux and Bonn2018) proposed a universal description of the droplet size distribution for sprays of Newtonian liquids obtained from flat fan nozzles in the absence of external wind. The fragmentation of the spray sheet is initiated by the growth of out-of-plane waves along the sheet due to friction with the surrounding air (Squire Reference Squire1953). This leads to the formation of ligaments which subsequently break up into droplets due to surface tension (Rayleigh Reference Rayleigh1878). However, one can expect that the formation of droplets in the case of aerial spraying is very different, yet the effect of high wind speeds on the breakup mechanism has not been investigated to date.
In this study, we examine how an external airflow influences the droplet formation in sprays and observe two distinct breakup mechanisms; the formation of bag-like liquid structures, followed by the subsequent disintegration of the remaining perforated spray sheet (figure 1b). These two different breakup mechanisms directly impact the droplet size distribution, which differs strongly from spraying without wind. In § 3.2, we discuss how the continuously incoming airflow triggers the Rayleigh–Taylor instability, causing thickness modulation to grow. The thinner portions of the sheet enable the formation of liquid bags, which are considered in § 3.3. Based on these fragmentation mechanisms, a probability function is established in § 3.4. By fitting the probability function to the measured droplet size distributions, the average droplet size from bag breakup  $d_1$, the average drop size from the perforated sheet breakup
 $d_2$ and the volume fraction of bag breakup droplets
 $f$ are extracted, which are examined in §§ 3.6, 3.5 and 3.7, respectively.
(a) Schematic representation of the experimental set-up. For the images illustrated in figures 2(a,c) and 4, the camera was rotated by a  $45^\circ$ angle in the direction of the leaf blower. (b) Close-up of the spray, illustrating the two distinct droplet generating mechanisms; bag breakup and sheet breakup. (c) Side view of the spray sheet, highlighting the onset of the Rayleigh–Taylor instability which facilitates the formation of liquid bags.

2. Methods
To imitate the high wind speeds in aerial spraying, an electrical leaf blower was mounted 30 cm in front of the nozzle. In all experiments, the airflow was aligned perpendicular to the sprayed sheet (see figure 1a). High-speed images were captured in high definition with a Phantom TMX7510 at 76 000 frames per second, as to capture the spray dynamics at short time scales (see example images in figure 2). To characterise the small droplets from bag breakup (§ 3.3), a Nikon D850 camera with an 8 K resolution ( ${\approx }5\ \mathrm {\mu }$m px
 $^{-1}$) was used.
Pictures of the same (TJ110-06) flat fan nozzle for spraying (a,b) without and (c,d) with external airflow ( $U_{{air}} = 40$ m s
 $^{-1}$). As a result of the wind, droplets are blown out of the sprayed plane, and the sheet fragments faster. Panels (a,c) were captured at a
 $45^\circ$ angle with respect to the sprayed sheet, and panels (b,d) were captured parallel to the sheet.

The examined air velocities were measured at the nozzle using a Pitot tube (Voltcraft VPT-100). Using a Variac variable autotransformer, the air velocity could be continuously varied between 20 and 54 m s $^{-1}$. Five different flat fan nozzles were used at an operating pressure of 2.0 bar. The most important difference between these nozzles is the hydraulic area
 $A_{{hyd}}$, which is the area of the elliptical opening after accounting for entry losses. For the flat fan nozzles used here, entry losses are small and the hydraulic area is close to the actual nozzle area (for more information, see Appendix A.1). Spraying water at a pressure of 2.0 bar resulted in a constant liquid velocity of
 $V_{{liq}} = 20$ m s
 $^{-1}$ for all nozzles. See table 1 for an overview of the nozzles and their characteristics.
Overview of the nozzles and their characteristics. The hydraulic area  $A_{{hyd}}$ is the area of the elliptical nozzle opening and
 $b_{{hyd}}$ is the minor axis of the ellipse, both accounted for entry losses. The spray volume contained in droplets smaller than
 $100\ \mathrm {\mu }$m,
 $V_{<100}$ is provided for spraying without and with external airflow.

Droplet size distributions were obtained using a laser light scattering method (Spraytec, Malvern Panalytical). The diffraction pattern of an expanded laser beam passing through the spray was measured with a two-dimensional charge-coupled device. The diffraction angle is inversely proportional to the droplet size, and the complete drop size distribution was determined using the diffraction pattern and Mie theory (Swithenbank et al. Reference Swithenbank, Beer, Taylor, Abbot and McCreath1976; Dayal, Shaik & Singh Reference Dayal, Shaik and Singh2004). All reported droplet size distributions in this paper were volume weighted.
Since larger droplets are less affected by the wind than small droplets, the laser beam was placed under a  $60^\circ$ angle with respect to the horizontal, as to measure the full droplet size distribution without the optics getting wet. This way, the laser beam was located 20 cm away from the nozzle, where it was verified using high-speed imaging that the sheet was fully fragmented into droplets (see figure 2).
3. Results and discussion
3.1. Droplet size distributions
The environmental impact from aerial pesticide application becomes immediately clear from the droplet size distributions for different air velocities (figure 3a). For all non-zero air velocities, the volume fraction of small droplets is greatly increased in comparison with the same spray nozzle without external wind. A parameter commonly used in the literature to cover airborne drift is the volume percentage  $V_{<100}$ contained in droplets with a diameter smaller than
 $100\ \mathrm {\mu }$m. Table 1 depicts the
 $V_{<100}$ values for spraying without wind and with a 40 m s
 $^{-1}$ air velocity. Depending on the nozzle,
 $V_{<100}$ is increased by a factor of 3–5 for spraying with an external airflow, meaning that a large portion of the spray volume is prone to airborne drift.
Droplet size distributions for (a) different air velocities (using the TJ65-10 nozzle) and (b) different nozzles (with  $U_{{air}} = 40$ m s
 $^{-1}$).

The distributions for non-zero air velocities measured here have two peaks, characteristic of atomisation processes with two distinct drop generation mechanisms (Villermaux & Bossa Reference Villermaux and Bossa2011). All distributions in figure 3 show a similar peak for small  ${\approx }80\ \mathrm {\mu }$m droplets, independent of the air velocity and spray nozzle. The peak at large droplets does depend on the nozzle and air velocity, and shifts to larger droplet sizes when the hydraulic nozzle area is increased or the air velocity is decreased. For spraying without wind, Kooij et al. (Reference Kooij, Sijs, Denn, Villermaux and Bonn2018) found that the sheet fragments into droplets due to a Squire instability and that the droplet size distributions can be characterised by the single average droplet size resulting from this breakup mechanism. The average droplet size was shown to increase linearly with the hydraulic nozzle area, a trend which is qualitatively similar to the peak at large droplets when spraying with external airflow. The double peaked distributions in our experiments illustrate that the fragmentation of the spray sheet is fundamentally different for spraying with external airflow.
3.2. Sheet breakup with wind
We now consider the instabilities that drive the fragmentation of the sprayed sheet. Due to the incoming airflow, the sheet is accelerated perpendicularly to its plane. The acceleration of a liquid sheet between two lighter media ( $\rho _{{air}} / \rho _{{liq}} \approx 10^{-3}$) is unstable due to the Rayleigh–Taylor instability, first analysed with the effect of surface tension incorporated by Keller & Kolodner (Reference Keller and Kolodner1954). The constant acceleration causes initial perturbations in the liquid sheet (visible close to the nozzle in figure 2a,c) to grow indefinitely with time. More recently, Bremond & Villermaux (Reference Bremond and Villermaux2005) pointed out that the destabilisation is slowed down significantly for liquid sheets much thinner than the capillary length. They showed that the maximum growth rate and the selected wavenumber depend on the value of the non-dimensionalised capillary wavenumber,
 \begin{equation} \tilde{k}_c = k_c h = \sqrt{\frac{\rho_{{liq}} a h^2}{\sigma}}, \end{equation}
where  $a$ is the acceleration of the sheet,
 $h$ the sheet thickness and
 $\sigma$ the liquid surface tension. In the thin sheet limit (
 $\tilde {k}_c \ll 1$), the fastest growing wavenumber was shown to be
 $k_m = k_c^2 h /2$, whereas in the limit
 $\tilde {k}_c \gg 1$, the selected wavenumber is
 $k_m = k_c/\sqrt {3}$ as originally derived by Keller & Kolodner (Reference Keller and Kolodner1954).
The pressure of the external airflow is at the source of the acceleration and, following the analyses of Engel (Reference Engel1958) and Villermaux & Bossa (Reference Villermaux and Bossa2009), is given by
 \begin{equation} a = \frac{\rho_{{air}}U_{{air}}^2}{\rho_{{liq}}h}, \end{equation}
with  $U_{{air}}$ the velocity of the incoming airflow.
The sheet thickness  $h$ in our experiments is initially given by the size of the minor axis of the elliptical opening after accounting for entry losses (i.e.
 $h = b_{{hyd}}$, see table 1 and Appendix A.1 for more information). Combining this initial thickness with the expression for the acceleration, the value of
 $\tilde {k}_c$ on the scale of the sheet can be calculated. For the smallest value of
 $\tilde {k}_c$ in our experiments (corresponding to
 $U_{{air}} = 20$ m s
 $^{-1}$ and
 $h = 0.56$ mm), we find
 $\tilde {k}_c \gtrsim 1$. Therefore, we can use the
 $\tilde {k}_c \gg 1$ limit in all our experiments, which results in the following expression for the fastest growing wavenumber:
 \begin{equation} k_m = \sqrt{\frac{\rho_{{air}} U_{{air}}^2}{3\sigma h}} = \frac{1}{\sqrt{3}} h^{-1} We_{{air}}^{1/2}, \end{equation}
which has been rewritten in terms of the Weber number of the air  $We_{{air}} = \rho _{{air}} U_{{air}}^2 h /\sigma$. The same thick sheet limit (
 $\tilde {k}_c \gg 1$) of the Rayleigh–Taylor instability has previously been shown to correctly predict the wavelength (3.3) of liquid jets when accelerated by a perpendicular airflow (Sallam, Aalburg & Faeth Reference Sallam, Aalburg and Faeth2004; Eggers & Villermaux Reference Eggers and Villermaux2008).
Initial thickness perturbations in the sprayed sheet grow due to the perpendicular acceleration by the airflow, and the sheet ruptures when the amplitude of thickness modulations reach the size of the sheet thickness. According to Keller & Kolodner (Reference Keller and Kolodner1954), this gives for the breakup time
 \begin{equation} \tau = \left(\frac{27\sigma}{4\rho_{{liq}} a^3}\right)^{1/4} \log \frac{h}{A}, \end{equation}
where  $A$ is the initial perturbation of the surface. The initial perturbation is visible as irregularities in the sheet close to the nozzle opening, as seen in figure 4. Based on these and similar images, the initial perturbation was roughly approximated to be of the order of
 ${\sim }100\ \mathrm {\mu }$m for all nozzles and air velocities. This is smaller than, but of the order of, the sheet thickness and hence
 $\log h/A \approx 1$. The breakup distance is therefore given by
 \begin{equation} L = V_{{liq}} \tau = h We^{-3/4}_{{air}} We^{1/2}_{{liq}} (27/4)^{1/4}, \end{equation}
where  $V_{{liq}}$ is the velocity of the liquid and
 $We_{{liq}} = \rho _{{liq}} V_{{liq}}^2 h /\sigma$ is the Weber number of the liquid.
Images of the sprayed sheet from a TJ110-06 nozzle for (a)  $v_{air} = 20$ m s
 $^{-1}$ and (b)
 $v_{air} = 40$ m s
 $^{-1}$, captured at a
 $45^\circ$ angle with respect to the sheet. The insets show the determined contour of holes that emerge due to the incoming airflow. The contour was used to experimentally determine the holesize
 $R$ (figure 5b) and the point where the holes emerge define the breakup length
 $L$ (figure 5a).

As it ruptures, holes emerge in the sprayed sheet, and the breakup length was defined as the distance from the point where these holes emerged to the nozzle (see Appendix A.2 for more information). The breakup length was experimentally determined from high-speed images (figure 4) by measuring the distance between the formed holes (annotated in the insets of figure 4) and the nozzle. Figure 5(a) shows that the prediction from (3.5) agrees well with the experimental breakup length.


The holesize itself is determined by the fastest growing wavenumber (3.3) and is given by (Keller & Kolodner Reference Keller and Kolodner1954)
 \begin{equation} R = \sqrt{2{\rm \pi}}k_m^{-1} = h We_{{air}}^{-1/2} (6{\rm \pi})^{1/2}. \end{equation}
Since the sprayed sheet expands, the holesize increases with the distance from the nozzle until the sheet eventually disintegrates into droplets. The size of the holes was therefore measured at the breakup length, where the holes first emerged. This was done by first thresholding and then skeletonising the high-speed images, after which the holesize was determined below the centre of the nozzle. Figure 4 illustrates an example of the holesize for an air velocity of 20 m s $^{-1}$ in panel (a) and 40 m s
 $^{-1}$ in panel (b), where the inset depicts the determined contour points. The reported holesize is an average of at least 200 images (with one holesize per image), and is shown in figure 5(b). The experimentally determined size of the holes agrees well with the theoretical prediction from (3.6).
3.3. Bag breakup mechanism
For spraying with external airflow, droplet formation close to the nozzle can be observed (figure 2d). By examining high-speed images, the liquid sheet is observed to locally inflate due to the continuously incoming airflow. This is facilitated by the growing thickness modulations, where the thinner parts of the sheet are inflated by the airflow. As a result, bag-like structures are observed downwind of the spray. The liquid bags grow until they rupture and fragment into many small droplets, creating the previously discussed holes in the spray sheet. This breakup mechanism, often referred to as bag breakup (Lane Reference Lane1951; Hinze Reference Hinze1955; Jalaal & Mehravaran Reference Jalaal and Mehravaran2012; Asgarian et al. Reference Asgarian, Heinrich, Schwarze, Bussmann and Chattopadhyay2020; Jackiw & Ashgriz Reference Jackiw and Ashgriz2021), is common for droplets in an airflow and, for example, determines the size distribution of raindrops (Villermaux & Bossa Reference Villermaux and Bossa2009). Figure 6 shows a bag breakup event for a relatively low air velocity and large initial sheet thickness.
Snapshots of the formation and consecutive fragmentation of a liquid bag. The airflow is coming from the left, creating a bag-like structure on the right of the spray sheet. A relatively large (TJ65-10) nozzle is shown at a relatively low air velocity ( $U_{{air}} = 20$ m s
 $^{-1}$) to capture the dynamics of a single bag breakup event.

The droplets created by the bursting bag in figure 6 have an average size of order  $100\ \mathrm {\mu }$m. This suggests the bag breakup mechanism to be responsible for the small droplets in the drop size distributions (figure 3) for spraying with external airflow. To test this hypothesis, high-resolution images (figure 7a) were taken close to the nozzle opening where the bag breakup occurs. Using automated image analysis, the droplet sizes were determined after filtering non-circular droplets and out of focus droplets from the images. An example image is shown in figure 7(a), where the inset depicts the analysed droplets in this region. Every pixel in the image represents a length of
 $4.3\ \mathrm {\mu }$m. The droplet size distribution shown in figure 7(b) is based on more than 80 000 droplets analysed in over 250 images. Droplets generated by other breakup mechanisms, such as sheet fragmentation and secondary breakup of large droplets, occur only beyond the breakup distance
 $L$ (3.5) below the nozzle. We verified that these droplets have a negligible effect on the droplet size distribution by including only droplets located within the breakup distance
 $L$ from the nozzle. Consequently, figure 7(b) depicts the size distribution of droplets produced exclusively by bag breakup.
(a) Example image captured close to the spray nozzle, depicting droplets created by bag breakup. The inset shows the determined droplet sizes. By measuring the droplets in multiple images, the droplet size distribution in panel (b) from only bag breakup was determined. The solid line shows the bag breakup droplets rescaled with the experimental average droplet size  $\langle d \rangle$ to be gamma distributed with parameter
 $n=4$.

Having identified an additional breakup mechanism for spraying with external airflow, we can compare the droplets generated by bag breakup with the full droplet size distributions (figure 3). An additional peak in all distributions was observed for spraying with external wind, and the measured distribution from only bag breakup droplets (figure 7b) matches well with these peaks. It can therefore be concluded that the small droplets that emerge when spraying with an external airflow originate from the formation and consecutive breakup of bags.
Figure 6 shows that as the bags rupture, the thin liquid film quickly retracts to form ligaments which fragment into droplets. Fragmentation processes where droplet generation is mediated by ligaments are known to produce gamma distributed droplet sizes, where the broadness of the distribution is governed by the corrugation of the ligaments (Villermaux Reference Villermaux2020). By examination of high-speed images of the bag breakup process, the ligaments are observed to be strongly corrugated (meaning that the size fluctuations along the cross-section of the ligament are of the order of its mean radius). For such corrugated ligaments, the produced droplets are known to be gamma distributed with parameter  $n=4$ (Villermaux & Bossa Reference Villermaux and Bossa2011), i.e.
 \begin{equation} \mathcal{P}_{{bag}} = \varGamma_{n=4}(x=d/d_1) = \frac{n^n}{\varGamma(n)}x^{n-1}\ {\rm e}^{-nx}, \end{equation}
where  $d_1$ is the average droplet size from bag breakup. The theoretically predicted gamma distribution with
 $n=4$ was rescaled with the experimentally determined average droplet size to match the experimental data. The resulting distribution demonstrates very good agreement with experiments (solid line in figure 7b).
3.4. Fitting the droplet size distributions
So far, we have discussed that the sheet destabilises due to the Rayleigh–Taylor instability, as it is accelerated by the incoming airflow. The thinner portions of the sheet form bags, which quickly expand and rupture, creating holes in the remaining sheet. A schematic representation of the sheet fragmentation for spraying with external airflow is illustrated in figure 8.
(a) Schematic representation of the sheet breakup for spraying with an external airflow. (b) Formation of bags and holes in the sheet, both characterised by the same radius. The average droplet size from bag breakup ( $d_1$) and sheet breakup (
 $d_2$) are derived from volume conservation arguments (see §§ 3.6 and 3.5, respectively). (c) Fraction
 $f$ of the total spray volume is contained in droplets originating from fragmenting bags and the remaining volume fraction (
 $1-f$) originates from sheet breakup.

In § 3.3, it has been shown that the relatively small droplets generated by bag breakup are gamma distributed with parameter  $n=4$ (3.7) and that the measured droplet size distribution from bag breakup is well fit when rescaled with the experimentally determined average droplet size
 $d_1$ (figure 7b). The remaining sheet with holes forms a network of interconnected ligaments (figure 2c), which breaks up and creates the relatively large droplets in the droplet size distributions (figure 3). Kooij et al. (Reference Kooij, Sijs, Denn, Villermaux and Bonn2018) showed that without external airflow, the flat fan nozzles used in our experiments produce droplets that can be described by a two-parameter (
 $m,n$) compound gamma function. The compound function comes from the fact that the droplets produced by a single ligament are gamma distributed (similar to the bag break-up mechanism), but the sizes of the ligaments themselves are also gamma distributed. The elliptical nozzle opening creates a sheet with a non-uniform thickness, which produces ligaments that vary strongly in size. As a result, Kooij et al. (Reference Kooij, Sijs, Denn, Villermaux and Bonn2018) showed both the ligament sizes and the ligament corrugations to be almost maximally distributed (i.e.
 $m,n \approx 4$).
Although the mechanism that breaks up the sheet without external airflow is different from the Rayleigh–Taylor instability discussed here, we assume the droplets generated by the fragmenting sheet with holes to be similarly distributed, such that
 \begin{equation} \mathcal{P}_{{sheet}} = \mathcal{P}_{m,n\approx4}(x = d/d_2) = \frac{2(mn)^{{(m+n)}/{2}}x^{{(m+n)}/{2}-1}}{\varGamma(m)\varGamma(n)}\mathcal{K}_{m-n}(2\sqrt{mnx}), \end{equation}
where  $d_2$ is the average droplet size from the remaining sheet breakup and
 $\mathcal {K}$ is the modified Bessel function of the second kind (from Villermaux & Bossa (Reference Villermaux and Bossa2011). For more details on sheet breakup without wind, see Kooij et al. Reference Kooij, Sijs, Denn, Villermaux and Bonn2018). This is a realistic assumption since in our experiments, the ligaments in the sheet show large corrugations and nozzles with a similar elliptical opening are used.
The droplets created when spraying with an external airflow originate from two distinct mechanisms; bag breakup (3.7) and breakup of the remaining sheet (3.8). As explained by Villermaux & Bossa (Reference Villermaux and Bossa2011), the full droplet size distribution can therefore be described by a linear superposition of the two gamma distributions
 \begin{equation} \mathcal{P}(d, d_1, d_2, f) = f \cdot \mathcal{P}_{{bag}}(d/d_1) + (1-f) \cdot\mathcal{P}_{{sheet}}(d/d_2), \end{equation}
where  $f$ is the volume fraction of the bag breakup droplets.
We can now use the derived probability density function to fit the experimental droplet size distributions, using  $f$,
 $d_1$ and
 $d_2$ as fit parameters. As illustrated in figure 9, the fit agrees well with the measured droplet size distributions. For experiments with airflow, the laser light scattering method does not give reproducible results for droplets
 $d \lessapprox 25\ \mathrm {\mu }$m, and these droplets are therefore not shown here for readability. The
 $d \lessapprox 25\ \mathrm {\mu }$m droplets typically account for
 ${<}1\,\%$ of the overall distribution, resulting in a negligible effect on the fits.
Examples of droplet size distributions fit with (3.9). Panel (b) is a zoom of panel (a) to illustrate the fit for small droplets. Data for  $d \lessapprox 25\ \mathrm {\mu }$m are not shown for readability.

By fitting the experimental distributions, we can extract the average droplet size from bag breakup ( $d_1$), the average droplet size from the remaining sheet breakup (
 $d_2$) and fraction of bag breakup droplets (
 $\,f$) from the measurements. In the next sections, we will compare these characteristic experimental values with predictions based on the observed fragmentation mechanisms.
3.5. Droplets from sheet breakup
In this section, the average droplet size from sheet breakup is considered. Figure 10(a) shows the experimental results as a function of the velocity of the external airflow. The downward trend for all flat fan nozzles illustrates that the droplets become smaller as the air velocity is increased. For comparison, the average droplet size for spraying without external wind is also shown. Without wind, there is no bag breakup that generates small droplets and the sheet fragments due to the Squire instability, as explained by Kooij et al. (Reference Kooij, Sijs, Denn, Villermaux and Bonn2018). The fact that the average droplet size without wind is smaller than most measurements with non-zero air velocities is another indicator that the sheet breakup mechanism is fundamentally different with an external airflow.
(a) Average droplet size from sheet breakup as a function of the external air velocity. The values for  $U_{{air}} = 0$ m s
 $^{-1}$ were determined from the full spray and for the non-zero air velocities, (3.9) was fit to the experimental data. The dashed line indicates the critical Weber number above which the secondary breakup of droplets likely to occur. (b) Average droplet size from sheet breakup as a function of the theoretically predicted droplet size (3.11). The dashed line indicates the line
 $y=x$.

For the larger nozzles, a relatively large jump in the average droplet size is visible when the air velocity is increased from 40 to 47 m s $^{-1}$. The reason for this is the secondary breakup of large droplets, which was verified using high-speed videos. When a droplet is subject to a high enough airflow, it can deform and fragment into many smaller droplets, a phenomenon called secondary breakup. The deformation and subsequent fragmentation of droplets in an airflow is well studied and occurs when the critical Weber number
 $We_{{crit}} = \rho _{{air}}v_{{air}}^2 d /\sigma$ (with
 $d$ the drop diameter) is larger than
 $11 \pm 2$ (Lane Reference Lane1951; Hinze Reference Hinze1955; Pilch & Erdman Reference Pilch and Erdman1987; Zhao et al. Reference Zhao, Liu, Li and Xu2010; Jain et al. Reference Jain, Tyagi, Prakash, Ravikrishna and Tomar2019). The dashed line in figure 10(a) depicts this critical Weber number. It shows that for the experiments with the largest air velocities, secondary breakup is likely to occur. However, no strong conclusions on the significance of the effect can be drawn; figure 10(a) only depicts the average droplet size, while the full droplet size distribution consists of a large variety of droplet sizes. This implies that secondary breakup could play a significant role, even when the average droplet size does not exceed the critical Weber number. However, the sheet has gained a velocity component in the direction of the airflow by the time it has fragmented into droplets. The relative velocity between the droplets and the wind is therefore smaller, which opposes the likelihood of secondary breakup.
We will now establish a measure for the average droplet size  $d_2$ from fragmentation of the sheet with holes. Since the droplets are formed at breakup length
 $L$ (3.5) away from the nozzle, the thinning of the sheet due to the expanding motion must be taken into account. The sheet thickness
 $h_L$ at the breakup length is thus smaller than the initial sheet thickness
 $h$ and
 $h_L \sim h / L$ (see Appendix A.3 for details).
The destabilised sheet with holes forms a network of interconnected circular ligaments (radius  $R$) with thickness
 $d_l$, but before destabilisation, every hole was a cylindrical piece of sheet with the same radius
 $R$ and sheet thickness
 $h_L$. Given the honeycomb-like structure of the network of ligaments (neglecting the boundary of the sheet, every ligament is formed by two cylindrical pieces), volume conservation gives for the ligament thickness
 \begin{equation} d_l = 2 \sqrt{\frac{R h_L}{\rm \pi}}. \end{equation}
Note that in assuming that the volume is conserved, we neglect the fact that part of the spray is blown away by bag breakup. The correction on the ligament thickness is however rather small (from experiments, see figure 12(a),  $[1-f]^{1/2} \approx 0.9$ on average), and therefore (3.10) is a valid approximation for the ligament thickness.
The fragmentation of the ligaments into droplets is mediated by surface tension and the droplets are created from the ligaments at time scale  $t_c = (\rho _{{liq}}d_l^3 /\sigma )^{1/2}$. During this capillary breakup time, the ligaments are stretched as a result of the expanding motion of the sprayed liquid. The stretching occurs over a distance
 $l_c = t_c \cdot v_{{liq}}$ and thins the ligament diameter with a factor of
 $f_{{thinning}} = (w_L / w_{L+l_c})^{1/2}$, with
 $w_{L+l_c}$ the sheet width at distance
 $L+l_c$. The thinned ligaments fragment into droplets with a size of typically two times the ligament diameter (Lhuissier & Villermaux Reference Lhuissier and Villermaux2013; Vledouts et al. Reference Vledouts, Quinard, Vandenberghe and Villermaux2016), which gives for the average droplet size from sheet breakup
 \begin{equation} d_2 = f_{{thinning}} (Rh_L)^{1/2} (16/{\rm \pi})^{1/2}. \end{equation}
In figure 10(b), this theoretical prediction is shown to agree well with the experimentally determined droplet sizes. The overprediction for measurements at large air velocities is probably due to the secondary breakup of droplets, as these average droplet sizes are in the  $We_{{crit}} \gtrsim 11$ regime (see figure 10a).
3.6. Droplets from bag breakup
In § 3.3, it was discussed that the small droplets observed when spraying with an external airflow (see figure 3) are created by the breakup of bags. Here, we derive a prediction for the droplet size ( $d_1$) resulting from the bag breakup mechanism.
We start by taking a closer look at the inflating bags. In § 3.2, the Rayleigh–Taylor instability of the accelerated sheet was shown to successfully predict the breakup length (the distance from the nozzle where bags are formed, see (3.5)) using the breakup time. The formation and consecutive breakup of bags causes the emergence of holes in the sheet, where the holesize was predicted by (3.6). The bags are created as the liquid sheet is being accelerated until the bags rupture at the breakup time. The final length of the bags is therefore given by
 \begin{equation} l_{{bag}} = a \tau^2 = \sqrt{\frac{27\sigma h}{4\rho_{{air}}U^2}} = h {We}^{-1/2}_{{air}} (27/4)^{1/2}, \end{equation}
where the earlier derived expressions of the acceleration  $a$ (3.2) and breakup time
 $\tau$ (3.4) were combined.
Experimentally determining the final bag length is challenging due to the large number of bags being formed in a small area, making it difficult to distinguish individual bags from images. To obtain a reproducible length, the largest bag was measured in multiple short 2 ms (157 frames) videos. Figure 11(a) illustrates the scaling of the experimental bag length to agree well with the prediction given in (3.12). The overprediction with a factor of 6.5 is not surprising, since the length reported corresponds to the largest bags observed. The inset shows how the length of the bag illustrated in figure 6 increases with time, with  $t=0$ at the instance where the liquid particles corresponding to the bag came out of the nozzle. The solid line shows that the bags indeed grow as
 $\xi = at^2$.
(a) Maximum length of the liquid bags determined from short high-speed videos as a function of the predicted bag length from (3.12). The solid line is a linear fit. The inset shows the bag from figure 6 to grow quadratically in time. (b) Average droplet size from bag breakup as a function of droplet size predicted by (3.15). The prediction overestimates the actual droplet size as the volume fraction of bag breakup droplets is not taken into account (compare with figure 12b).

The bags grow quadratic in time, with an acceleration resulting from the pressure of the external airflow. Since bags are liquid sheets, their inflation is inherently unstable as a result of the Rayleigh–Taylor instability, similar to the instability that destabilises the sprayed sheet itself. We therefore follow the lines of the analysis from § 3.2, where it has been discussed that the fastest growing wavenumber in the destabilising sheet depends on the value of the non-dimensionalised capillary wavenumber (3.1). Since we now consider the destabilisation and the consecutive breakup of the bag, it is the thickness of the bag that governs the destabilisation. Although this thickness is unknown in our experiments, it is much smaller than the initial thickness of the spray and we can use the thin sheet limit ( $\tilde {k}_c \ll 1$) for the fastest growing wavenumber
 \begin{equation} k_m = k_c^2 h /2 = \frac{\rho_{{air}}U^2}{2\sigma}. \end{equation}
To find an expression for the bag thickness, we use that cylindrical pieces of sheet (radius  $R$, thickness
 $h_L$ form approximately cylindrical bags (radius
 $R$, length
 $l_{{bag}}$, thickness
 $h_{{bag}}$). Volume conservation now gives
 \begin{equation} h_{{bag}} = \frac{R h_L}{2l_{{bag}}} = h_L (6{\rm \pi} / 27)^{1/2}, \end{equation}
where we used the previously derived expressions for the holesize  $R$ (3.6) and bag length
 $l_{{bag}}$ (3.12), and
 $h_L$ is the spray sheet thickness at the point where the bags are created. Note that in using the volume conservation argument above, we assume that all of the liquid contained in a cylindrical piece of sheet is transferred into the bag. However, as discussed in the derivation of the droplet size from sheet breakup (§ 3.5), most of the liquid remains in the sheet after bag formation and the actual bag thickness is therefore much smaller than (3.14) predicts. For now, this expression is used as an approximation for the bag thickness and in the next section (§ 3.7), we correct this expression using the experimentally determined volume fraction of bag breakup droplets.
Using volume conservation and the fact that ligaments fragment into droplets of approximately two times the ligament diameter (Lhuissier & Villermaux Reference Lhuissier and Villermaux2013; Vledouts et al. Reference Vledouts, Quinard, Vandenberghe and Villermaux2016), the average droplet size from bag breakup is given by
 \begin{equation} d_1 = 4 \sqrt{\frac{k_m^{-1}h_{{bag}}}{(2{\rm \pi})^{1/2}}} = h_L We_{{air}}^{-1/2} (32/3)^{1/2}, \end{equation}
where the Weber number of the air is defined using the sheet thickness  $h_L$.
Figure 11(b) compares the derived expression with the measured average droplet size from bag breakup. The experimental droplet size remains approximately constant for all examined air velocities and nozzles, which is not in accordance with (3.15). The reason for this mismatch partially lies in the expression for the bag thickness using volume conservation. In the next section, the volume conservation argument is corrected using the experimentally determined volume fraction of bag breakup droplets.
3.7. Bag breakup fraction
At last, we take a look at the volume fraction  $f$ of bag breakup droplets. Figure 12(a) illustrates the experimental values as determined by fitting (3.9) to the measured droplet size distributions. The bag breakup fraction decreases with increasing initial sheet thickness. In other words, by increasing the flow volume, the relative amount of volume contained in droplets originating from bag breakup decreases. This is because by increasing the nozzle size, the spray volume increases more than the area where bag breakup occurs, while the droplet size from bag breakup
 $d_1$ stays constant for all nozzles. The decreasing trend with increasing air velocity for all nozzles can be explained by the length of the bags. As shown in figure 11(a), the length of the bags scales as
 $l_{{bag}} \sim We_{{air}}^{-1/2} \sim U_{{air}}^{-1}$. Therefore, as the air velocity is increased, the bags become smaller and the volume contained in droplets resulting from breakup decreases as well. By analogy, if one would want to blow a large soap bubble, you would have to blow very gently. The increasing trend in the fraction of bag breakup droplets with decreasing airflow velocity is expected to reverse for sufficiently low air velocities, since no bag breakup can occur if the velocity is too low. Figure 12(a) indeed shows the onset of this reversing trend for the three largest nozzles.

As explained in the derivation of the droplet size from bag breakup (§ 3.6), the bag thickness (3.14) is overestimated using a volume conservation argument, since most of the spray volume remains in the sheet after bag breakup. When the bags are formed, only a fraction  $f$ of the sheet volume is transferred into the bag. To derive the actual bag thickness from the volume conservation argument, (3.14) should be multiplied by the experimental bag breakup volume fraction depicted in figure 12(a). The prediction for the average droplet size from bag breakup (3.15) resulting from this corrected bag thickness is illustrated in figure 12(b).
Using the empirical bag breakup volume fraction  $f$ in calculating the bag thickness indeed gives a better prediction for the droplet size
 $d_1$. The predicted value becomes similar for all nozzles, but the scaling for different airflow velocities remains incorrect.
3.8. Discussion on bag breakup droplets
In previous sections, the average droplet size from bag breakup  $d_1$ was shown to be independent of the initial spray sheet thickness and the velocity of the airflow. The derived prediction (3.15), based on the Rayleigh–Taylor instability within the bags, was not able to explain this result (figure 11b). After correcting the prediction for the experimentally determined volume fraction of bag breakup droplets
 $f$, the data for varying initial sheet thicknesses were rescaled, but the inconsistency for different air velocities remained (figure 12b).
We now take a step back to confirm that the experimental average droplet size from bag breakup  $d_1$ indeed does not vary with the velocity of the airflow. As explained in § 3.4, the average droplet sizes were determined by fitting (3.9) to the full droplet size distributions. A different method to measure the average droplet size from bag breakup consists in capturing high resolution images close to the nozzle (similar to figure 7a), where the formed droplets originate from bag breakup only. By doing this for different air velocities, the droplet size distributions from bag breakup were determined (figure 13). All distributions overlap almost perfectly, which confirms that the average droplet size from bag breakup
 $d_1$ indeed does not depend on the airflow velocity.
Droplet size distributions from the TJ110-06 nozzle for varying air velocities. The droplet sizes were determined from high-resolution images captured close to the spray nozzle, so as to only contain droplets generated by bag breakup (similar to figure 7). The outliers for larger droplet sizes were observed to be affected by droplets that did not originate from bag breakup. The solid line shows the bag breakup droplets to be gamma distributed with parameter  $n=4$ when rescaled with average droplet size
 $\langle d \rangle = 120\ \mathrm {\mu }$m.

A possible explanation for the mismatch between the derived expression for the average droplet size from bag breakup (3.15) and the observed independence on the nozzle and airflow velocity could be found in the thickness of the bags. In the derivation of (3.15), we considered the Rayleigh–Taylor instability, where the bag thickness was presumed to be uniform along the bag. However, Jackiw & Ashgriz (Reference Jackiw and Ashgriz2022) observed the thickness of bags created from droplets in an airflow to be non-uniform, with the thinnest section located farthest downwind. It is therefore reasonable to assume that the bags formed from liquid sheets also have a varying thickness along the bag, which may limit the validity of the derived expression.
Since the bag thickness is too small to be directly observed in experiments, it is often derived from the Taylor–Culick velocity (Taylor Reference Taylor1959; Culick Reference Culick1960). Based on this method, we found the average burst thickness of the bags to be  $h_{{burst}} \sim 0.5\ \mathrm {\mu }$m, with values ranging from 0.1 to
 $1.0\ \mathrm {\mu }$m, independent of the air velocity or the initial sheet thickness. This is significantly smaller than expected based on the volume conservation argument, where the bag thickness varied between
 $7\ \mathrm {\mu }$m (for the smallest nozzle and air velocity) and
 $37\ \mathrm {\mu }$m (for the largest nozzle and windspeed).
Similar burst thicknesses have been observed in analogous systems. Opfer et al. (Reference Opfer, Roisman, Venzmer, Klostermann and Tropea2014) considered the bag formation from droplets in an airflow, and reported burst thicknesses between 0.1 and  $1.0\ \mathrm {\mu }$m. Similarly, Jackiw & Ashgriz (Reference Jackiw and Ashgriz2022) also measured the burst thickness of bags to be as small as sub-micron. Based on their results and the results of Opfer et al. (Reference Opfer, Roisman, Venzmer, Klostermann and Tropea2014) combined, they concluded that there is a universal critical bag thickness at which the bags rupture, independent of the air velocity and initial droplet size.
Thin stretching sheets of pure water have often been observed to spontaneously nucleate holes once they reach a thickness of  ${\sim }1\ \mathrm {\mu }$m (Villermaux Reference Villermaux2020). This thickness quantitatively coincides with the Debye screening length, although no precise connection has been established yet. In contrast, Yaminsky et al. (Reference Yaminsky, Ohnishi, Vogler and Horn2010) were able to produce stable films as small as 50–100 nm using a quasistatic thinning technique, where the stability was explained by the presence of electrical double layer forces acting between the two air/water interfaces. The spontaneous nucleation of holes in thin sheets hence remains an unsolved problem.
The limited validity of the Rayleigh–Taylor breakup approach, combined with this universal burst thickness, might explain why the average droplet size from bag breakup does not depend on the nozzle and airflow velocity in our experiments.
4. Conclusions
To gain insight in the mechanisms governing the droplet size distributions in aerial spraying, experiments were performed to reveal the effect of high wind speeds on droplet formation in sprays. Using a laser diffraction method, droplet size distributions were measured for different flat fan nozzles at multiple air velocities. For all nozzles and non-zero wind velocities, an additional peak at small ( ${\approx }80\ \mathrm {\mu }$m) droplets was observed in the distributions. Using high-speed imaging, the formation and consecutive breakup of liquid bags was observed downwind of the spray. Image analysis of the droplets created by fragmentation of the bags revealed the bag breakup mechanism to be responsible for the additional peak in the droplet size distributions when spraying with an external airflow.
The droplet size distributions for spraying with wind were concluded to consist of droplets generated by two distinct mechanisms; bag breakup and the remaining sheet breakup. The bag breakup droplets were shown to be gamma distributed with parameter  $n=4$. The fragmentation of the remaining sheet was observed to show similarities with the sheet breakup in the absence of an external airflow and was hence described by a two-parameter (
 $m,n$) compound gamma function. To describe the full droplet size distribution which consisted of both bag breakup and remaining sheet breakup droplets, a linear combination of the two distributions was used to describe the experimental data. By fitting this probability density function to the experimental distributions, the average droplet size from bag breakup, the average droplet size from sheet breakup and the volume fraction of the bag breakup droplets were extracted.
The destabilisation of the spray was shown to be governed by the Rayleigh–Taylor instability, where the perpendicular acceleration of the sheet due to the pressure of the airflow led to the growth of perturbations in the sheet. Based on the fastest growing wavenumber in this instability, the experimentally observed breakup length and size of the holes that emerge in the sheet after bag breakup were successfully predicted. The theoretical predictions of these spray characteristics, combined with simple volume conservation arguments, were able to successfully predict the average droplet size from sheet breakup. Using a similar volume conservation argument, a prediction for the average droplet size from bag breakup was derived. After correcting for the measured bag breakup volume fraction, the predicted droplet size provided the right order of magnitude, but the independence of the measured average bag breakup droplet size on the initial sheet thickness and the velocity of the air could not be quantified.
Funding
This research was funded by the Dutch Research Council NWO, IPP grant ‘Innovative Nanotech Sprays’, ENPPS.IPP.019.001.
Declaration of interests
The authors report no conflict of interest.
Appendix A. Sheet thickness and breakup length
A.1. Hydraulic nozzle area and initial sheet thickness
Just before the nozzle, the liquid flows from an approximately 1 cm $^2$ tube into a 1 mm
 $^2$ nozzle. Due to this contracting flow, the measured flow rate
 $Q$ for a given liquid pressure
 $p$ is smaller than predicted by the Bernoulli equation. These entry losses can be accounted for by using the engineering Bernoulli equation
 \begin{equation} p = \frac{1}{2}\rho_{{liq}} \left(\frac{Q}{C_d A}\right)^2, \end{equation}
where  $C_d \leq 1$ is the discharge coefficient accounting for the losses and
 $A$ is the actual outlet area of the nozzle. The effective hydraulic area can then be defined as
 $A_{{hyd}} = C_d A$. By varying the liquid pressure and measuring the flow rate, the hydraulic area can be determined for all nozzles. Figure 14(a) illustrates a linear relation between
 $Q$ and
 $\sqrt {2p/\rho _{{liq}}}$, where the hydraulic area is given by the slope.
(a) Flow rate  $Q$ as a function of the rescaled liquid pressure
 $p$, where the slopes of the fits are equal to the effective hydraulic nozzle area. (b) Microscope image of the TJ65-10 nozzle outlet area. The size of the major and minor is are depicted by
 $a$ and
 $b$, respectively.

The actual nozzle area and the lengths of the axes of the elliptical opening were measured from microscope images. An example image of the TJ65-10 nozzle is depicted in figure 14(b), where the size of the major and minor axes are  $a, b$, respectively. By comparing the actual nozzle area to the hydraulic area, the discharge coefficient was determined to be
 $1\geq C_d\geq 0.82$ for all nozzles. Based on the length of the minor axis and discharge coefficient, the effective hydraulic thickness of the nozzle
 $b_{{hyd}} = \sqrt {C_d} b$ was calculated (see table 1). Since the initial thickness of the sprayed sheet must be equal to this effective nozzle size,
 $h = b_{{hyd}}$ was used for the sheet thickness in this work.
A.2. Breakup length
In § 3.2, the breakup length  $L$ was defined as the distance from the nozzle where the sheet ruptures and holes emerge in the sheet. Alternatively, the breakup length can be defined as the length of the continuous portion of the liquid measured from nozzle exit to the point where breakup occurs (see for example Lefebvre & McDonell Reference Lefebvre and McDonell2017). In the experiments presented with an external airflow, this would be the point where the sheet with holes disintegrates into ligaments. Because holes are blown in the sheet first, with fragmentation of the hole-covered sheet occurring later, a discrepancy arises between the two definitions of the breakup length. Since the experimentally determined breakup length is compared with the disintegration of an accelerated liquid sheet, as analysed by Keller & Kolodner (Reference Keller and Kolodner1954), the first definition was used in this work to better match their results. This breakup length is also experimentally more consistent, since the point where the continuous portion of the spray fragments showed relatively large variations in time in comparison with the hole formation point.
A.3. Sheet thinning
Flat fan nozzles produce a thin sheet, which gets thinner as the liquid travels away from the nozzle due to the expanding motion of the sheet. This thinning has to be taken into account for predicting the average droplet sizes  $d_1$ and
 $d_2$. Consider the schematic of the nozzle in figure 15. At the nozzle opening, the intersectional area of the sheet is given by
 $\frac {1}{4}{\rm \pi} ab$, where
 $a$,
 $b$ are the major and minor axis of the elliptical opening, respectively. At distance
 $L$ away from the nozzle, the intersectional area is given by
 $\frac {1}{4}{\rm \pi} wh_L$, where
 $w$ is the width and
 $h_L$ is the sheet thickness at distance
 $L$ from the nozzle. The liquid velocity was verified using high-speed imaging to be constant along the sheet; therefore, both intersectional areas must be equal due to flow conservation, i.e.
 \begin{equation} h_L = \frac{ab}{w}. \end{equation}
Schematic illustration of of the spray sheet coming from a flat fan nozzle.

As the spray angle  $\theta$ is known (for the TJ110-06 nozzle for example, the spray angle
 $\theta = 110^{\circ }$ and 06 indicates that the flowrate of the nozzle is 0.6 litre per 15 seconds at an operating pressure of 3.0 bar), the width of the sheet is given by
 \begin{equation} w = 2(L+l_*) \tan(\theta/2), \end{equation}
with  $l_*$ the distance before the nozzle to the imaginary point where the sheet width vanishes,
 \begin{equation} l_* = \frac{a}{2\tan(\theta/2)}. \end{equation}
By combining the equations above, the sheet thickness at distance  $L$ from the nozzle is
 \begin{equation} h_L = \frac{ab}{2L\tan(\theta/2)+a}. \end{equation}
The spray droplets are formed at breakup length  $L$ (3.5) away from the nozzle and the thinning of the sheet must be taken into account when predicting the average size of the droplets. In this work, a distinction is therefore made between the initial sheet thickness
 $h$ (as defined in Appendix A.1), and the sheet thickness at the breakup distance
 $h_L$ (defined by (A5) and (3.5)).


 Open access

