Introduction
Amblyopia refers to a developmental visual disorder, which may result from strabismus, anisometropia, or deprivation occurring in early childhood (Ciuffreda et al., Reference Ciuffreda, Levi and Selenow1991; Campos, Reference Campos1995; Daw, Reference Daw1998). It is a cortical disorder (Daw, Reference Daw1998; Kiorpes & McKee, Reference Kiorpes1999; Simons, Reference Simmers, Ledgeway, Mansouri, Hutchinson and Hess2005; Kiorpes, Reference Jeffrey, Wang and Birch2006) and is mostly associated with impaired visual acuity and contrast sensitivity (Hess & Howell, Reference Hess and Bradley1977; Howell et al., Reference Ho and Giaschi1983; Ciuffreda et al., Reference Ciuffreda, Levi and Selenow1991; Campos, Reference Campos1995; McKee et al., Reference Mansouri and Hess2003), which cannot be significantly improved with refractive correction. A number of studies have revealed many other visual abnormalities, such as deficits in local (Schor & Levi, Reference Rohaly and Owsley1980; Hess & Anderson, Reference Georgeson and Scott-Samuel1993; Qiu et al., Reference Pelli, Rubin and Legge2007) and global (Ellemberg et al., Reference Ellemberg, Lewis, Maurer, Brar and Brent2002; Simmers et al., Reference Simmers, Ledgeway and Hess2003, Reference Simmers, Ledgeway, Hess and McGraw2006; Constantinescu et al., Reference Constantinescu, Schmidt, Watson and Hess2005; Kiorpes et al., Reference Kiorpes and McKee2006; Aaen-Stockdale et al., Reference Aaen-Stockdale, Ledgeway and Hess2007; Aaen-Stockdale & Hess, Reference Aaen-Stockdale and Hess2008) motion perception, spatial/temporal crowding (Bonneh et al., Reference Bonneh, Sagi and Polat2004, Reference Bonneh, Sagi and Polat2007; Chung et al., Reference Chung, Li and Levi2008), and impaired global shape or contour perception (Hess et al., Reference Hess, Mansouri, Dakin and Allen1999; Chandna et al., Reference Chandna, Pennefather, Kovacs and Norcia2001; Jeffrey et al., Reference Howell, Mitchell and Keith2004; Levi et al., Reference Lagreze and Sireteanu2007), in amblyopic humans or monkeys.
Impaired global motion perception in various types of amblyopia has been well documented. Using random dot kinematograms, Ellemberg et al. (Reference Ellemberg, Lewis, Maurer, Brar and Brent2002) found that the ability to discriminate the direction of global motion was significantly impaired after early visual deprivation, with much worse impairments after early binocular than monocular deprivation. This deficit in global motion perception was also found in a “treated” eye (Constantinescu et al., Reference Constantinescu, Schmidt, Watson and Hess2005), which had experienced early visual deprivation due to bilateral congenital cataracts but had normal visual acuity (20/20) when examining. In another two studies, Simmers et al. (Reference Simmers, Ledgeway and Hess2003, Reference Simmers, Ledgeway, Hess and McGraw2006) reported deficits in processing of translational, rotational, and radial global motion in strabismic and anisometropic amblyopes. Similar deficits in second-order optic flow processing were also found (Aaen-Stockdale et al., Reference Aaen-Stockdale, Ledgeway and Hess2007). Most of these deficits as well as those found in amblyopic monkeys (Kiorpes et al., Reference Kiorpes and McKee2006) cannot be solely accounted for by deficits in visual acuity or contrast sensitivity. By using stimuli composed of spatial frequency band-pass elements, a recent study (Aaen-Stockdale & Hess, Reference Aaen-Stockdale and Hess2008) has indicated that the global motion deficit in amblyopia is still present when impairments in low-level processing have been factored out and that this residual deficit appears to be spatial scale invariant, further supporting the hypothesis that there is a broadband global motion processing deficit, which originates from extrastriate cortex, in amblyopia.
The nature of this global processing deficit is still not entirely clear. It has been proposed that, in amblyopia, the ability of motion integration is intact, whereas the ability of noise (task-irrelevant elements) segregation is somewhat impaired: when compared with normal controls, various types of amblyopes displayed normal performance in global tasks (Mansouri et al., Reference Majaj, Carandini and Movshon2004; Hess et al., Reference Hess and Malin2006) where all local elements were useful for decision making (i.e., noiseless tasks) but exhibited poor performance in tasks involving orientation or motion noise (Simmers et al., Reference Simmers, Ledgeway and Hess2003, Reference Schor and Levi2005, Reference Simmers, Ledgeway, Hess and McGraw2006; Aaen-Stockdale et al., Reference Aaen-Stockdale, Ledgeway and Hess2007; Aaen-Stockdale & Hess, Reference Aaen-Stockdale and Hess2008). This hypothesis has also been supported by the findings of Mansouri and Hess (Reference Mansouri, Allen, Hess, Dakin and Ehrt2006), which have suggested that normal subjects can segregate noise elements whose orientations/directions are very different, such as more than 2 s.d., from the mean and then integrate the remaining elements, while amblyopes cannot segregate those noise elements and just blindly integrate all, both the signal and the noise.
Whether the ability of motion integration is intact in amblyopia can also be explored by examining the plaid perception. A moving plaid, composed of two moving gratings with different orientations, which are physically superimposed, is a different type of global motion stimuli. Much evidence (Adelson & Movshon, Reference Adelson and Movshon1982; Movshon et al., Reference McKee, Levi and Movshon1985; Wilson et al., Reference Thompson, Villeneuve, Casanova and Hess1992) has suggested a two-stage visual analysis underlying the moving plaid perception, a decomposition into two one-dimensional component motions, which can be implemented by component-selective neurons such as those in V1, and a recombination of these component motions, which can be implemented in MT. Compared with that of random dot kinematograms, the processing of moving plaids requires local motion integration but not noise segregation. Therefore, if the ability of motion integration is impaired in amblyopia, amblyopes are expected to show more deficits in perception of moving plaids than those of gratings. Otherwise, the former are expected to be comparable to the latter.
We therefore investigated this issue in patients with anisometropic amblyopia by measuring the contrast sensitivity for moving gratings and plaids whose component gratings have the same spatial and temporal frequencies. Our results showed that the deficits of amblyopic eyes (AEs) in contrast sensitivity for moving plaids were statistically equivalent to those for moving gratings, suggesting that the integration of motion information conveyed by component gratings of moving plaids may be intact in anisometropic amblyopia.
Materials and methods
Subject
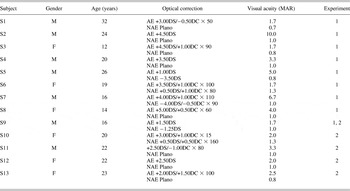
Ten adults (average age = 25.00 ± 0.68 years) with normal or corrected-to-normal vision and 13 unilateral anisometropic subjects (average age = 20.46 ± 1.48 years) with appropriate optical corrections participated in this study. Five normal subjects completed both experiments and five only completed experiment 1 (for more details of experiment 1 and 2, see Experiment design and procedure section). One amblyopic subject completed both experiments, eight completed only experiment 1, and four completed only experiment 2. Detailed characteristics of amblyopic subjects are listed in Table 1. Written informed consents were obtained from each subject or from their guardians/parents before experiments.
Characteristics of 13 anisometropic amblyopes

F, female; M, male; MAR, minimum angle of resolution.
Apparatus and visual stimuli
All stimuli were generated on a PC with a 17-inch gamma-corrected Sony G220 monitor, which had a resolution of 1024 × 768 pixels and a vertical refresh rate of 100 Hz. The experiment was programmed and run in Matlab version 7.0 with Psychtoolbox version 2.50 (Brainard, Reference Brainard1997; Pelli, Reference Movshon, Adelson, Gizzi, Newsome, Chagass, Gattass and Grossberg1997). A custom-built device was used to generate 14-bit gray level (Li et al., Reference Levitt2003). The mean luminance of the screen was 35 cd/m2. The subjects viewed the screen in a dimly lit room at a distance of 1.42 m.
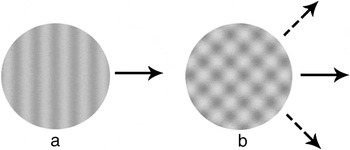
All stimuli, subtended 3.1 deg of visual angle, were present in the center of the screen. Two types of stimuli, sine wave gratings (Fig. 1a) and plaids (Fig. 1b), were used. The plaid was composed of two superimposed sine wave gratings, which had identical spatial frequency, temporal frequency, and contrast but different orientations (differed by 90 deg). Here, we specified the contrast and spatial and temporal frequencies of the plaid pattern with the corresponding parameters of its component gratings. The luminance profile of gratings and plaids at point (x, y) and time point t is defined in eqns. (1) and (2), respectively:
 $$l(x,y,t) = L_{{\rm{mean}}} \{ C\sin [2\pi (f(y\cos \theta - x\sin \theta ) + \omega t) + \phi ] + 1\} ,$$
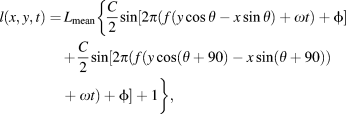 $$\eqalignb{ l(x,y,t) = \,L_{{\rm{mean}}}\{ {{C \over 2}\sin [2\pi (f(y\cos \theta - x\sin \theta ) + \omega t) + \phi]} \cr { + {C \over 2}\sin [2\pi (f(y\cos (\theta + 90) - x\sin (\theta + 90)) + \omega t) + \phi ] + 1 \}, \cr $$
where L mean is the background luminance of the display; f and ω are the spatial and temporal frequency of the sine wave grating, respectively; θ represents the orientation of the (component) grating; φ is the initial spatial phase (random); and C is the grating contrast.
Experiment design and procedure
Two experiments were designed in this study to investigate the plaid perception over a range of stimulus durations, spatial and temporal frequencies. In experiment 1, a single spatial frequency (4 cycles/deg, a relatively high spatial frequency for AEs), seven temporal frequencies ranging from 0.5 to 24 cycles/s, and two stimulus durations (300 and 1000 ms) were employed. In experiment 2, another two spatial frequencies (1 and 2 cycles/deg), the same seven temporal frequencies as in experiment 1, and the short stimulus duration (300 ms) were used.
Four sessions were assigned to measure contrast threshold in each experiment (two stimulus types × two durations and two stimulus types × two spatial frequencies for experiment 1 and 2, respectively). Each session contained five blocks with 80 trials per block. Different temporal frequencies were randomly intermixed in each block. The session order was counterbalanced across subjects. Before the measure, each subject received a short practice session.
A motion direction discrimination task was used in the measure. In each trial, the stimulus could move in one of eight possible directions, equally spaced between 0 and 360 deg in steps of 45 deg. The subject was required to indicate the correct moving direction. A short beep was provided at the beginning of presentation. No feedback was provided.
A single-interval eight-alternative forced-choice method and a three-down one-up staircase procedure (Levitt, Reference Levi, Yu, Kuai and Rislove1971), which tracked the threshold at 79.4% correct, were used to measure the contrast thresholds. In both experiments, the contrast thresholds were measured for AE and nonamblyopic eyes (NAE) of amblyopic subjects and dominant eyes (control eyes, CE) of normal control subjects. The modulation transfer functions (MTFs) for moving gratings and plaids were then calculated.
Model fitting and statistics
The MTFs for moving gratings and plaids were fitted with parabolas, which were used to fit contrast sensitivity function for low-vision observers (Pelli et al., Reference Pelli1986) and old adults (Rohaly & Owsley, Reference Qiu, Xu, Zhou and Lu1993).
 $$\log ({\rm{CS}}_{{\rm{theory}}} ) = k(\log _2 \omega - \log _2 \omega _0 )^2 + \log ({\rm{CS}}_0 ),$$
where CStheory is the predicted contrast sensitivity; ω is the temporal frequency of gratings/plaids; ω 0 and CS0 are the coordinates of the peak; and k is a constant that determines the curvature (shape) of the parabola.
The model fitting procedures were implemented in Matlab using a nonlinear least square method that minimized the squared differences ( $\sum {[\log ({\rm{CS}}_{{\rm{theory}}} ) - \log ({\rm{CS}}_{{\rm{measured}}} )]} ^2 $) between the log measured contrast sensitivities and the log model-predicted contrast sensitivities.
The goodness of fit was evaluated by the r 2statistic:
 $$r^2 = 1.0 - {{\sum {[\log ({\rm{CS}}_{{\rm{theory}}} ) - \log ({\rm{CS}}_{{\rm{measured}}} )]^2 } } \over {\sum {[(\log ({\rm{CS}}_{{\rm{theory}}} ) - {\rm{mean}}(\log ({\rm{CS}}_{{\rm{measured}}} )))]^2 } }}.$$
Between-subject analysis of variance (ANOVA) was used to compare data in the AEs of the amblyopic subjects and the dominant eyes of the control subjects. The same way was also used to compare data in the NAEs of the amblyopic subjects and the dominant eyes of the control subjects. Within-subject ANOVA was used to compare data in the AEs and the NAEs of the amblyopic subjects.
Results
Experiment 1
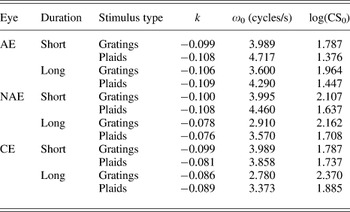
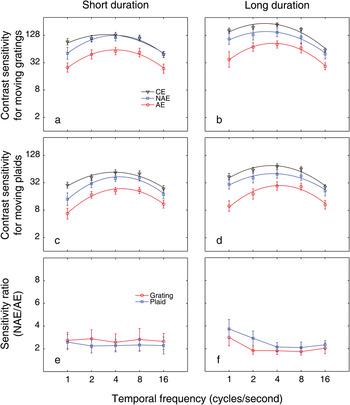
Data of the 9 anisometropic amblyopes and 10 control subjects that participated in this experiment were shown in Fig. 2, and the parameters of the best fitting parabolas to their MTFs were listed in Table 2.
Stimuli used in this study. (a) Sine wave grating. The solid arrow indicates the moving direction. (b) Plaid pattern composed of two superimposed sine wave gratings with the same contrast and spatial and temporal frequencies. The dashed arrows indicate the moving directions of two component gratings, and the solid arrow indicates the perceived direction of the plaid.

Parameters of the best fitting parabolas in experiment 1

AE, average of 9 subjects; NAE, average of 9 subjects; CE, average of 10 subjects.
At the short duration, the MTFs for moving gratings and plaids were shown in Figs. 2a and 2c, respectively. The MTFs exhibited no significant differences between the NAEs and the CEs at all tested temporal frequencies for both gratings [F(1,17) = 0.508, P = 0.486] and plaids [F(1,17) = 2.346, P = 0.144]. As expected, the AEs had lower sensitivity than the NAEs, and their MTFs were significantly different [for gratings, F(1,8) = 10.017, P = 0.013; for plaids, F(1,8) = 6.817, P = 0.031]. These results are consistent with a previous study (Qiu et al., Reference Pelli, Rubin and Legge2007), which investigated the MTFs of moving sine wave gratings with a similar duration (250 ms) in anisometropic amblyopia.
The MTFs for moving gratings and plaids at the long duration were shown in Figs. 2b and 2d, respectively. Compared with those at the short duration, the sensitivities for moving gratings/plaids at the long duration were slightly higher. However, significant differences between two stimulus durations were only found in CEs for moving gratings [F(1,9) = 8.855, P = 0.016] and plaids [F(1,9) = 35.994, P < 0.001] and in NAEs for moving plaids [F(1,8) = 16.686, P = 0.004].
At the long duration, the MTFs of the NAEs and the CEs exhibited no significant differences for gratings [F(1,17) = 2.602, P = 0.125] and plaids [F(1,17) = 3.251, P = 0.089]. Again, the MTFs of the AEs showed significant degradation for both types of stimuli [for gratings, F(1,8) = 10.861, P = 0.011; for plaids, F(1,8) = 12.497, P = 0.008] when compared with those of the NAEs.
The sensitivity ratios between NAEs and AEs at all conditions were plotted as functions of temporal frequency in Figs. 2e and 2f. A three-way within-subject ANOVA (duration × stimulus type × temporal frequency) indicated that, among all main effects and interactions, only the interaction of duration × stimulus type was statistically significant [F(1,8) = 7.726, P = 0.024]. As shown in the figure, this significant interaction was characterized by slightly higher ratios for moving plaids at the long duration. Based on this, two separate ANOVAs were conducted, one for the short duration and the other for the long duration. The results showed that there were no significant differences in sensitivity ratios between two types of stimuli at both short [F(1,8) = 1.312, p = 0.285] and long [F(1,8) = 2.977, P = 0.123] durations, suggesting that the loss of contrast sensitivity for moving plaids at this spatial frequency is statistically equivalent to that for the corresponding component gratings, that is, the former can be almost completely accounted for by the latter.
Experiment 2
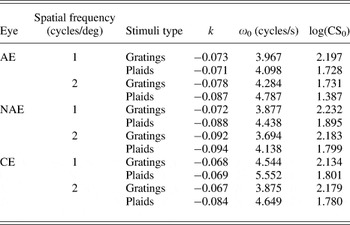
Data of the five anisometropic amblyopes and five control subjects that participated in this experiment were shown in Fig. 3, and the parameters of the corresponding best fitting parabolas to their MTFs were listed in Table 3.
Data from 9 amblyopes and 10 control subjects who participated in experiment 1. (a, c) Average motion direction discrimination MTFs for the AEs, NAEs, and control eyes (CEs) at the short duration (300 ms). (b, d) Average motion direction discrimination MTFs at the long duration (1000 ms). (e, f) Sensitivity ratios between NAE and AE at both durations. Error bars indicate standard error of the mean.

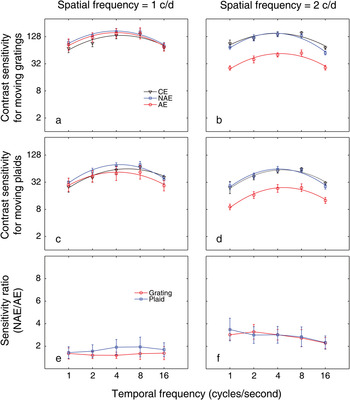
Data from five amblyopes and five control subjects who participated in experiment 2. (a, c) Average motion direction discrimination MTFs for the AEs, NAEs, and CEs at the spatial frequency of 1 cycles/deg. (b, d) Average motion direction discrimination MTFs at the spatial frequency of 2 cycles/deg. (e, f) Sensitivity ratios between NAE and AE at both spatial frequencies. Error bars indicate standard error of the mean.

Parameters of the best fitting parabolas in experiment 2

AE, average of five subjects; NAE, average of five subjects; CE, average of five subjects.
At 1 cycles/deg (Figs. 3a and 3c), the MTFs exhibited no significant differences not only between the NAEs and the CEs [for gratings, F(1,8) = 0.005, P = 0.994; for plaids, F(1,8) = 0.321, P = 0.586] but also between the NAEs and the AEs [for gratings, F(1,4) = 0.117, P = 0.750; for plaids, F(1,4) = 0.984, P = 0.377]. While at 2 cycles/deg (Figs. 3b and 3d), the results were similar to those in experiment 1: significant differences were found in MTFs between the NAEs and the AEs [for gratings, F(1,4) = 30.020, P = 0.005; for plaids, F(1,4) = 13.641, P = 0.021] but not between the NAEs and the CEs [for gratings, F(1,8) = 1.310, P = 0.286; for plaids, F(1,8) = 0.034, P = 0.859]. These results, along with those in experiment 1, suggest that the loss of contrast sensitivity for moving plaids in AEs, just like that for moving gratings, is selective to the spatial frequency of the component gratings: it appears at intermediate and high spatial frequencies, while not at low spatial frequencies.
The sensitivity ratios between NAEs and AEs were also plotted as functions of temporal frequency in Figs. 3e and 3f. As can be seen in the figure, ratios were higher at 2 c/d than at 1 c/d. This idea was in line with the findings described in last paragraph and was supported by another three-way within-subject ANOVA (stimulus type × spatial frequency × temporal frequency), which indicated a significant effect of spatial frequency [F(1,4) = 18.427, P = 0.013]. Similar to those in experiment 1, sensitivity ratios were independent of the stimulus type (the main effect as well as interactions related to stimulus type, all P values were >0.05), indicating that the loss of contrast sensitivity for moving plaids at these two spatial frequencies, if there was, was statistically comparable to that for the corresponding component gratings in anisometropic amblyopia. The findings suggest that the conclusion obtained in experiment 1 that the loss of contrast sensitivity for moving plaids can be accounted for by that for the corresponding component gratings at 4 c/d can generalize to a wider range of spatial frequencies.
Discussion
In this study, we measured the contrast sensitivity for moving plaids and their corresponding component gratings across a range of stimulus durations and spatial and temporal frequencies in anisometropic amblyopia. The results showed a significant loss in contrast sensitivity for moving plaids in AEs at intermediate and high spatial frequencies but not at the low spatial frequency, just like that for moving gratings. Additionally, we found that the NAE/AE sensitivity ratios for plaids were always comparable to those for gratings, suggesting that the deficits in perception of moving plaids can be completely accounted for by those of the corresponding component gratings in anisometropic amblyopia. These findings indicate that the ability of motion integration in plaid perception at the contrast threshold level is intact in amblyopia.
Two-stage processing of plaid perception at the contrast threshold level
As described in Introduction section, a two-stage visual analysis for plaid perception has been supported by many studies (Adelson & Movshon, Reference Adelson and Movshon1982; Movshon et al., Reference McKee, Levi and Movshon1985; Wilson et al., Reference Thompson, Villeneuve, Casanova and Hess1992). Most of them used stimuli at suprathreshold contrast levels. With respect to the mechanisms at the contrast threshold level, less is known. Delicato and Derrington (Reference Delicato and Derrington2005) have suggested that the coherence of the plaid stimuli breaks down at low contrasts, and therefore, direction discrimination is ambiguous and based on the two component grating directions. However, their plaid stimuli were constructed by superimposing one stationary grating and one moving grating, different from ours, which were composed of two moving gratings with the same spatial and temporal frequencies. Most importantly, by using the same paradigm as ours, a previous study (Gegenfurtner, Reference El-Shamayleh, Kiorpes, Kohn and Movshon1998), which investigated the plaid perception at the contrast threshold level in normal subjects, has suggested that, at this condition, subjects have to combine the information from both components to give a correct response, in agreement with the two-stage processing theory of plaid perception.
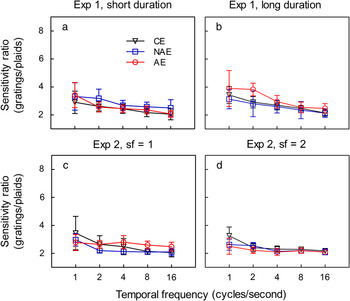
It may also be criticized that the identification of the direction of moving plaids could be based on the motion of local blob features in the plaid stimuli, rather than the combination of the direction of two component gratings. This hypothesis has been proposed by Georgeson and Scott-Samuel (Reference Gegenfurtner2000) and is consistent with a number of previous observations (Anderson & Burr, Reference Anderson and Burr1991; Derrington & Badcock, Reference Derrington and Badcock1992; Wright & Gurney, Reference Wilson, Ferrera and Yo1992). However, we argue that this is not the case in our study. According to our definition, the component gratings have half the contrast of the single gratings, and the actual peak-to-trough contrast of the plaid is actually twice the level of the components. That is to say, the actual peak-to-trough contrast of the plaid is equivalent to that of a single grating. If the motion of local blob features were used to identify the motion of the plaids, then thresholds for the identification of the direction of motion of plaids would be expected to be as low as the thresholds for single gratings. This is clearly not the case for our data: as shown in Fig. 4, the contrast sensitivity for moving gratings is more than two times larger than that for moving plaids for all three groups. These results are also consistent with the study of Gegenfurtner (Reference El-Shamayleh, Kiorpes, Kohn and Movshon1998) in which the contrast of plaid stimuli is two times larger than ours by definition and the contrast sensitivity for moving plaids has been found to be a little lower than that for moving gratings in normal subjects.
Sensitivity ratios between component gratings and plaids for the AEs, NAEs, and CEs in four conditions.

Based on all discussed above, it can be concluded that the two-stage processing model of plaid perception holds true at the contrast threshold level, at least in the paradigm described in the present study. Therefore, the investigation of the contrast sensitivity for moving plaids could provide some insight into the ability of motion integration, the main process in the second stage of plaid perception.
Plaid perception in amblyopia
Our findings on the perception of moving gratings in amblyopia are in accordance with the previous studies (Hess & Anderson, Reference Georgeson and Scott-Samuel1993; Qiu et al., Reference Pelli, Rubin and Legge2007), which indicated a significant deficit in perception of moving gratings at intermediate and high spatial frequencies in amblyopia. In addition to this, our results suggest that this is also the case for the perception of moving plaids at the contrast threshold level.
Thompson et al. (Reference Sireteanu, Thiel, Fikus and Iftime2008) have investigated the plaid perception in amblyopia by measuring the proportion of coherent responses at a suprathreshold contrast level. In experiment 1, they investigated the plaid perception at a short stimulus duration (1 s) and found more coherent responses for amblyopic and fellow fixing eyes than for normal eyes. These differences were eliminated when the plaids were presented for a long duration (more than 1 s, maximum: 2 min) with another technique in experiment 2. In experiment 3, stimuli constructed from multiple circular apertures each containing a moving grating were presented with the same way as in experiment 2. Again, they found a slightly decreased level of motion integration for amblyopic than for normal eyes. Based on these results, they concluded that the plaid perception as well as the neuronal mechanisms underlying plaid perception are only subtly impaired in amblyopia.
There seems to be a little difference between the findings of Thompson et al. and ours since they found a subtle impairment, whereas no impairment was found in our study. However, it should be noted that the impairment found in their study was so small that in a following study, Thompson et al. agreed to the statement that AEs mediate normal perception of dynamic plaid stimuli and tried to explore the underlying mechanisms by using functional magnetic response imaging (fMRI) (Thompson et al., Reference Thompson, Aaen-Stockdale, Mansouri and Hess2012). Additionally, their results of experiment 3, which showed subtle deficits of motion integration in AEs, were not directly related to the plaid perception in amblyopia. The stimuli in their experiment 3 were constructed from multiple circular apertures each containing a moving grating and were very different from those in experiment 1 and 2. Although global integration of different local motion information is required for processing both these two types of stimuli, some evidence (Majaj et al., Reference Li, Lu, Xu, Jin and Zhou2007) has suggested that there may be different underlying physiological bases: pattern cells in MT, which response well to plaids (i.e., two component gratings are physically superimposed, as used in experiment 1 and 2 of Thompson et al.’s study), lose their pattern direction selectivity when two component gratings are at different locations in their receptive fields (as used in experiment 3 of Thompson et al.’s study), suggesting that the ability of motion integration of MT cells is inefficient for spatially separated components. In view of this, it can be concluded that our results are virtually consistent with the findings of Thompson et al.
Kiorpes et al. (Reference Kiorpes and McKee2006) have indicated important differences in global motion deficits between strabismic and anisometropic amblyopia. By using random dot kinematograms, different profiles of brain activation have also been found between these two types of amblyopia (Ho & Giaschi, Reference Hess, Wang, Demanins, Wilkinson and Wilson2009). Additionally, many studies (Hess & Bradley, Reference Hess and Anderson1980; Lagreze & Sireteanu, Reference Kiper and Kiorpes1991; Sireteanu et al., Reference Simons1993; Kiper & Kiorpes, Reference Kiorpes, Tang and Movshon1994; Hess & Malin, Reference Hess and Howell2003; Sireteanu et al., Reference Sireteanu, Lagreze and Constantinescu2008) have indicated that there may be different mechanisms underlying spatial deficits at contrast threshold and contrast suprathreshold levels in amblyopia. In spite of these factors, Thompson et al.’s study, which investigated the plaid perception at suprathreshold contrast levels in strabismic amblyopia, and the present study, which investigated it at the threshold level in anisometropic amblyopia, obtained similar results. These findings suggest that most mechanisms in the second processing stage of moving plaids, the integration of motion information conveyed by two component gratings, may be intact in amblyopia, regardless of the contrast levels and the types of amblyopia.
Neural mechanisms for plaid perception in amblyopia
It has been proposed that the pattern direction-selective neurons in area MT underlie the perception of moving plaids (Movshon et al., Reference McKee, Levi and Movshon1985). Given the substantial psychophysical (Ellemberg et al., Reference Ellemberg, Lewis, Maurer, Brar and Brent2002; Simmers et al., Reference Simmers, Ledgeway and Hess2003, Reference Simmers, Ledgeway, Hess and McGraw2006; Constantinescu et al., Reference Constantinescu, Schmidt, Watson and Hess2005; Aaen-Stockdale et al., Reference Aaen-Stockdale, Ledgeway and Hess2007; Aaen-Stockdale & Hess, Reference Aaen-Stockdale and Hess2008) and brain imaging (Bonhomme et al., Reference Bonhomme, Liu, Miki, Francis, Dobre, Modestino, Aleman and Haselgrove2006; Ho & Giaschi, Reference Hess, Wang, Demanins, Wilkinson and Wilson2009) studies, which have indicated functional impairment of area MT in patients with amblyopia, it is surprising to find almost normal perception of moving plaids in them. There are two possible explanations for this finding. The first is that functions of area MT are selectively impaired by amblyopia: Processing of motion information conveyed by random dot kinematograms is seriously affected, whereas that of moving plaids is less done. This is supported by a recent animal study (El-Shamayleh et al., Reference Wright and Gurney2010), which has shown that pattern direction selectivity in MT of amblyopic macaque monkeys is intact in spite of substantial deficits in the processing of random dot kinematograms. The second explanation, proposed by Thompson et al. (Reference Thompson, Aaen-Stockdale, Mansouri and Hess2012), is that an alternative network of neural areas is recruited by the AE to support normal plaid perception. By using fMRI, Thompson et al. found a different pattern of responses within the visual cortex when plaids were viewed by amblyopic as opposed to NAEs. Especially, the response of the pulvinar and ventral V3 to plaid stimuli differed under amblyopic versus NAE viewing conditions, and the response of these areas significantly varies according to motion type (incoherent vs. coherent plaid motion). These findings suggest that the pulvinar and ventral V3 may contribute to the compensatory network underlying the plaid perception of AEs.
As described in Introduction section, psychophysical researchers have proposed that the ability of motion integration is intact, whereas the ability of noise segregation is somewhat impaired in amblyopia, and that it is the presence of noise in the random dot kinematograms rather than a deficit in local motion integration that causes the impaired performance. The findings in the present study support this hypothesis since we have found normal perception of moving plaids, the processing of which requires local motion integration but not noise segregation, in amblyopia. It should be noted that this hypothesis is not mutually exclusive with the two explanations described above, especially the second explanation. It is conceivable that if an alternative neural network underpins plaid motion perception for amblyopic viewing, this network may be more susceptible to noise than the presumably optimal network recruited by NAEs.
Conclusion
In summary, we found a significant loss of contrast sensitivity for moving plaids at intermediate and high spatial frequencies in anisometropic amblyopia. We also found that the poor contrast sensitivity for moving plaids in anisometropic amblyopia could be accounted for by that for component gratings, that is, low-level processing deficits. These results suggest that the integration of motion information conveyed by component gratings of moving plaids may be intact in anisometropic amblyopia.