I. INTRODUCTION
Since the pioneering work of M. Grätzel in 1991, the dye-sensitized solar cells (DSSCs) have attracted more attention due to their intrinsic advantages of low cost, non-pollution, easy production, and relatively high power conversion efficiency (η).Reference O’Regan and Grätzel1–Reference Yella, Lee, Tsao, Yi, Chandiran, Nazeeruddin, Diau, Yeh, Zakeeruddin and Grätzel4 Generally, DSSCs consist of nanocrystalline semiconductor oxide photoelectrode, dye sensitizer, redox shuttle electrolyte, and counter electrode. Under illumination, electron is injected into the conduction band of the semiconductor photoelectrode from the excited state of the sensitizer. A suitable redox shuttle electrolyte can recover the oxidized dye. The diffusion of the oxidized shuttle electrolyte to the counter electrode completes the circuit.Reference Kim, Lee, Kim, Lim, Choi, Park, Kim and Lee5–Reference Mishra, Fischer and Bäuerle7 In principle, fast photoelectron transfer and slow recombination will bring about a high η. It has been established that the structural and physical properties of the nanocrystalline semiconductor oxide are predominant factors.Reference Shang, Wu, Huang, Lin, Lan, Huang and Fan8
An anatase TiO2 nanoparticle (NP) film is a commonly used photoelectrode for DSSCs due to its facile fabrication and low cost.Reference O’Regan, Bakker, Kroeze, Smit, Sommeling and Durrant9–Reference Pan, Dong, Zhou, Wang, Pan, Yuan, Miao and Tian11 However, its small electron diffusion coefficient limits the random walk of electrons through the NP film.Reference Martinson, Goes, Fabregat-Santiago, Bisquert, Pellin and Hupp12 Some strategies have been tried to optimize the structure of the photoelectrodes to increase the photoelectron transfer and reduce the charge recombination. One strategy is to apply one-dimensional (1D) nanomaterials including nanowires, nanotubes, nanorods, and nanofibers because these materials can accelerate electron transport and increase light scattering.Reference Yang and Leung13–Reference Zhang, Pan, Zhou, Qu, Pan, Jiang, Tian, Wang, Xie, Dong, Miao and Tian15 Unfortunately, these 1D nanomaterials commonly suffer from random array patterns, which cannot reduce the recombination significantly and thus result in a lower η.Reference Tan and Wu16 Highly ordered TiO2 nanotubes may provide an alternative electron transport material that reduces charge recombination and increases electron collection relative to conventional disordered NP or random 1D nanomaterial channels.Reference Yang, Jha, Liu and Schmuki17–Reference Yang, Kim, Jha, Lee, Paul and Schmuki20 However, the η of DSSCs based on TiO2 nanotubes remained relatively low as a result of incomplete coverage of dye molecules on the TiO2 nanotube surface and insufficient infiltration of electrolyte into TiO2 nanotubes.Reference Hsiao, Liou and Teng21–Reference Roy, Kim, Lee, Spiecker and Schmuki24 So, fabrication of well-ordered semiconductor oxide array photoelectrodes with optimized structural parameters and surface properties is a better method to increase the photoelectron transfer and reduce the recombination of DSSCs.
Herein, the highly ordered TiO2 nanotube arrays with controlled aspect ratio were prepared via potentiostatic anodization. And the controllable aspect ratio of TiO2 nanotube arrays can be achieved by only changing the water content and anodization time. Then, the DSSCs based on the highly ordered TiO2 nanotube array photoelectrodes were fabricated. The DSSCs based with optimal aspect ratio possessed the highest η of 2.60% under backside illumination. This is because the optimal aspect ratio of TiO2 nanotube arrays could result in a better separation of photogenerated charges. Meanwhile, the influence of different aspect ratios on the η has been systematically investigated by the electrochemical impedance spectra (EIS).
II. EXPERIMENTAL DETAILS
A 0.25-mm-thick titanium foil (99.7%, Aldrich), HF (40%), ammonium fluoride (97.0%), formamide (98.5%), and commercial TiO2 powder (P25, Degussa, Germany) were purchased from standard sources and used as received. The transparent conducting glass (TCO, 20 Ω/square, Nippon sheet glass, Japan) was used as received for electrode substrate. The used Ru complex dye was cis-bis (isothiocyanato) bis(2,2′-bipyridyl-4,4′-dicarboxylato) ruthenium(II)bistetrabutyl-ammonium (N719, Solaronix SA, Switzerland). The redox shuttle electrolyte was composed of 0.1 M LiI (anhydrous, 99%, Acros), 0.05 M I2 (≥99.8%), 0.5 M tert-butylpyridine (99%, Aldrich), and 0.6 M 1-propyl-2,3-dimethylimidazolium iodide (99%) in acetonitrile (99%, Fluka). All the other solvents and chemicals used in the experiments are at least reagent grade and used as received. Milli-Q water with a resistivity of 18 MΩ cm was used in all the experiments.
Highly ordered TiO2 nanotube arrays were prepared by a potentiostatic anodization with a two-electrode electrochemical cell. The titanium foil was used as a working electrode, and a platinum foil served as a counter electrode. The interval between the working electrode and counter electrode was approximately 2.5 cm. The voltage was applied by a DC power supply (model DYY-6C, Beijing 61 Technology, P.R. China). A short TiO2 nanotube array was formed by anodizing the Ti foil in 40 mL of 0.5 wt% HF solution at 20 V for 20 min, which is the same as the reported method.Reference Liu, Zhang, Nishimoto, Jin, Tryk, Murakami and Fujishima25,Reference Shankar, Mor, Fitzgerald and Grimes26 Other TiO2 nanotube arrays were prepared at the same applied voltage (20 V) by using 40 mL of organic electrolyte. The present organic electrolyte was 0.27 M ammonium fluoride (97.0%, Wako Chemicals) in formamide (98.5%, Wako Chemicals) containing different water content (3% and 4%) respectively. The aspect ratio of the nanotube array could be controlled using different water content and anodization time (1 h or 6 h). This is similar to the report of Grimes et al. and Liu et al., with only a slight change of water content.Reference Liu, Zhang, Nishimoto, Jin, Tryk, Murakami and Fujishima25,Reference Shankar, Mor, Fitzgerald and Grimes26 Broken nanotubes and fragments were formed generally on the surface of the nanotube array and could be removed by washing in isopropyl alcohol ultrasonically. The TiO2 NPs (P25) with the thickness of 10 µm were also coated on Ti foil via doctor blade method for comparison. The crystallization of TiO2 nanotube array and TiO2 NP photoelectrodes were realized by annealing the as-prepared film at 500 °C under ambient air for 3 h.
The sensitization of the prepared TiO2 nanotube array and TiO2 NP photoelectrodes was achieved by immersing them into 0.5 mM N719 dye solution for 24 h. The counter electrode was prepared according to the previous work.Reference Qi, Ma, Ouyang, Zhang, Li and Chen27 The dye-sensitized TiO2 nanotube array and TiO2 NP photoelectrodes with Pt counter electrodes were adhered together with epoxy resin, respectively. The space between the electrodes was filled with the electrolyte by capillary action.
X-ray powder diffraction (XRD) patterns were obtained by a Rigaku D/max-IIIB diffractometer using Cu Kα radiation (λ = 0.15406 nm). Scanning electron microscopy (SEM) images were recorded using a Hitachi S-4800 instrument operating at 15 kV. The amount of adsorbed dye was measured by immersing dye-sensitized photoelectrodes in a 0.02 M NaOH solution in alcohol and water (volume ratio 1:1) for 6 h. Then the resulting solution was quantified with the UV-vis spectrophotometer (Shimadzu UV-2550, Kyoto, Japan).
Photocurrent–photovoltage curves (J–V) were recorded by a BAS100B electrochemical analyzer (Bioanalytical Systems Inc., West Lafayette, Indiana). A 400 W xenon lamp with a UV filter was used as the light source. Its illumination intensity was about 40 mW cm−2. The irradiation area of DSSCs was about 0.12 cm2. The EIS were performed with a computer-controlled IM6e impedance measurement unit (Zahner Elektrik, Kronach, Germany). EIS were obtained by applying sinusoidal perturbations of 10 mV over the V oc at the frequency range from 0.05 to 100 kHz. All EIS measurements were carried out under illumination of 10 mW cm−2. The obtained spectra were fitted with ZsimpWin software in terms of appropriate equivalent circuits.
III. RESULTS AND DISCUSSION
The formation of TiO2 nanotube arrays in the electrolyte containing fluoride ion is a result of the interactions between three simultaneously occurring processes, namely the electrical field assisted oxidation of Ti metal to form TiO2, the field assisted dissolution of Ti metal ions into the electrolyte, and the chemical dissolution of Ti and TiO2 due to fluoride ion etching, which is substantially enhanced by the presence of H+ ion. So, the concentrations of H+ and F− ions are the important parameters for obtaining well-ordered TiO2 nanotube arrays.Reference Mor, Shankar, Paulose, Varghese and Grimes28
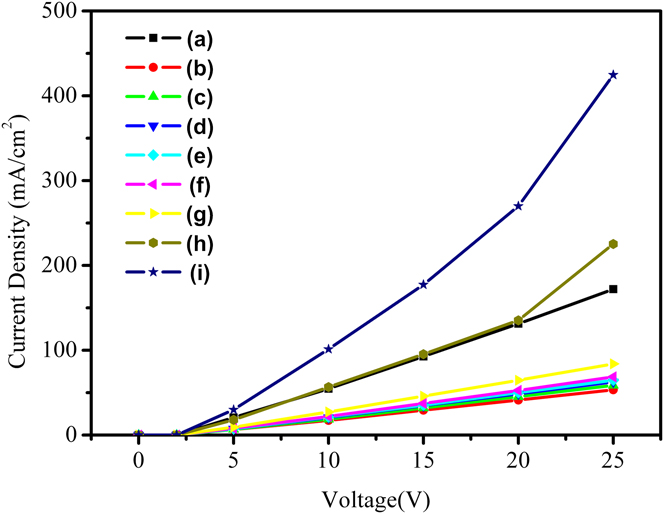
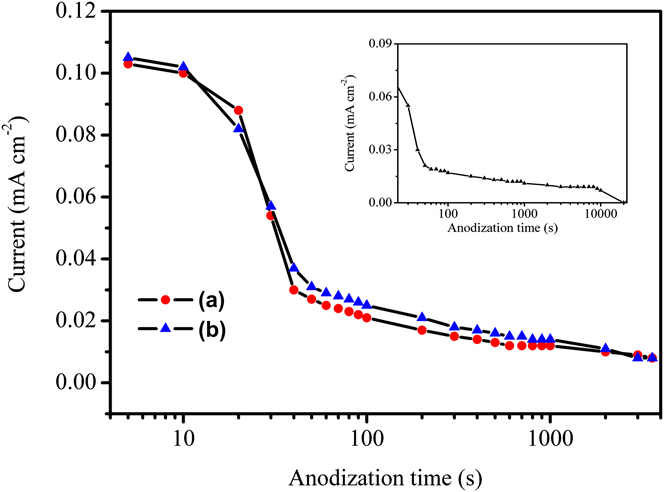
The current voltage behavior of HF solutions and electrolyte containing fluoride ion with different water content was probed at 22 °C under DC conditions using planar platinum electrodes with a measured cell constant of 2.5 (ratio of the distance between the two electrodes divided by their area) and readings were recorded; these data are shown in Fig. 1. It can be clearly seen that the current density of electrolyte containing fluoride ion increased with the increase of water content in it. And the current density of HF solution is similar to that of electrolyte containing fluoride ion with 40% water content when the applied bias is lower than 20 V. More water content in the electrolyte results in faster dissolution of Ti metal ions. This means that water content in the electrolyte has an important impact on the field-assisted dissolution of Ti metal ions. So, the HF solution and electrolyte containing fluoride ion with water content of 3% and 4% have been selected for preparation of TiO2 nanotube arrays with controlled aspect ratio in the potentiostatic anodization process. The growth of TiO2 nanotube arrays was studied in fluoride-bearing electrolytes containing different water content while maintaining similar molar concentrations of the chemical species. This ensured that each electrolyte had the same concentration of fluoride ions, thus allowing us to observe the effect of the water content on nanotube growth. Meanwhile, the effect of different anodization time on the growth of TiO2 nanotubes was also studied. Figure 2 shows the real-time potentiostatic anodization behavior of Ti anodized at 20 V in formamide solutions containing 0.27 M of NH4F with different water content and different anodization time, respectively. In the HF solution, the anodization current drops sharply from a high value into a low value during the first 5 s of anodization time. Then, the anodization current increases to reach a stable value after approximately 500 s (Fig. S1). In the first anodization stage, the formation of insulation TiO2 oxide layer results in decrease of current. Then, pitting the oxide layer by fluoride ions occurs, which makes the current increase to a stable value. On the other hand, the anodization current in the electrolytes containing formamide remains relatively constant during the first 20–30 s of anodization. The region of stable current extends for a longer period of time in electrolytes containing a smaller concentration of water. Then the current decreases monotonically to reach a stable value. During the initial anodization period, the current is bigger and the escape of gas from the anode can be seen. Because the gas formation is an electronic charge transfer process, electronic conduction possibly dominates in the early anodization stage. The donation of oxygen is more difficult compared to water in organic electrolytes and this is not favorable to form TiO2 barrier layer. The reduction in water content results in thinner barrier layers, which maybe enhances the ionic transfer through them (Fig. 2). The faster ionic transfer rate is advantageous to faster movement of the Ti/TiO2 interface into the Ti substrate for the formation of a longer nanotube array. Longer anodization time also provides a greater driving force for both electronic and ionic conduction for longer nanotube length.
Current voltage behavior of HF solution (a) and electrolytes containing fluoride ion with different water content of 1% (b), 2% (c), 3% (d), 4% (e), 5% (f), 10% (g), 40% (h), 100% (i) probed by using planar platinum electrodes with a cell constant of 2.5 (ratio of the distance between the two electrodes divided by their area).

Current-time behavior during 20 V potentiostatic anodization of a Ti foil in a formamide solution containing identical molar concentrations (0.27 M) of fluoride ion with controllable H2O content of 3% (a), 4% (b) for 1 h. Inset: Current-time behavior during 20 V potentiostatic anodization of a Ti foil in a formamide solution containing identical molar concentrations (0.27 M) of fluoride ion with controllable H2O content of 3% for 6 h.

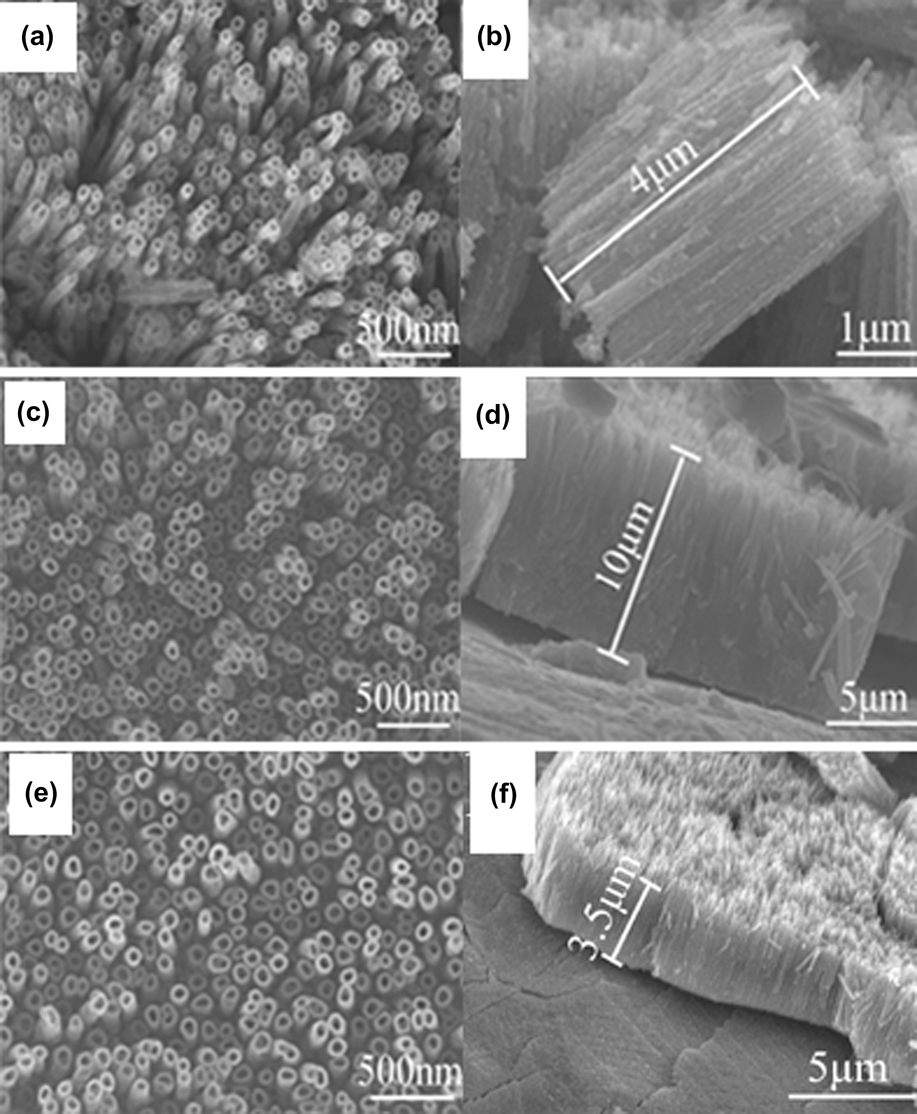
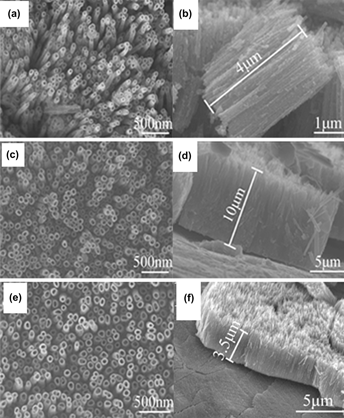
The surface morphology is a function of anodization time in electrolytes containing different water content. SEM images of the anodic TiO2 films formed in the 0.27 M ammonium fluoride in formamide solution containing different water content (3% and 4%) for different anodization time are shown in Fig. 3. It can be seen that the TiO2 nanotube arrays with the pore diameter remaining roughly constant (approximately 100 nm) have been obtained [Figs. 3(a), 3(c), and 3(e)]. Anodization in HF solution can only obtain similar nanotube array with similar pore diameter (Fig. S2). By controlling the water content (3% and 4%) in the electrolyte, the nanotube array with a length of 4 µm and 3.5 µm (aspect ratio of 40 and 35) can be obtained, respectively [Figs. 3(b) and 3(d)]. As the water content increases in organic electrolyte, the length of TiO2 nanotube arrays decreased. Meanwhile, by changing the anodization time to 6 h in formamide solution with water content of 3%, the nanotube array with a length of 10 µm (aspect ratio of 100) can also be fabricated [Fig. 3(f)]. But in HF solution, short TiO2 nanotube array with approximately 0.2 μm length could be obtained according to the report of Ref. Reference Shankar, Mor, Fitzgerald and Grimes26 , As the H+ concentration is different due to different water content in the formamide-based electrolyte, the chemical dissolution rate of TiO2 is different, and thus a long nanotube structure with different lengths can form. However, in the HF electrolyte solution, the high H+ concentration will make the chemical dissolution of TiO2 by fluoride ions very quick, resulting in a short nanotube. Anyway, by controlling the water content and anodization time, the TiO2 nanotube arrays with different lengths and aspect ratios (40, 35, and 100) have been obtained.
Top view and cross-sectional images of TiO2 nanotubes arrays prepared by anodizing Ti foil at 20 V in formamide-based electrolyte with water content 3 wt% for 1 h (a, b), 3 wt% for 6 h (c, d) and formamide-based electrolyte with water content of 4 wt% for 1 h (e, f).

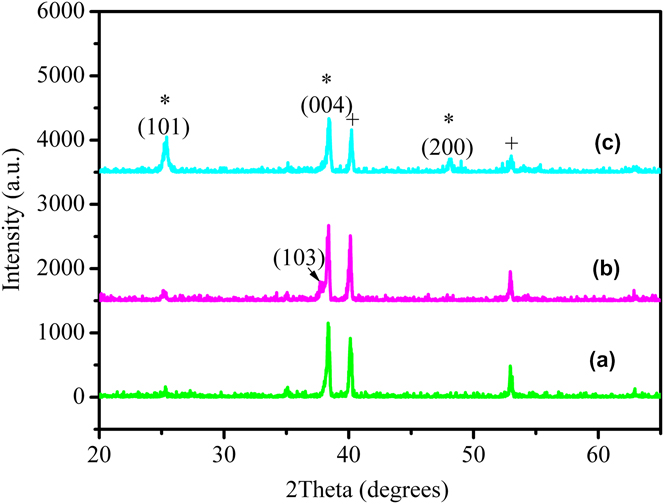
Figure 4 shows the typical XRD patterns of as-prepared TiO2 nanotube array samples with different lengths, respectively. After being annealed at 500 °C under ambient air for 3 h, the anatase TiO2 pattern is formed, whose diffraction peaks at 25.5°, 37.3°, 38.1°, and 48.2° of 2θ correspond to (101), (103), (004), and (200) plane of anatase TiO2 (JCPDS, No. 21-1272). All the obtained TiO2 nanotube arrays show high crystalline degree after annealed.
X-ray diffraction patterns of TiO2 nanotube arrays with tube lengths of 4 µm (a), 3.5 µm (b), and 10 µm (c) (*: anatase phase diffraction patterns; +: Ti foil diffraction patterns).

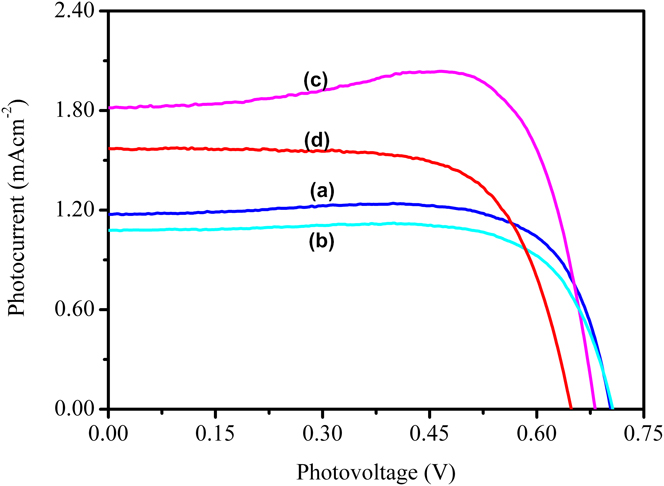
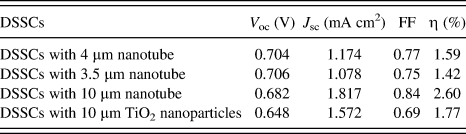
The current density–voltage (J–V) characteristics for the masked DSSCs with different lengths TiO2 nanotube array photoelectrodes are presented in Fig. 5. The values of open circuit voltage (V oc), short-circuit current (J sc), fill factor (FF), and overall conversion efficiency (η), obtained from the curves of solar cells, are shown in Table I. Each value for cell performance is determined as an average of at least three samples. The DSSCs based on TiO2 nanotube array photoelectrodes with lengths of 3.5 µm, 4 µm, and 10 μm have η of 1.42%, 1.59%, and 2.60%, respectively. It can be clearly seen that the η increases with increasing nanotube length. Compared with η of the DSSCs based on the TiO2 NP photoelectrode on Ti foil (1.77%), the DSSCs based on TiO2 nanotube array photoelectrodes with length of 10 μm have higher η. This is due to the well-ordered nanotube array structure, which can accelerate the photogenerated electron transfer into the out circuit. However, because of the illumination at the backside, the η of these devices is relatively lower compared with the illumination at the front side. The Pt-coated counter electrodes partially reflect light, and the redox shuttle electrolyte absorbs photons in the near-UV region, which decreased light harvesting.
J–V curves of DSSCs based on the ordered TiO2 nanotube array photoelectrodes with tube lengths of 4 µm (a), 3.5 µm (b), 10 µm (c) and photoelectrode with TiO2 NPs coated on Ti foil (d).

Solar cell parameters of DSSCs based on TiO2 nanotube array photoelectrodes and coated-on Ti foil TiO2 nanoparticle photoelectrode.

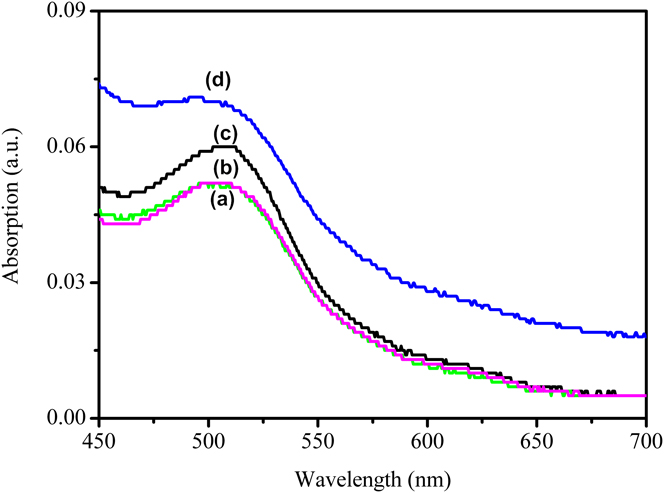
It is believed that the photoelectrochemical properties of DSSCs are correlated with the dye adsorption amount and interface charge transfer rate.Reference Pan, Dong, Tian, Zhou, Tian, Zhao and Fu29 More dye adsorption amount and faster interfacial charge transfer will result in higher η. The dye loading/unloading measurement is carried out to determine the dye adsorption amount. According to Lambert–Beer’s law, the molar concentration of dye unloading from TiO2 nanotube arrays with lengths of 3.5 µm, 4 µm, 10 µm and NP photoelectrode on Ti foil is 1.9, 1.9, 2.3, and 2.6 × 10⁻⁸ mol cm−2, respectively (Fig. 6). Although the TiO2 nanotube arrays have lower dye adsorption amount than TiO2 NP photoelectrode, DSSC based on TiO2 nanotube arrays with the length of 10 µm has better η than DSSC based on NP photoelectrodes. Therefore, we do not think the improved η results from the amount of adsorbed dye molecules. This demonstrates that the length and aspect ratio of TiO2 nanotube arrays play a significant role in determining the η of DSSCs. The choice of TiO2 nanotube array structures with a proper length and aspect ratio can effectively improve the performance of DSSCs. In the following, we used EIS to investigate the interfacial charge transport rate in TiO2 nanotube array structures.
Optical absorbance of solutions containing dyes detached from the well-ordered TiO2 nanotube arrays with tube lengths of 4 µm (a), 3.5 µm (b), 10 µm (c), and photoelectrode with TiO2 NPs coated on Ti foil (d), respectively.

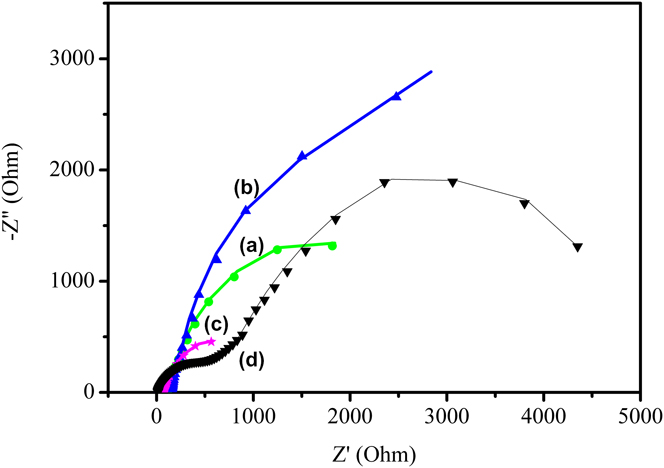
EIS is one of the powerful tools to investigate internal resistances of DSSCs that reflect the charge transfer process. DSSC is a complex system composed of several interfaces. A high electron accumulation must have occurred under illumination. Electron transport and recombination in photoelectrode, charge transfer process at Pt counter electrode, and the diffusion constant of I 3− can all be studied by EIS.Reference Longo, Nogueira, De Paoli and Cachet30 Usually, the impedance at low frequency (0.05–1 Hz) corresponds to the Nernst diffusion of I 3−/I− within the electrolyte. The impedance at high frequency (1–100 kHz) in the impedance spectra corresponds to the capacitance and charge-transfer resistance at the Pt | I 3−/I− electrolyte interface. The medium-frequency response at 1–1 kHz is associated with the photoelectrode-dye | I 3−/I− electrolyte interface, where an accumulation of photoelectrons is expected. Figure 7 shows the Nyquist diagrams of the impedance spectra of DSSCs based on TiO2 nanotube arrays with lengths of 3.5 µm, 4.0 µm, 10 µm and TiO2 NPs on Ti foil under illumination of 10 mW cm−2.
Nyquist diagrams of the impedance spectra of DSSCs based on TiO2 nanotube array photoelectrode with lengths of 4 µm (a), 3.5 µm (b), 10 µm (c) and DSSC based on photoelectrode with TiO2 NP coated on Ti foil (d).

In general, the Nyquist diagram obtained under light intensity of 100 mW cm−2 exhibits three semicircles, which corresponds to three frequency ranges. However, in this experiment, only the semicircles at middle and high frequencies are observed, associated with the dye-sensitized photoelectrode | I 3−/I− electrolyte interface and the Pt | I 3−/I− electrolyte interface resistance, respectively. The semicircle at low frequency region merges with the semicircle at the middle frequency region due to weak light intensity.Reference Pan, Dong, Tian, Zhou, Tian, Zhao and Fu29
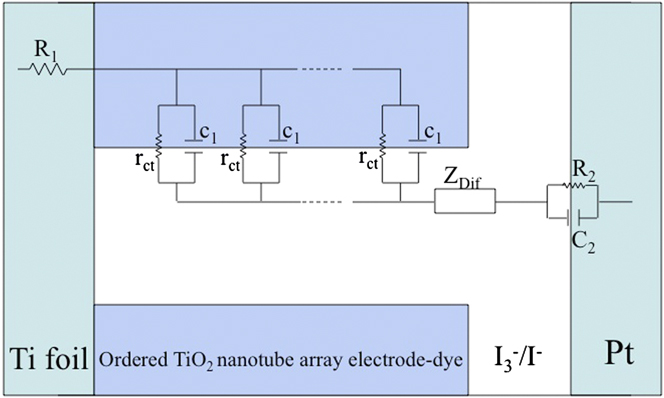
The equivalent model fitting the impedance spectra of DSSCs based on TiO2 nanotube arrays with lengths of 3.5 µm, 4.0 µm, 10 µm and TiO2 NPs on Ti foil is shown in Fig. 8. The symbols of R and C represent a resistance and a capacitance, respectively. R 1 is a series resistance standing for the transport resistance between the Ti foil and TCO electrode. If the thickness of the TiO2 nanotube arrays is L, the R ct (=r ct/L) represents the charge transfer resistance between photoelectrode and I 3−/I − in electrolyte. C 1 (=c 1L) is the chemical capacitance of the TiO2 nanotube array photoelectrode that accounts for the change of electron density as a function of the Fermi level. Z Dif represents the Warburg impedance relative to the Nernst diffusion of I 3− in electrolyte, where the impedance of the finite-length Warburg diffusion can be expressed by
 $${Z_{{\rm{Dif}}}} = {R_{{\rm{Dif}}}}\left\{ {{{\left[ {\tanh {{\left(\, {jw{\rm{\tau }}} \right)}^{1/2}}} \right]} \mathord{\left/ {\vphantom {{\left[ {\tanh {{\left( {jw{\rm{\tau }}} \right)}^{1/2}}} \right]} {{{\left( {jw{\rm{\tau }}} \right)}^{1/2}}}}} \right. \kern-\nulldelimiterspace} {{{\left(\, {jw{\rm{\tau }}} \right)}^{1/2}}}}} \right\}$$
where R Dif = B/Y O1, τ = B 2, B is the parameter. R 2 and C 2 are the charge-transfer resistance and double-layer capacitance at the counter electrode, respectively.
The equivalent model used to represent interfaces in DSSCs composed of Ti foil | ordered TiO2 nanotube array photoelectrode-dye | I 3−/I − || Pt | TCO.

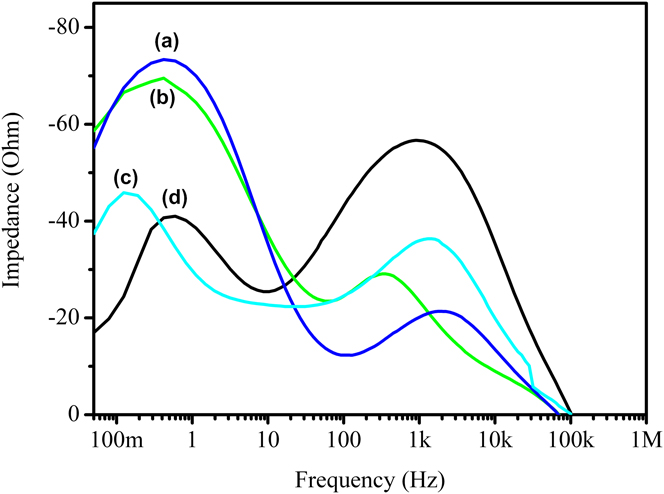
The EIS data are obtained by fitting the impedance spectra of DSSCs based on TiO2 nanotube arrays with lengths of 3.5 µm, 4.0 µm, 10 µm and TiO2 NPs on Ti foil. R ct represents interfacial resistance of the dye-sensitized photoelectrode | I 3−/I − electrolyte interface. Less interface resistance will result in faster interfacial electron transfer, which favors the higher η. Among them, the DSSCs based on 10 µm TiO2 nanotube arrays display the fastest electron transfer rate (52 Ω), and thus the highest η. When the well-ordered TiO2 nanotube arrays are used as photoelectrodes, and the photoelectrons tend to undertake a convenient transfer path. That is, electrons transfer through the TiO2 nanotube array into the external circuit, which would reduce the probability that the photoelectrons are trapped by the NP boundary. So the R ct decreases. But, when the TiO2 NPs on Ti foil are used as photoelectrode, more particle boundaries are formed. More particle boundaries would result in the photoelectrons trap during the transport, so the R ct increases (272 Ω). These results are also supported by their corresponding Bode diagrams (Fig. 9). The position of the characteristic frequency peak is shifted to a lower frequency (from 0.48 to 0.12 Hz). Any shift of the peak from high frequency to low frequency reveals a more rapid electron transport process due to longer electron lifetime (τ), because the value (f mid) of the middle frequency is related to the inverse of τ as follows: τ = 1/(2πf mid). For the DSSCs based on the TiO2 nanotube array with length of 10 µm, longer electron lifetime (1.28 s) is obtained compared with 0.42 s for the DSSCs based on the TiO2 NPs on Ti foil, 0.38 s for the DSSCs based on 4 µm nanotube array and 0.33 s for the DSSCs based on 3.5 µm nanotube array. Therefore, the Nyquist and Bode diagrams show that increasing nanotube array length could greatly improve the electrochemical activity due to the prolonged τ. In other words, the electrons with longer τ can obtain longer effective diffusion length and more easily escape the electron recombination. These results are in accordance with photoelectrical conversion efficiency data discussed above.
Bode diagrams of the impedance spectra of DSSCs based on TiO2 nanotube array photoelectrode with length of 4 µm (a), 3.4 µm (b), 10 µm (c) and photoelectrode with TiO2 NP coated on Ti foil (d).

IV. CONCLUSIONS
In this present work, the conversion efficiency of DSSCs was improved by using well-ordered TiO2 nanotube array photoelectrode with long nanotube length, which can effectively increase the photoelectron transfer and reduce the recombination of DSSCs. The nanotube length of TiO2 nanotube array photoelectrode is demonstrated to have a significant influence on the η of DSSCs. The cell based on the TiO2 nanotube array photoelectrode with nanotube length of 10 µm achieves the highest η of 2.60%, superior to 1.77% of the TiO2 NPs on Ti foil cells. Such an improved η of the TiO2 nanotube array cells with nanotube length of 10 µm is ascribed to the fastest interfacial electron transfer and longer electron lifetime, as evidenced by the measurement of the EIS.
Supplementary Material
To view supplementary material for this article, please visit http://dx.doi.org/10.1557/jmr.2014.50.
ACKNOWLEDGMENTS
This work was supported by the National Natural Science Fund of China (Grant Nos. 51302047, 51072038, 51272050, and 61205113), the Program for New Century Excellent Talents in University (NECT-10-0049), the Outstanding Youth Fund of Heilongjiang Province (Grant No. JC201008), the 111 project (B13015) of Ministry Education of China to the Harbin Engineering University, and also the Fundamental Research Funds for the Central Universities of China for the financial support of this research.