INTRODUCTION
Numerous mechanisms have been proposed to explain coexistence of tree species in tropical forests at local scales (Wright Reference WRIGHT2002). Niche differentiation with respect to resources remains a prominent hypothesis to account for the maintenance of tree species diversity in tropical forests (Harms et al. Reference HARMS, CONDIT, HUBBELL and FOSTER2001). However, mechanisms based on neutral theories, where ecological drift is the main force structuring species-rich communities, and speciation is one of the stochastic processes involved in this drift (Hubbell Reference HUBBELL2001), can also form patterns of distribution and abundance similar to those found in nature (Chave Reference CHAVE2004, Mouquet & Loreau Reference MOUQUET and LOREAU2003, Purves & Pacala Reference PURVES, PACALA, Burslem, Pinard and Hartley2005).
Congeners may utilize a similar set of resources in a similar way (Ackerly & Donoghue Reference ACKERLY and DONOGHUE1998, Mooney et al. Reference MOONEY, JONES and AGRAWAL2008) if traits are phylogenetically conserved among species in a particular plant community (Ashton et al. Reference ASHTON, BROKAW, BUNYAVEJCHWIN, CHUYONG, CO, DATTARAJA, DAVIES, ESUFALI, EWANGO, FOSTER, GUNATILLEKE, GUNATILLEKE, HART, HERNANDEZ, HUBBELL, ITOH, JOHN, KANZAKI, KENFACK, S., LAFRANKIE, LEE, LIENGOLA, MAKANA, MANOKARAN, NAVARETTE HERNANDEZ, OHKUGO, PEREZ, PONGPATTANANURAK, SAMPER, SRI-NGERNYUANG, SUKUMAR, SUN, SUREH, TAN, THOMAS, THOMPSON, VALLEJO, VILLA MUNOZ, VALENCIA, YAMAKURA, ZIMMERMAN, Losos and Leigh2004, Swenson et al. Reference SWENSON, ENQUIST, THOMPSON and ZIMMERMAN2007) and experience relatively intense interspecific competition that limits their coexistence (Mooney et al. Reference MOONEY, JONES and AGRAWAL2008, Webb et al. Reference WEBB, ACKERLY, MCPEEK and DONOGHUE2002). Many congeners are found to coexist in both tropical forest and temperate forest (Davies et al. Reference DAVIES, PALMIOTTO, ASHTON, LEE and LAFRANKIE1998, Queenborough et al. Reference QUEENBOROUGH, BURSLEM, GARWOOD and VALENCIA2007, Tanaka et al. Reference TANAKA, SHIBATA, MASAKI, IIDA, NIIYAMA, ABE, KOMINAMI and NAKASHIZUKA2008). Davies et al. (Reference DAVIES, PALMIOTTO, ASHTON, LEE and LAFRANKIE1998) compared 11 species of Macaranga (Euphorbiaceae) in a tropical rain forest in Borneo, and concluded that heterogeneity of resource availability resulted in differences in tree distribution, which is important for their coexistence. However, Queenborough et al. (Reference QUEENBOROUGH, BURSLEM, GARWOOD and VALENCIA2007) compared 16 species of Myristicaceae in a tropical rain forest in Amazonian Ecuador, and found no evidence that partitioning of physical habitats could explain the coexistence of all 16 closely related species.
Previous studies using principal coordinates neighbour matrices (PCNM) method shows that topography can explain more than 20% of the total variation of dominant species abundance in tropical seasonal rain forest in Xishuangbanna, south-west China (Lan et al. Reference LAN, HU, CAO and ZHU2011), which gives support for niche partitioning in facilitating species coexistence in this tropical forest. However, we still have no idea about how topography (first-order effects) affects the distribution pattern of congeners. Lan et al. (Reference LAN, GETZINC, WIEGAND, HU, XIE, ZHU and CAO2012) found that it is notable that a high number of positive associations were found in dominant species. An interesting question is therefore how often do two congeneric species show positive association at scales above the typical scale at which plant-plant interactions (second-order effects) occur. Our objective is finding evidence that both environment and biotic interactions are facilitating coexistence of congeneric species in tropical seasonal rain forest in Xishuangbanna. We tested the hypotheses that both niche partitioning and stochastic (i.e. neutral) processes could play an important role in structuring the coexistence of congeneric species in this region.
METHODS
Study site
The study site was located in the Xishuangbanna National Nature Reserve in Yunnan province, south-west China (101°34′E, 21°36′N). Xishuangbanna is included in the Indo-Burma biodiversity hotspot and contains over 5000 species of vascular plant, comprising 16% of China's total plant diversity (Cao & Zhang Reference CAO and ZHANG1997, Myers Reference MYERS1988). The tropical seasonal rain forest in Xishuangbanna, is the most important vegetation type and harbours biodiversity that is important both for global and national species richness in China. This region is dominated by a typical monsoon climate with an alternation between a dry season and a rainy season. The mean annual temperature is 21.0°C, and the mean annual precipitation is 1532 mm, of which approximately 80% occurs between May and October.
Data collection
A 20-ha permanent forest plot was established in the Xishuangbanna National Nature Reserve in 2007 following the field protocol of the Center for Tropical Forest Science and Forest Global Earth Observatories (CTFS-ForestGEO) (Condit Reference CONDIT1998). The plot measures 400 m (north-south) by 500 m (east-west). The altitude ranges from 709 m to 869 m asl with a mean of 765 m asl; the highest altitude occurs in the north-west corner of the plot. The forest occurs mainly on laterite and lateritic red soils with pH values ranging from 4.5 to 5.5 (Zhu Reference ZHU2006). All trees (≥ 1 cm in diameter at breast height, dbh) were mapped and tagged with unique numbers. The emergent layer consists largely of the species Parashorea chinensis Hsie Wang; the main canopy layer, contains trees up to 30 m high with almost continuous crowns and is dominated by Sloanea tomentosa (Benth.) Rehd. & Wils., Pometia tomentosa (Bl.) Teysm. & Binn., Semecarpus reticulata Lecte. and Barringtonia pendula (Griff.) Kurz (Lan et al. Reference LAN, GETZINC, WIEGAND, HU, XIE, ZHU and CAO2012, Zhu Reference ZHU2006).
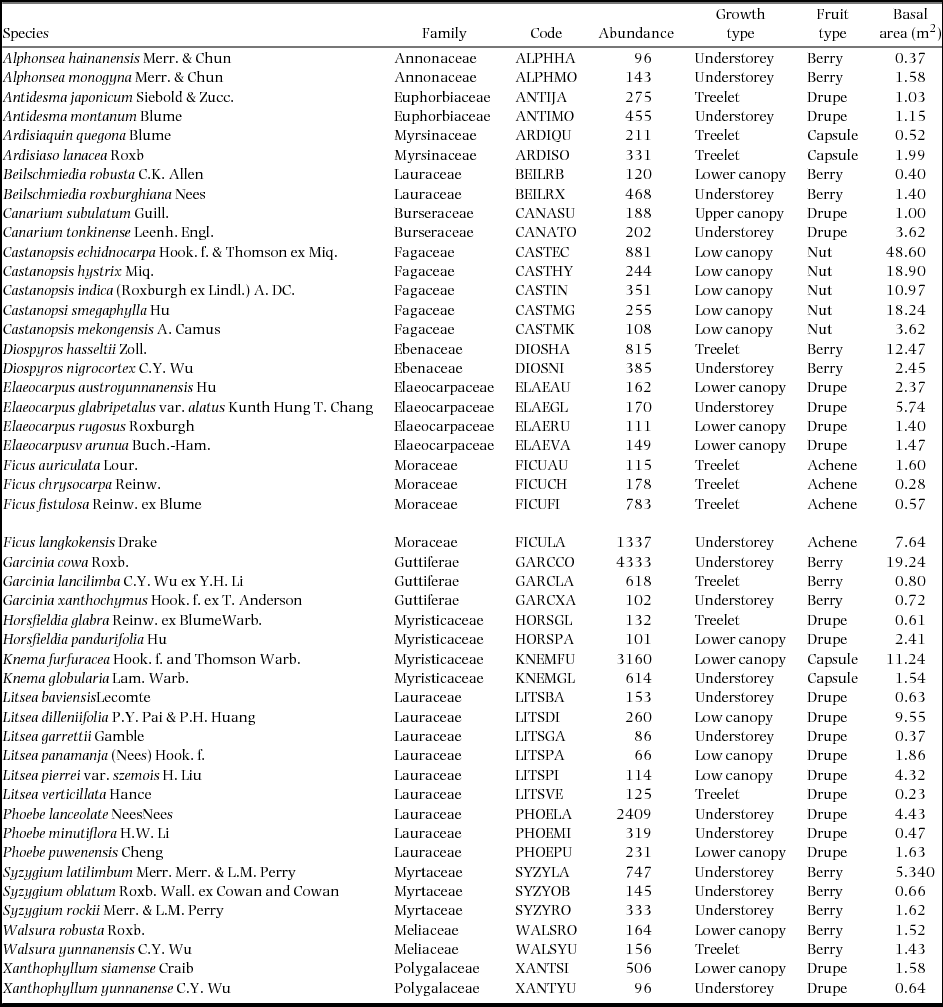
We selected the top 48 tree species with the largest number of individuals for our analysis. And these species comprised more than 24.5% of the total individuals (95498) and 26.0% of the total basal area (835 m2) of trees ≥ 1.0 cm dbh. Species abbreviations are shown in Appendix 1. In order to investigate the species distribution patterns and how the species associations change across life stages, we classified the individuals of each species into the two life stages: saplings (1 to ≤ 5 cm dbh) and large trees (> 5 cm dbh).
Species habitat association
Three topographic attributes were measured in the field: altitude, slope and convexity for the 20 × 20-m cells. Following Harms et al. (Reference HARMS, CONDIT, HUBBELL and FOSTER2001), altitude of a cell was defined as the mean of the altitude values at its four corners. Convexity was the altitude of the cell of interest minus the mean altitude of the eight surrounding cells. For the edge cells, convexity was the altitude of the centre point minus the mean of the four corners (Legendre et al. Reference LEGENDRE, MI, REN, MA, YU, SUN and HE2009). We divided the habitat into six types, namely: (1) valley (slope < 27.1º; altitude < 765 m asl), (2) hillside (slope > 27.1º; altitude < 765.0 m asl), (3) hilltop (slope ≥ 27.1º, altitude ≥ 765 m asl, convexity > 0), (4) high-gully (slope ≥ 27.1º, altitude ≥ 765 m asl, convexity < 0), (5) high-plateau (slope < 27.1º, altitude ≥ 765 m asl, convexity > 0) and (6) gap (with a total open area greater than 200 m2) (Figure 1). In order to control for the effects of dispersal limitation, we used torus-translation tests (Harms et al. Reference HARMS, CONDIT, HUBBELL and FOSTER2001) to assess potential association of the spatial patterns of species with different topographic habitats. The tests assess the similarity between the spatial structure of each focal species population and each habitat. For each species, the observed relative densities of stems in each of the habitats were compared with expected relative densities. To obtain the expected values, the true habitat map was shifted about a two-dimensional torus by 20-m increments to exhaustively produce all possible 20-m translations of the true habitat map in the four cardinal directions. Each of the 500 maps provided an estimate of the expected relative density. A species was significantly positively associated with a particular habitat if its relative density in the true habitat map was > 97.5% of the values obtained from translated maps. A significant negative association occurred if the relative density in the true map was < 97.5% of the values from translated maps. We used the 161 tree species with a density≥ 66 individuals for the torus-translation tests.
Habitat of the 20-ha permanent plot of tropical seasonal rain forest in Xishuangbanna, south-west China. Valley: slope < 27.1º, altitude < 765 m asl; Hillside: slope > 27.1º, altitude < 765 m asl; hilltop: slope ≥ 27.1º, altitude ≥ 765 m asl, convexity > 0; High-gully: slope ≥ 27.1º, altitude ≥ 765 m asl, convexity < 0; High-plateau: slope < 27.1º, altitude ≥ 765 m asl, convexity > 0; Gap: with a total open area greater than 200 m2.

Classification scheme of large-scale first-order association
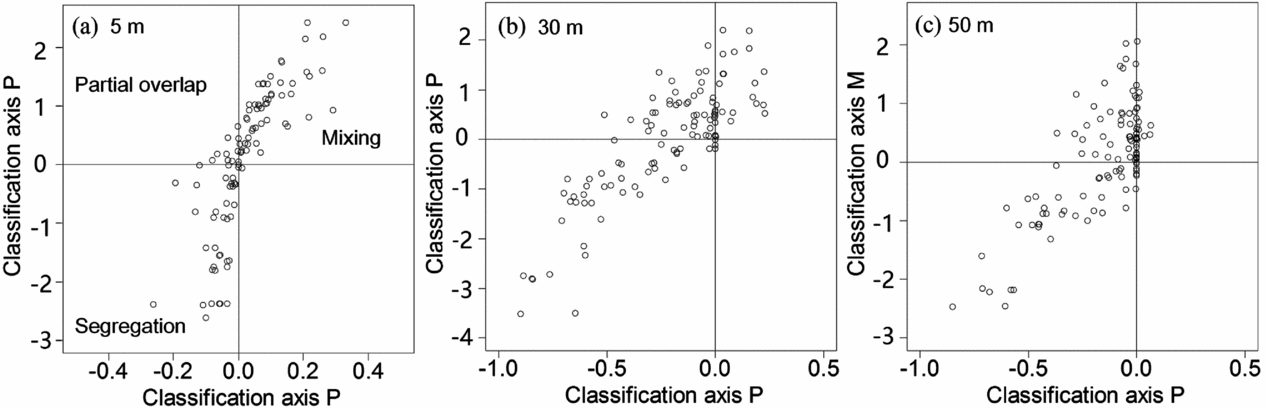
First-order effects caused by specific habitat associations mediate second-order effects caused by intraspecific and interspecific associations. So, we used a simple scheme to classify first-order association of bivariate heterogeneous patterns (Wiegand et al. Reference WIEGAND, GUNATILLEKE and GUNATILLEKE2007). The distribution function P 12 (n, r) that gives the probability of finding n trees of species 2 within neighbourhoods of radius r around trees of species 1, which can be used to describe the spatial association between two species. If the point configurations between pairs of trees of the two species are the same all over the study plot except for stochastic variation (i.e. homogeneous patterns), the mean of P 12 (n, r) with respect to n suffices, which is given by λ 2K 12(r). The same value of the mean (i.e. λ 2K 12 (r)) may arise for substantially different situations, e.g. if (1) all trees of species 1 have more or less the same number of neighbours of species 2 (i.e. a homogeneous pattern) or if (2) a few trees of species 1 have many species-2 neighbours but many trees of species 1 have no species-2 neighbours (an extremely heterogeneous pattern). We selected the value of the distribution P 12 (n, r) at n = 0 as an additional summary statistic. P 12 (n = 0, r) is the probability that a tree of species 1 has within distance r no neighbour of species 2, i.e. P 12 (n = 0, r) = 1−D 12 (r). Because the summary statistics K 12 (r) and D 12 (r) express fundamentally different properties of bivariate point patterns, they are a good choice for classifying different types of bivariate association. The expectations of the two summary statistics under the null model yield Dexp 12 = 1 − λ2πr 2 and K exp12(r) = πr 2, where the ‘exp’ superscript indicates expected by the null model of no spatial patterning. The two axes of the scheme are defined as:
 $$\begin{eqnarray}
\hat P\left( r \right) = \ {\hat D_{12}}\left( r \right) - \left( {1 - {\lambda _2}\pi {r^2}} \right),{\rm{\ }}M\left( r \right) = \ln \left( {\widehat{{{\hat K}_{12\ }}\left( r \right)}} \right)\nonumber\\
&& - \ln \left( {\pi {r^2}} \right)
\end{eqnarray}$$
We subtracted the theoretical values under the null model to move null association onto the origin of the scheme (i.e. no departure from the null model) and log-transformed the K-function in order to weight positive or negative departures from the null model in the same way. The scheme allows four different types of bivariate associations (Wang et al. Reference WANG, WIEGAND, HAO, LI, YE and LIN2010, Wiegand et al. Reference WIEGAND, GUNATILLEKE and GUNATILLEKE2007). The two patterns are segregated for  $\hat M( r )$< 0 and
 $\hat P( r )$ < 0 (segregation, type I). For
 $\hat M( r )$< 0 and
 $\hat P( r )$ < 0, the association is characterized by partial overlap (type II). For
 $\hat M( r )$> 0 and
 $\hat P( r )$ > 0, the two patterns occur within the same area (mixing; type III). There is a fourth type (
 $\hat M( r )$> 0 and
 $\hat P( r )$ < 0). Type-IV associations will rarely occur (Wiegand et al. Reference WIEGAND, GUNATILLEKE and GUNATILLEKE2007). More details can be obtained from Wiegand et al. (Reference WIEGAND, GUNATILLEKE and GUNATILLEKE2007) and Wang et al. (Reference WANG, WIEGAND, HAO, LI, YE and LIN2010).
Univariate plant–plant interaction
To reveal significant second-order effects in the univariate patterns (i.e. regularity and aggregation), we constructed the intensity function l (x, y) based on the pattern of the species under study and selected for all 48 species a bandwidth h = 30 m. This scale is slightly larger than typical scales at which local point-point interactions have been reported in tropical forests (Hubbell et al. Reference HUBBELL, AHUMADA, CONDIT and FOSTER2001, Peters Reference PETERS2003), but it is smaller than the range over which the environmental gradients may vary (Harms et al. Reference HARMS, CONDIT, HUBBELL and FOSTER2001, John et al. Reference JOHN, DALLING, HARMS, YAVITT, STALLARD, MIRABELLO, HUBBELL, VALENCIA, NAVARRETE, VALLEJO and FOSTER2007). We studied plant–plant interactions with a spatial resolution of 2 m up to 30 m.
Bivariate plant–plant interaction
To reveal significant second-order effects in the bivariate patterns (i.e. repulsion and attraction), we kept the location of the trees of the first species fixed and randomized the locations of the trees of the second species using a heterogeneous Poisson null model. Here the intensity function l 2 (x, y) was constructed based on pattern 2.
Again, we used a bandwidth h = 30 m and a spatial resolution of 2 m. This null model allowed us to assess whether pattern-2 points were more or less frequent around pattern-1 points than expected by the intensity of pattern 2, which would indicate attraction or repulsion, respectively. Note that we tested all pairs, that is, species 1 versus species 2 and species 2 versus species 1, since we cannot assume that the interaction will be symmetric (Vázquez et al. 2007).
Large-scale interspecific spatial associations
We used the null hypothesis that species 2 followed the intensity of species 1. The corresponding null model was again a heterogeneous Poisson null model where the locations of the trees of species 1 were fixed, but the locations of the trees of the second species were randomized in accordance with the intensity of species 1. In this analysis, we used a bandwidth of h = 50 m to estimate the intensity of species 1 and a spatial resolution of 5 m because we were interested only in larger-scale effects.
We performed 199 Monte Carlo simulations of the null model and used the fifth-lowest and fifth-highest simulated g(r) values as simulation envelopes. The 199 simulations generated sufficiently smooth simulation envelopes. Significant departure from the null model occurred at scale r if the empirical pair correlation function was outside the simulation envelopes. These simulations were used for all analyses and all analyses were performed using the Programita software (Wiegand & Moloney Reference WIEGAND and MOLONEY2004).
RESULTS
Species-habitat association
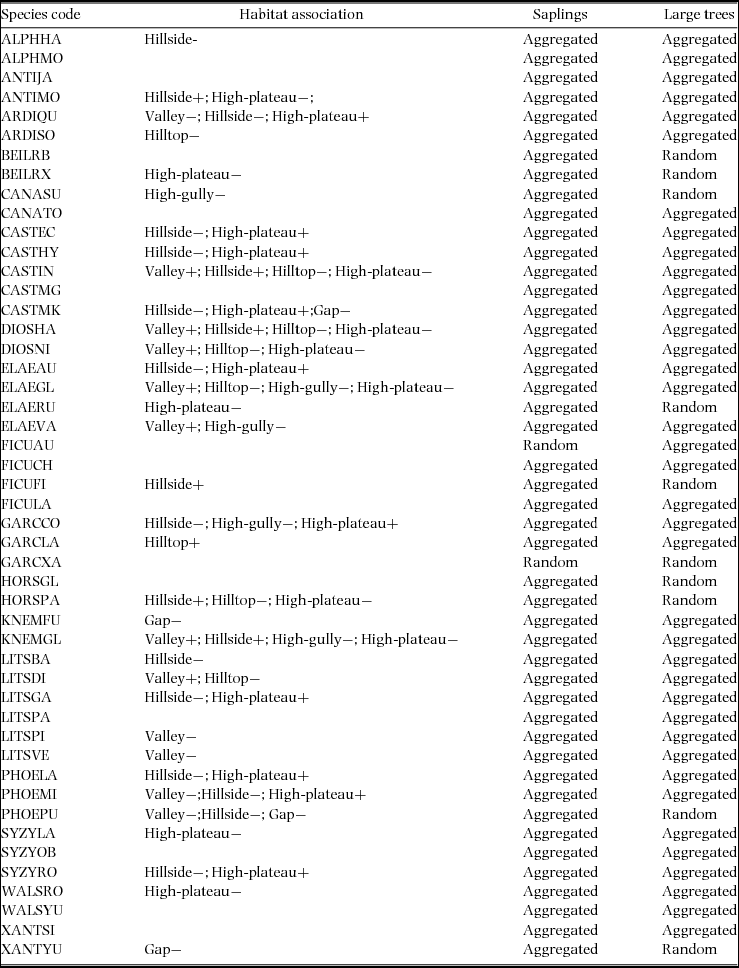
The torus-translation tests revealed that 34 of 48 (70.8%) species were either positively or negatively associated with at least one habitat (Appendix 2). For species association, there was a total of 112 congeneric species pairs among the 48 species. However, 10 (8.9%) of the total 112 species pairs shared similar habitats (Appendix 2). Both Castanopsis echidnocarpa and Castanopsis hystrix were negatively associated with hillside, but positively associated with high plateau. However, most congener pairs (103, 91.1%) did not share similar habitats. For example, Castanopsis indica was positively associated with valley and hillside, and negatively associated with hilltop and high plateau. However, Castanopsis mekongensis negatively associated with hillside and gap, and positively associated with high plateau. Litsea baviensis was negatively associated with hillside. Whereas, Litsea dilleniifolia was positively associated with valley and negatively associated with hilltop.
Classification scheme of bivariate associations
The various types of non-random effect in interspecific association were not equally distributed among the 112 species pairs analysed, and their relative frequency depended on scale (Appendix 3). The most notable result is that roughly half of the species pairs showed segregation at all three spatial scales analysed (55, 42 and 40 cases at scales of 5, 30 and 50 m, respectively). Thus, trees of different species co-occur less often than expected by chance. Interestingly, partial overlap was rare in the 5-m neighbourhood (eight cases), but more frequent in the 30-m and 50-m neighbourhoods (39 and 37 cases, respectively). Mixing occurred in 47 cases at the 5-m scale but only 27 and 20 times at the 30-m and 50-m scales respectively. For example, C. echidnocarpa and C. mekongensis were distributed together (mixing association), however, L. dilleniifolia and Litsea garrettii were segregated in the plot (segregation association) (Figure 2).
Classification of large-scale associations at a 30-m scale in the tropical seasonal rain forest in Xishuangbanan, south-west China. The allocation of the large-scale association of the112 species pairs based on the classification axes (a). Examples for type III association with mixing (b), type I association with segregation (c) and type II association with partial overlap (d). Red open circle: species 1, green open circle: species 2.
Species distribution patterns
We performed a total of 96 univariate point pattern analyses for the 48 species in 17 genera across size classes (Appendix 2, Figure 3a, b). For saplings with dbh < 5 cm, 46 of total species aggregated at scales 0–10 m, however, only two species (Ficus auriculata and Garcinia xanthochymus) showed random distribution pattern at such scales. However, 38 (79.2%) species (large trees) showed an aggregated distribution pattern at scales 0–10 m, and 10 (20.8%) species had a random distribution pattern. Generally speaking, more species showed aggregated distribution pattern than random distribution pattern at scales 0–10 m, and vice versa at scales larger than 10 m. Figure 4 shows the examples of distribution maps and spatial distribution pattern of univariate patterns.
Number of species (univariate) and species-species pairs (bivariate) where the observed pair-correlation function is for a given scale r outside the Monte Carlo simulation envelopes, being the fifth-lowest and fifth-highest values of the simulated g(r) of the 20-ha permanent plot of tropical seasonal rain forest in Xishuangbanna, south-west China. Univariate analyses of saplings (a); Univariate analyses of large trees (b); Small-scale bivariate analyses of saplings (c). Small-scale bivariate analyses of large trees (d).
Examples of distribution maps and spatial distribution pattern of univariate patterns (two species: Castanopsis echidnocarpa and Litsea baviensis) in the 20-ha permanent plot of tropical seasonal rain forest in Xishuangbanna, south-west China. Shown are the univariate g11 pair-correlation functions of the data in dependence on scale r (solid squares) and the simulation envelopes (solid lines) of the Monte Carlo simulations of the null modes. Monte Carlo confidence was constructed at approximately 95% confidence level (199 simulations). See Appendix 1 for species codes. Red open circle is saplings (1 to ≤ 5 cm dbh), and green open circle is large trees (>5 cm dbh). Distribution map of C. echidnocarpa (a); Univariate analyses of saplings of C. echidnocarpa (b); Univariate analyses of large trees of C. echidnocarpa (c), Distribution map of L. baviensis (d); Univariate analyses of saplings of L. baviensis (e); Univariate analyses of large trees of L. baviensis (f).
Species associations
For small-scale associations, we performed a total of 224 tests of species pairs among 48 species (Figure 3). For saplings, a total of 37 (33.0%) pairs of congeneric species were positively associated (attraction) at a scale of 0–5 m, however 18 (16.1%) species pairs were negatively associated (repulsion) at this scale. For large trees, a total of 22 (19.6%) species pairs were positively associated at 0–5 m, and 13 (11.6%) species pairs were negatively associated at this scale.
For large-scale association, we also performed a total of test of 224 species pairs. The results showed that a total of 29 (25.9%) pairs of congeneric species among saplings were positively associated (attraction) at the scale of 0–5 m, however 14 (12.5%) species pairs were negatively associated (repulsion) at this scale. For large trees, a total of 15 (13.4%) species pairs were positively associated, and 6 (5.4%) species pairs were negatively associated at this scale. Figure 5 shows examples for significant small-scale and large-scale interactions between Diospyros hasseltii and D. nigrocortex.
Examples for significant small-scale interactions and large-scale interactions across size class of the 20-ha permanent plot of tropical seasonal rain forest in Xishuangbanna, south-west China. Shown are the bivariate g12 pair-correlation functions of the data in dependence on scale r (solid squares), and the expected g12(r) function under the heterogeneous Poisson null model (open squares) and the Monte Carlo simulation envelopes (solid lines) of the null models. Monte Carlo confidence was constructed at approximately 95% confidence level (199 simulations). See Appendix 1 for species codes. Red small open circle: saplings (dbh ≤ 5) of Diospyros hasseltii; Red large open circle: large trees (dbh > 5) of D. hasseltii; Green small open circle: saplings (1 ≤ dbh ≤ 5) of Diospyros nigrocortex; Green large open circle: large trees (dbh > 5) of D. nigrocortex. Distribution map of D. hasseltii and D. nigrocortex (a); Small-scale bivariate analyses of saplings of D. hasseltii and D. nigrocortex (b); Small-scale bivariate analyses of large trees of D. hasseltii and D. nigrocortex (c); Large-scale bivariate analyses of saplings of D. hasseltii and D. nigrocortex (d); Large-scale bivariate analyses of large trees of D. hasseltii and D. nigrocortex (e).
DISCUSSION
Species habitat association
The topography of our site was very complex. In our plot, species habitat association test shows that 34 of the 48 studied species showed a significant relationship with at least one of the topographic variables. Our results further confirmed the results of Davies et al. (Reference DAVIES, PALMIOTTO, ASHTON, LEE and LAFRANKIE1998) that heterogeneity is important for the coexistence of congeners. In other words, the present study provides evidence of niche partitioning operating in congeners in a tropical seasonal rain forest. We also compared the results of torus translation of species habitat associations and found that 10 (8.9%) of the total species pairs shared similar habitats (Appendix 2), both C. echidnocarpa and C. hystrix were negatively associated with hillside, and L. baviensis and L. garrettii also were negatively associated with hillside, which would indicate that some congener traits are phylogenetically conserved (see growth type and fruit type in Appendix 1).
Classification scheme of bivariate associations
We found that all 45 (93.8%) species were significantly aggregated and that spatial segregation (36.6%) and partial overlap (34.8%) were the most common bivariate association types at the Xishuangbanna plot, which indicated first-order effects were strong (Wiegand et al. Reference WIEGAND, GUNATILLEKE and GUNATILLEKE2007) and gives support for niche partitioning in facilitating species coexistence. However, the percentage of mixing was 15.2%, which was much higher than a tropical forest in Sri Lanka (5.4% in Sri Lanka) (Wiegand et al. Reference WIEGAND, GUNATILLEKE and GUNATILLEKE2007). In particular, at scale 0–5 m there were 42 (37.5%) species pairs of mixing association. This also confirmed that some congeners may share similar habitats as stated above.
Spatial distribution pattern
The present study showed that aggregated patterns were also found for both saplings and large trees. This result is in accordance with the findings of many other studies (Condit et al. Reference CONDIT, ASHTON, BAKER, BUNYAVEJCHEWIN, GUNATILLEKE, GUNATILLEKE, HUBBELL, FOSTER, ITOH, LAFRANKIE, LEE, LOSOS, MANOKARAN, SUKUMAR and YAMAKURA2000, He et al. Reference HE, LEGENDRE and LAFRANKIE1997, Henriques & Desousa Reference HENRIQUES and DESOUSA1989). Aggregated distributions may result from limited seed dispersal (Grubb Reference GRUBB1977) or habitat heterogeneity (Harms et al. Reference HARMS, WRIGHT, CALDERON, HERNANDEZ and HERRE2000, Queenborough et al. Reference QUEENBOROUGH, BURSLEM, GARWOOD and VALENCIA2007). It is worth noting that some saplings did not aggregate more densely than larger trees. For example, saplings of Litsea pierrei had a random distribution pattern, while large trees had an aggregated distribution pattern. Species in which larger trees were more densely aggregated than juveniles are also suggestive of habitat-related patchiness, because adults might be collected in sites most favourable for the species, whereas juveniles are widely dispersed (Condit et al. Reference CONDIT, ASHTON, BAKER, BUNYAVEJCHEWIN, GUNATILLEKE, GUNATILLEKE, HUBBELL, FOSTER, ITOH, LAFRANKIE, LEE, LOSOS, MANOKARAN, SUKUMAR and YAMAKURA2000). This further confirmed that heterogeneity is important for distribution patterns of these congeners.
However, the positive or negative associations to the topographic habitats are more likely to cause larger-scale aggregation which was approximately factored out by the heterogeneous Poisson null model (Lan et al. Reference LAN, GETZINC, WIEGAND, HU, XIE, ZHU and CAO2012). Thus, other factors may be responsible for the strong small-scale clustering of saplings. For the genus Castanopsis, limited seed dispersal is considered the most likely explanation. In the present study, the congeneric Castanopsis species disperse their seeds by rodents (Wang et al. Reference WANG, AN, LENG, DING, ZHENG and CHEN2004, Zhang et al. Reference ZHANG, LI, WANG, CAI, YANG and CHEN2006). However, Litsea species may disperse their seeds by birds, which would contribute to the explanation of random distribution pattern at large-scale. Species whose seeds were dispersed by animals were assumed to be better dispersed than wind- or explosively dispersed species (Condit et al. Reference CONDIT, ASHTON, BAKER, BUNYAVEJCHEWIN, GUNATILLEKE, GUNATILLEKE, HUBBELL, FOSTER, ITOH, LAFRANKIE, LEE, LOSOS, MANOKARAN, SUKUMAR and YAMAKURA2000, Seidler & Plotkin Reference SEIDLER and PLOTKIN2006), this is why some saplings had random distribution pattern. Also, congeneric species may coexist within a community by adopting different regeneration niches (Yamada et al. Reference YAMADA, NGAKAN and SUZUKI2005). Canopy trees were assumed to have well-dispersed seeds relative to understorey treelets (Condit et al. Reference CONDIT, ASHTON, BAKER, BUNYAVEJCHEWIN, GUNATILLEKE, GUNATILLEKE, HUBBELL, FOSTER, ITOH, LAFRANKIE, LEE, LOSOS, MANOKARAN, SUKUMAR and YAMAKURA2000), this could be a possible reason why the saplings of canopy species L. pierrei have a random distribution pattern, while the saplings of the treelet Litsea verticillata showed a significant aggregated distribution pattern.
Species association of congeners
Neutral theory assumes that species are ecologically equivalent in their responses to all constraints and thus have no interspecific trade-offs (Hubbell Reference HUBBELL2001); it predicts that high species diversity could result from a balance between speciation and stochastic extinction caused by random drifts in population size (Hubbell Reference HUBBELL2001). Interestingly, we found that 51% of saplings of the species showed non-significant associations (68.8% for large trees). For large-scale associations, for saplings 61.6% of the species had non-significant associations (neither positive nor negative). For large trees the proportion is even greater at 81.2%. These proportions coincide with those shown in former studies such as those of Lieberman & Lieberman (Reference LIEBERMAN and LIEBERMAN2007), Wiegand et al. (Reference WIEGAND, HUTH, GETZIN, WANG, HAO, GUNATILLEKE and GUNATILLEKE2012) and Velázquez et al. (Reference VELÁZQUEZ, PAINE, MAY and WIEGAND2015), and suggest that stochastic (i.e. neutral) processes could play an important role in structuring this community.
The storage effect is a stochastic mechanism of coexistence, which also could produce the stochastic patterns (Chesson Reference CHESSON1984). In nature, environments vary substantial in time. Some of the variation is regular, some of it is stochastic. Environmental variation can contribute to coexistence if species have different competitive abilities under different microhabitat conditions (Sears & Chesson Reference SEARS and CHESSON2007).
In conclusion, our results show heterogeneity is important for the coexistence of congeners, which provides evidence of niche partitioning operating in congeners in a tropical seasonal rain forest. A large proportion of species showed non-significant associations, and suggests that stochastic (i.e. neutral) processes could play an important role in structuring this community. In short, both environments and biotic interactions structure congeneric species coexistence in tropical seasonal rain forest in Xishuangbanna, south-west China.
ACKNOWLEDGEMENTS
This project is supported by Key Laboratory of Tropical Forest Ecology, Xishuangbanna Tropical Botanical Garden, Chinese Academy of Sciences.
We thank Dr Keping Ma for making helpful suggestions and assistance in establishing the plot and data analysis. We are also grateful to all of the field workers who contributed to the tree species census of the 20-ha plot.
Species properties of the 48 species in 17 genera in the 20-ha permanent plot of tropical seasonal rain forest in China. Treelets include all species with adults generally less than 10 m tall; understorey trees are those with adults 10–20 m tall; lower canopy species have heights of 20–30 m; and upper canopy species are those often 30–45 m in height and emergent above the main canopy (> 45 m). Information on the heights of the tree species was from Zhu (Reference ZHU2006). Saplings (1 to ≤ 5 cm dbh), large trees (> 5 cm dbh).
Species habitat association (by using torus-translation test) and distribution pattern of the 48 species in the 20-ha permanent plot of tropical seasonal rain forest in China. Topographical types include valley (slope < 27.1º; altitude < 765 m), hillside (slope > 27.1º; altitude < 765 m), hilltop (slope ≥ 27.1º, altitude ≥ 765 m, convexity > 0), high-gully (slope ≥ 27.1º, altitude ≥ 765 m, convexity < 0), high-plateau (slope < 27.1º, altitude ≥ 765 m, convexity > 0) and gap (with a total open area greater than 200 m2). “+” indicates positive correlation; “−” indicates negative correlation; See Appendix 1 for species codes.
Classification of associations at the tropical seasonal rain forest of China. Allocation of the three scales association of 112 species-species pairs based on the classification axes. Axis P is positive (negative) if there are on average more (less) pattern-2 points at distance rL (5 m, 30 m, 50 m) from pattern-1 points than expected without first- and second-order effects, and axis M is positive L (negative) if the probability that a pattern 1 point has its nearest pattern-2 point within distance rL is larger (smaller) than expected. 5-m scale (a); 30-m scale (b); 50-m scale (c).