Introduction
The perception of non-native or second language (L2) speech contrasts is initially restricted by the phonological (Best, McRoberts & Sithole, Reference Best, McRoberts and Sithole1988) and the phonetic (Flege, Reference Flege and Strange1995; Werker & Tees, Reference Werker and Tees1984) properties of the native language. Because of this, L2 learners have difficulties perceiving segmental contrasts that do not occur in their L1, particularly if these contrasts assimilate to a single native category (Best, Reference Best and Strange1995) or are not acoustically salient (Burnham, Reference Burnham1986; Polka, Reference Polka1991). Improvement in perceiving L2 contrasts can occur, but it depends on the relation between the phonological and phonetic systems of the L2 and the L1 (Best, Reference Best and Strange1995; Flege, Reference Flege and Strange1995) as well as the amount and quality of L2 experience and the learning conditions of the L2 (Flege & Liu, Reference Flege and Liu2001).
Most L2 perception studies have investigated the perception of non-native phoneme contrasts. Much less is known on whether L2 acquisition can affect prosodic perception. The current study investigated an area in which effects of linguistic experience on perception have recently been demonstrated: the perception of rhythm and rhythmic grouping. Rhythm perception may be guided by universal biases (Hayes, Reference Hayes1995), which have been found to be affected by native language experience (Bhatara, Boll-Avetisyan, Agus, Höhle & Nazzi, Reference Bhatara, Boll-Avetisyan, Agus, Höhle and Nazziin press; Bhatara, Boll-Avetisyan, Unger, Nazzi & Höhle, Reference Bhatara, Boll-Avetisyan, Unger, Nazzi and Höhle2013; Crowhurst & Teodocio Olivares, Reference Crowhurst and Teodocio Olivares2014; Iversen, Patel & Ohgushi, Reference Iversen, Patel and Ohgushi2008). The current study investigated whether knowledge of an L2 with lexical stress alters rhythmic grouping in French listeners. French is an interesting case because it does not have lexical stress: there are no minimal pairs that are distinguished on the basis of stress placement. French just has fixed phrasal stress, which is assigned to the phrase-final syllable (Delattre, Reference Delattre1938; Di Cristo, Reference Di Cristo, Hirst and Di Cristo1998), and is acoustically marked by pitch (rising sentence-internally, and falling sentence-finally) and lengthening (Féry, Hörnig & Pahaut, Reference Féry, Hörnig, Pahaut, Gabriel and Lleó2011; Jun & Fougeron, Reference Jun, Fougeron and Botinis2000; Jun & Fougeron, Reference Jun and Fougeron2002; Welby, Reference Welby2006). The L2 used in the present study is German, which has variable and contrastive lexical stress (as illustrated by the presence of minimal pairs such as Party ‘party’ /ˈpaːˌtiː/vs. Partie ‘match’ / ˌpaːˈtiː/).
As yet, most evidence that prosodic properties are subject to perceptual reorganization comes from research on lexical stress, most of which, like the present study, focused on French and suggested that the lack of contrastive lexical stress has consequences for stress discrimination abilities: French monolinguals show lower accuracy than Spanish monolinguals (whose language uses contrastive lexical stress) in discriminating nonwords with different stress patterns (Dupoux, Pallier, Sebastian-Gallés & Mehler, Reference Dupoux, Pallier, Sebastian-Gallés and Mehler1997; Dupoux, Peperkamp & Sebastián-Gallés, Reference Dupoux, Peperkamp and Sebastián-Gallés2001; see also Peperkamp, Vendelin & Dupoux, Reference Peperkamp, Vendelin and Dupoux2010 for similar results on other languages also lacking contrastive lexical stress). This is particularly the case in tasks that pose higher demands on processing capacities and go beyond low-level acoustic processing by presenting stimuli with phonetic variability (Dupoux et al., Reference Dupoux, Pallier, Sebastian-Gallés and Mehler1997; Dupoux et al., Reference Dupoux, Peperkamp and Sebastián-Gallés2001). Recent studies with French-learning infants suggest that this relative stress ‘deafness’ emerges early in life, as their ability to discriminate word stress patterns decreases between 6 and 10 months (Abboub, Bijeljac-Babic, Serres & Nazzi, Reference Abboub, Bijeljac-Babic, Serres and Nazzi2015; Bijeljac-Babic, Serres, Höhle & Nazzi, Reference Bijeljac-Babic, Serres, Höhle and Nazzi2012; Höhle, Bijeljac-Babic, Herold, Weissenborn & Nazzi, Reference Höhle, Bijeljac-Babic, Herold, Weissenborn and Nazzi2009; Skoruppa, Pons, Bosch, Christophe, Cabrol & Peperkamp, Reference Skoruppa, Pons, Bosch, Christophe, Cabrol and Peperkamp2013; Skoruppa, Pons, Christophe, Bosch, Dupoux, Sebastián-Gallés, Alves Limissuri & Peperkamp, Reference Skoruppa, Pons, Christophe, Bosch, Dupoux, Sebastián-Gallés, Alves Limissuri and Peperkamp2009), and even simultaneous bilingual infants and adults are relatively stress ‘deaf’ if their dominant language was French during infancy (Bijeljac-Babic et al., Reference Bijeljac-Babic, Serres, Höhle and Nazzi2012; Dupoux, Peperkamp & Sebastian-Gallés, Reference Dupoux, Peperkamp and Sebastian-Gallés2010, but c.f. Abboub et al., Reference Abboub, Bijeljac-Babic, Serres and Nazzi2015; Bijeljac-Babic, Serres, Höhle & Nazzi, Reference Bijeljac-Babic, Serres, Höhle, Nazzi, Baiz, Goldman and Hawkes2013). This suggests that input factors during infancy are important in developing optimal prosodic processing abilities.
Rhythmic perception and the Iambic/Trochaic Law
The current study investigated how experience with L2 contrastive lexical stress and music affects rhythmic grouping. Rhythmic grouping studies have a long tradition in perception research. In these studies (e.g., Hay & Diehl, Reference Hay and Diehl2007; Woodrow, Reference Woodrow1909; Reference Woodrow1911), adults are required to listen to streams of sounds that vary in intensity, pitch, or duration and indicate whether they hear pairs of sounds that are strong-weak (i.e., trochees) or weak-strong (i.e., iambs). The general finding is that adults perceive a rhythmic structure when listening to such streams: sound stretches that alternate in intensity or pitch are grouped into trochees, whereas sound stretches that alternate in duration are grouped into iambs.
Hayes (Reference Hayes1995) proposed the Iambic/Trochaic Law (ITL), an innate domain-general perceptual primitive, to explain these biases. According to Hayes, effects of the ITL are also reflected in language and music typology: Cross-linguistically, initial word or phrase stress is usually marked by rising intensity and rising pitch, whereas final stress is usually marked by lengthening (e.g., Beckman & Pierrehumbert, Reference Beckman and Pierrehumbert1986; Klatt, Reference Klatt1976; Nespor, Shukla, van de Vijver, Avesani, Schraudolf & Donati, Reference Nespor, Shukla, Vijver, Avesani, Schraudolf and Donati2008). The same distribution of rhythmic cues is found in music: initial beats are marked by higher intensity, and final notes are marked by longer duration (Lerdahl & Jackendoff, Reference Lerdahl and Jackendoff1983; Narmour, Reference Narmour1990; Todd, Reference Todd1985). Listeners perceive rhythmic structure even in invariant sequences of sounds such as the tick-tock of a clock, which are perceived as trochees (e.g., Bolton, Reference Bolton1894). This perceptual illusion is also captured by the ITL, as Hayes suggests that humans should perceive trochees unless durational cues (i.e., weight sensitivity, Hayes, Reference Hayes and Niepokuj1985) trigger an iambic perception.
Previous work has examined the influence of linguistic experience on rhythmic grouping by comparing monolingual speakers of different languages. Japanese and English listeners were presented with sequences of non-speech tones alternating in intensity or duration. Adult native listeners of Japanese and Japanese-learning 7–8-month-olds did not show a consistent pattern of grouping duration-varied sequences as iambs, whereas 7–8-month-old and adult listeners of English did (Iversen et al., Reference Iversen, Patel and Ohgushi2008; Kusumoto & Moreton, Reference Kusumoto and Moreton1997; Yoshida, Iversen, Patel, Mazuka, Nito, Gervain & Werker, Reference Yoshida, Iversen, Patel, Mazuka, Nito, Gervain and Werker2010). One explanation for this difference provided by Iversen and colleagues is related to differences in word order across the two languages: whereas English function words (typically shorter and acoustically less salient than content words) mostly precede content words within a phrase, the reverse order holds for Japanese. Hence, Japanese listeners are more exposed to long-short patterns than English listeners, and this may interfere with the effects of the ITL. Compatible with this account, Spanish–Basque bilingual 10-month-olds behave like Japanese-learning infants if they are dominant in Basque, which has a similar word order to Japanese, whereas they behave like English-learning infants if they are dominant in Spanish, which has a similar word order to English (Molnar, Lallier & Carreiras, Reference Molnar, Lallier and Carreiras2014).
Another recent line of research indicates that differences between languages in word-level stress also lead to differences in rhythmic grouping preferences. For example, Crowhurst and Teodocio Olivares (Reference Crowhurst and Teodocio Olivares2014) found that native speakers of Zapotec group repetitions of the syllable pair /dege/ as long-short when syllables vary in duration, while native listeners of English group them as short-long. However, when syllables vary in intensity, both Zapotec and English listeners group them as loud-soft. The authors explain this result by the fact that while stress is generally trochaic in both languages, the two languages differ with respect to weight-sensitivity. In English, heavy syllables usually attract stress even if they occur word-finally, and duration is a marker of prominence in such cases, which explains English listeners’ preference for short-long groupings. In contrast, Zapotec is not weight-sensitive, and duration is an additional marker for trochaic stress, which explains Zapotec listeners’ preference for long-short groupings (Crowhurst & Teodocio Olivares, Reference Crowhurst and Teodocio Olivares2014).
Other studies have examined grouping preferences by French listeners and compared them to native listeners of languages with contrastive lexical stress (Bhatara et al., Reference Bhatara, Boll-Avetisyan, Agus, Höhle and Nazziin press; Bhatara et al., Reference Bhatara, Boll-Avetisyan, Unger, Nazzi and Höhle2013; Hay & Diehl, Reference Hay and Diehl2007). Hay and Diehl (Reference Hay and Diehl2007) tested rhythmic grouping in native listeners of French and English using both a speech and a non-speech condition, which consisted of sequences of repetitions of a tone or the syllable /ga/ separated by intervals of silence. In both conditions, the French and English listeners showed the same performance, grouping intensity-varied sequences as trochees and duration-varied sequences as iambs. However, differences in rhythmic perception were found in a study comparing native listeners of French versus German (Bhatara et al., Reference Bhatara, Boll-Avetisyan, Unger, Nazzi and Höhle2013). In that study, the sequences were continuous streams of 16 segmentally varying coarticulated syllables (e.g., /. . .zuːleːboːliːloːziːmuːbeː. . ./) alternating in either intensity, duration or neither. Native listeners of both German and French showed grouping preferences as predicted by the ITL. However, the French were showing this effect less consistently and needed stronger acoustic contrasts (i.e., larger differences between syllables in intensity and duration) than the Germans. Moreover, only the Germans displayed a trochaic bias when listening to rhythmically invariant control sequences. These cross-linguistic differences were extended to complex non-speech sequences, made up of 16 different musical instrument sounds, while no differences between language groups were found when a single musical instrument sound was repeated (Bhatara et al., Reference Bhatara, Boll-Avetisyan, Agus, Höhle and Nazziin press). Taken together, cross-linguistic differences between native listeners of French and native listeners of German or English were obtained when using streams of varying syllables or nonlinguistic sounds, but not when using a single repeated syllable or nonlinguistic sound.
To account for the above findings, Bhatara et al. (Reference Bhatara, Boll-Avetisyan, Unger, Nazzi and Höhle2013; Reference Bhatara, Boll-Avetisyan, Agus, Höhle and Nazziin press) pointed out that they parallel the findings of studies on lexical stress ‘deafness’ (Dupoux et al., Reference Dupoux, Pallier, Sebastian-Gallés and Mehler1997; Reference Dupoux, Peperkamp and Sebastián-Gallés2001). Hence, they proposed that these results indicate that whether or not languages have lexical stress affects not only the perception of word stress but also rhythmic grouping. Following up on this proposal, they argued that German listeners might try to build up a foot structure when listening to rhythmic speech. While doing so, they would draw on abstract representations of lexical stress; especially when processing complex streams, which add a higher cognitive load on listeners compared to simple streams. However, French listeners do not establish these abstract representations of stress because they are not required for processing words in French. This could explain the presence or absence of cross-linguistic differences in ITL studies depending on the materials used.
Effects of L2 acquisition
The question explored in the present study is whether experience with an L2 with contrastive lexical stress in adulthood affects rhythmic grouping, i.e., the manifestation of the ITL, in native listeners of French. Previous studies have found no effect of L2 knowledge on French listeners’ lexical stress perception: European French L2 learners of Spanish were as stress ‘deaf’ as monolingual French listeners with no effect due to their L2 proficiency level (Dupoux, Sebastian-Gallés, Navarrete & Peperkamp, Reference Dupoux, Sebastian-Gallés, Navarrete and Peperkamp2008). Similarly, in cross-linguistic studies with L2 learners of English (Altmann, Reference Altmann2006) and Polish (Kijak, Reference Kijak2009) with various language backgrounds, French participants were among those with the poorest stress perception abilities. Furthermore, French L2 learners of German had greater difficulties in detecting rhythmic violations than syntactic violations in German sentences (Schmidt-Kassow, Rothermich, Schwartze & Kotz, Reference Schmidt-Kassow, Rothermich, Schwartze and Kotz2011). Hence, these studies suggest that stress ‘deafness’ persists with knowledge of an L2 with lexical stress and irrespective of L2 proficiency.
Three recent studies, however, indicate that L2 experience may have an effect on lexical stress perception. Lin, Wang, Idsardi and Xu (Reference Lin, Wang, Idsardi and Xu2014) found that native listeners of Korean, which also has no lexical stress, showed increased stress perception ability with increasing L2 proficiency in English. Furthermore, Canadian French listeners’ self-reported amount of daily use of L2 English (Tremblay, Reference Tremblay2009) and their time immersed in an English-speaking environment (Tremblay, Reference Tremblay2008) were significant predictors of their ability to perceive stress, while their general level of L2 proficiency was not.
The differences in outcome in the above studies may be accounted for by prosodic differences between the L1 languages (Korean, European and Canadian French). More importantly for our study, they might also relate to how L2 proficiency is assessed. First, whereas Lin et al. (Reference Lin, Wang, Idsardi and Xu2014) used continuous measures, the other studies used a categorical strategy, subdividing L2 learners into different proficiency groups (Tremblay, Reference Tremblay2009; Dupoux et al., Reference Dupoux, Sebastian-Gallés, Navarrete and Peperkamp2008). This categorical division could obscure subtle effects that might otherwise be visible in a continuous analysis. Second, there were differences in the way L2 proficiency was measured (Lin et al., Reference Lin, Wang, Idsardi and Xu2014: cloze test; Tremblay, Reference Tremblay2009: cloze test and read aloud task; Dupoux et al., Reference Dupoux, Sebastian-Gallés, Navarrete and Peperkamp2008: language history questionnaire). Maybe measures reflecting an impact of L2 knowledge need to be more specific. Studies have shown effects of quantity of input (Altenberg, Reference Altenberg2005; Boll-Avetisyan, Reference Boll-Avetisyan2012; Flege & Liu, Reference Flege and Liu2001), quality of input (such as interactions with friends/family, e.g., Moyer, Reference Moyer2011, or passive exposure to TV/radio, e.g., Flege, Yeni-Komshian & Liu, Reference Flege, Yeni-Komshian and Liu1999) and diversity of exposure (for a review, see Munoz & Singleton, Reference Munoz and Singleton2011) on different aspects of L2 phonological acquisition. Therefore, some aspects of L2 proficiency or exposure may be better predictors of speech perception than others. Hence, in the current study, we took continuous quantitative and qualitative indicators of L2 input into account.
Effects of music experience
A number of studies (e.g., Wong, Skoe, Russo, Dees & Kraus, Reference Wong, Skoe, Russo, Dees and Kraus2007; Zuk, Ozernov-Palchik, Kim, Lakshminarayanan, Gabrieli, Tallal & Gaab, Reference Zuk, Ozernov-Palchik, Kim, Lakshminarayanan, Gabrieli, Tallal and Gaab2013) have provided evidence for a link between phonological processing and musical experience (as measured by the number of years of playing an instrument and/or the age of instrument acquisition): musically experienced native listeners of English are, for example, better at discriminating syllables contrasting in non-native lexical tone (Wong et al., Reference Wong, Skoe, Russo, Dees and Kraus2007) and at discriminating consonants that vary in their voice onset time (Zuk et al., Reference Zuk, Ozernov-Palchik, Kim, Lakshminarayanan, Gabrieli, Tallal and Gaab2013) than listeners with less musical experience. Furthermore, Slevc and Miyake (Reference Slevc and Miyake2006) reported correlations between musical ability and L2 phonological perception and production skills (but not lexical and syntactic knowledge) in Japanese L2 learners of English. Hence, musical experience might generally facilitate L2 phonological acquisition and/or processing.
Only a few studies have explored whether musical experience may influence sensitivity to suprasegmental information. Kolinsky, Cuvelier, Goftry, Peretz and Morais (Reference Kolinsky, Cuvelier, Goftry, Peretz and Morais2009) found that French trained musicians outperformed non-musicians in the perception of lexical stress if only weak stress cues were provided. Bhatara, Yeung and Nazzi (Reference Bhatara, Yeung and Nazzi2015) showed a correlation between musical rhythm perception and years of foreign language experience among French speakers. This parallels findings on tone perception with native listeners of English, in which musicians identified and discriminated Mandarin tone contrasts more accurately than non-musicians (e.g., Gottfried, Staby & Ziemer, Reference Gottfried, Staby and Ziemer2004). These results indicate cross-domain transfer, which is not unexpected as music and speech use the same acoustic parameters to signal prominence.
In sum, some factors have been identified in prior studies that facilitate perception of non-native prosody: experience with music and quantity and quality of L2 experience. Consequently, we tested native listeners of French who had begun learning German after childhood to determine if their responsiveness to intensity and duration as cues for rhythmic grouping may have been enhanced by their knowledge of an L2 with lexical stress, using the same task as Bhatara et al. (Reference Bhatara, Boll-Avetisyan, Unger, Nazzi and Höhle2013) and comparing their performance to French and German monolinguals. Based on the finding that L1 experience with contrastive lexical stress leads to stronger rhythmic grouping preferences (Bhatara et al., Reference Bhatara, Boll-Avetisyan, Unger, Nazzi and Höhle2013; Reference Bhatara, Boll-Avetisyan, Agus, Höhle and Nazziin press), we hypothesized that L2 experience with contrastive lexical stress would have similar (though smaller) effects. Furthermore, as the same acoustic cues are used in speech and in music, and since the ITL has been proposed to be relevant for the perception of both (Hayes, Reference Hayes1995), we hypothesized that L2 learners with more musical experience may be more sensitive to rhythm in speech than L2 learners with less musical experience. To thoroughly explore which factors may contribute to the achievement of more German-like rhythmic perception in French L2 learners, we provided our participants with an extensive questionnaire concerning their past and present L2 and musical exposure and use.
Method
Participants
Participants were 40 French late L2 learners of German (28 F, 12 M, M age = 30.1, age range: 22–52) tested in the Berlin area. Recruitment criteria included having been raised monolingually with European French, having normal hearing and no language disorders, and being able to understand a German task instruction. They were compensated for their participation.
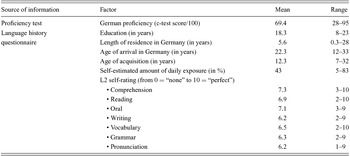
Measures for German and French proficiency were obtained by using German and French versions of a c-test, a standardized way of assessing second-language proficiency of learners similar to a cloze test: participants have to fill in missing letters to complete words in a text. Performance on this test correlates with multiple domains of linguistic knowledge (e.g., Eckes, Reference Eckes and Grotjahn2010). Although a written measure of proficiency may not ideally reflect spoken language comprehension skills, it has the advantage of not being redundant with our auditory rhythmic perception task. Furthermore, we obtained data about their language history using a questionnaire based on the LEAP-Q (Marian, Blumenfeld & Kaushanskaya, Reference Marian, Blumenfeld and Kaushanskaya2007). A summary of the results of the proficiency test and the questionnaire is provided in Table 1.
Participant language background information.

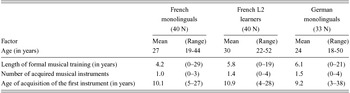
To assess the impact of L2 acquisition, the L2 learners were compared to the French and German monolinguals tested by Bhatara et al. (Reference Bhatara, Boll-Avetisyan, Unger, Nazzi and Höhle2013). Furthermore, to assess the potential influence of musical experience, we collected three measures for each participant: number of instruments played, years of musical experience (if the years of two instruments overlapped, these were counted only once), and age of first musical experience (see Table 2).
Participant music background information. Note: Information on the age of acquisition does not include 16 French, 7 German monolinguals and 9 L2 learners who never learned an instrument.

Material
We used the same stimuli as Bhatara et al. (Reference Bhatara, Boll-Avetisyan, Unger, Nazzi and Höhle2013). These were ninety speech streams containing sixteen different CV syllables made up of four vowels (/eː iː oː uː/) and four consonants (/b z m l/; e.g., /. . .zuːleːboːliːloːziːmuːbeː. . ./). The syllable sequences were synthesized using the text-to-speech software MBROLA (Dutoit, Pagel, Pierret, Bataille & van der Vreken, Reference Dutoit, Pagel, Pierret, Bataille and van der Vreken1996) in two different female voices – the German voice De5 and the French voice Fr4. The selection of the phonemes was based on the consideration that they exist in both languages and are discriminable for both language groups in both the French and German synthesis in spite of differences between their French and German acoustic realizations. Baseline syllable intensity as measured in Praat (Boersma & Weenink, Reference Boersma and Weenink2010) was set at 70 dB, baseline syllable duration at 260 ms, and baseline F0 at 200 Hz. For two of the experimental conditions (Duration and Intensity), these sequences were further manipulated. For the duration condition, every second syllable in a stream was lengthened, and for the intensity condition, every second syllable had increased intensity. The third experimental condition was the control condition, for which the sequences contained no variation. There were four levels of intensity variation (2, 4, 6, or 8 dB above baseline) and four levels of duration variation (50, 100, 150 or 200 ms above baseline).
In order to prevent the beginnings of the stimuli from giving grouping cues, the first three seconds of the streams were masked by white noise fading out and intensity fading in. In addition, half of the sequences started with a weak syllable, and the other half started with a strong syllable. Each participant heard 10 repetitions of each level of intensity or duration variation and 10 repetitions of the control sequences, resulting in a total of 90 trials.
Procedure
The procedure was the same as that of Bhatara et al. (Reference Bhatara, Boll-Avetisyan, Unger, Nazzi and Höhle2013). Participants were tested in a quiet room. Participants were instructed to listen carefully to each syllable sequence and to report whether they heard the syllables alternating as “strong-weak” pairs, or as “weak-strong” pairs. They were told not to wait until the end of a sequence and to respond as fast as possible.
Half of the participants received instructions in French, and the other half in German, using the same instructions as in Bhatara et al. (Reference Bhatara, Boll-Avetisyan, Unger, Nazzi and Höhle2013). As French does not use lexical stress, the examples in the French instructions were trochaic and iambic words from Spanish as well as examples of syllable emphasis in response to a word misunderstanding such as: “You say, ‘J'aime le bateau’ [I like the boat] and your friend says ‘Le gâteau?’ [the cake]. You respond, ‘Non, le BAteau’ placing the emphasis on the first syllable of the word.” The German instructions gave a couple of examples of trochaic (e.g., Apfel, Auto) and iambic words in German (e.g., Salat, Proband). By counterbalancing the language of instruction, we could control for language mode effects and test whether it would matter that different examples were used to explain what “weak-strong” and “strong-weak” meant.
Participants responded by pressing one of two labeled buttons (either a tall bar to the left of a short bar, symbolizing trochaic, or a short bar to the left of a tall bar, symbolizing iambic). Their responses were recorded. The testing procedure began with four practice trials. They were followed by ninety test trials presented in random order. After half of the trials, participants could take a short break. The experiment was run on a MacBook laptop, controlled by the software PsyScope X (available at http://psy.ck.sissa.it/). The stimuli were presented over AKG K 55 headphones with the volume set at a comfortable level. Left-right position of the response keys and MBROLA voice (German De5 or French Fr4) were counterbalanced between participants. After the rhythmic perception task, they completed the two c-tests and filled out the language and music background questionnaire.
Data processing, analysis, and results
Three separate analyses were carried out. Part 1 was a simple model testing whether the L2 learners’ grouping preferences followed the ITL by testing each condition against chance. Part 2 assessed whether the rhythmic grouping preferences of the L2 learners differed from those of the German and French monolinguals. Part 3 tested the potential influence of multiple continuous and categorical predictors on the L2 learners’ rhythm perception.
In all three models, the dependent variable was response type (1 = “trochaic” versus 0 = “iambic”). As the data had a binomial distribution, a logit generalized linear mixed model (e.g., Jaeger, Reference Jaeger2008) was applied to the unaggregated data. Coefficients (β) indicate the logit-transformed proportion of trochaic responses. To account for the variability between individual participants and individual items, each model included random factors for participants and items, but random slopes were not specified as their inclusion led to false convergence.
To reduce collinearity and the number of highly correlated variables in our models, we performed principal component analyses (PCA). We always used the first principal component (PC) obtained by a PCA as a predictor, as this is the one that accounts for most of the variance of the combined variables. Models were calculated in “R” (R Core Team, 2012) using the package “lme4” (Bates, Maechler & Bolker, Reference Bates, Maechler and Bolker2012); graphs were generated using the package “ggplot2” (Wickham, Reference Wickham2009).
Part 1: Testing L2 learners’ grouping preferences against chance
Data processing and analysis
The following model included the data of all 40 L2 learners. The intercept was set at zero, so that each level (Duration, Intensity and Control) of the fixed factor condition was tested against chance. A negative β indicates performance below chance, and a positive β indicates performance above chance.
Results
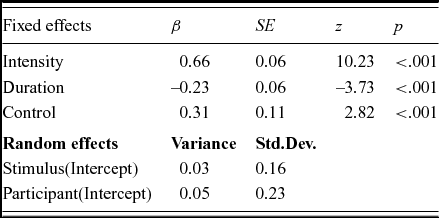
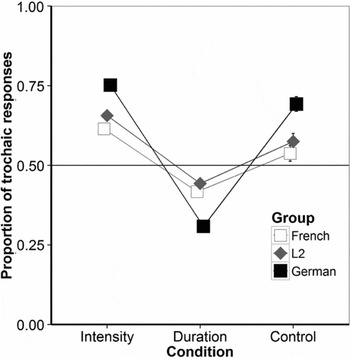
The mixed model results (see Table 3) revealed that for the L2 learners, as predicted by the ITL, the proportion of trochaic responses was significantly above chance level in both the intensity and the control condition, while it was below chance level in the duration condition. Results are presented in Figure 1.
Parameters of the linear mixed-effects logit regression, Part 1. For fixed effects, regression coefficients (β), their standard errors (SE), z-scores and the respective p-values are given. For random effects, variance and standard deviations are given.

Mean proportion of trochaic responses (0 = “iambic”, 1 = “trochaic”) and their standard errors broken down by condition and group.

Part 2: Comparing Groups (L2 learners versus monolinguals)
Data processing and Analysis
The data of the 40 L2 learners were compared to the data from 40 monolingual French and 40 monolingual German listeners obtained by Bhatara et al. (Reference Bhatara, Boll-Avetisyan, Unger, Nazzi and Höhle2013). The fixed factors were group, condition and musical experience. The three levels of both the condition and the group factors were compared in sliding contrasts, using the R function contr.sdif(), which serially compare different groups (i.e., 1 to 2, and 2 to 3). Sliding contrasts have the statistical benefits of being orthogonal and using the grand mean as the intercept, for which the baseline is much more stable than in contrasts that only use a subset of the data as a baseline. For group, we compared the French monolinguals to the L2 learners (henceforth L2–F) and the L2 learners to the German monolinguals (henceforth G–L2), thus not comparing the two monolingual groups already compared in Bhatara et al. (Reference Bhatara, Boll-Avetisyan, Unger, Nazzi and Höhle2013).
For condition, comparisons were made between Duration and Intensity (henceforth D–I) and Control and Duration (henceforth C–D). This contrast was chosen because in Bhatara et al.'s (Reference Bhatara, Boll-Avetisyan, Unger, Nazzi and Höhle2013) study, both intensity-varied and control sequences were grouped more consistently as trochaic and duration-varied sequences were grouped more consistently as iambic by the German than by the French monolinguals. Hence, to ascertain whether the L2 learners develop German-like grouping preferences, we should examine whether they show increased differences relative to French monolinguals when comparing duration-varied sequences to both intensity-varied and control sequences.
The effect of musical experience was assessed by means of a PC, which equally represented the participants’ years of experience, number of instruments, and age of first musical experience (loadings of 0.58, 0.57 and 0.58; the three variables being correlated) and captured 80% of the variance contained in these three variables (see Supplementary Material, Table S1, for more details on this PCA). As the D–I contrast is more relevant for testing the predictions of the ITL than the C–D contrast, we will report the results of the D–I comparison before the results of the C–D comparison.
Results
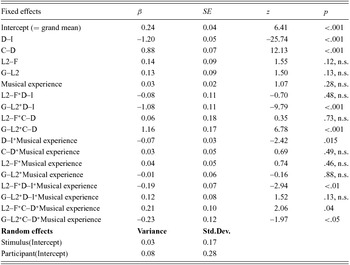
The model coefficients (β) and estimated standard errors (SE) are provided in Table 4. Coefficients indicate the difference scores of the logit-transformed proportion of trochaic responses. Only significant effects are discussed.
Parameters of the linear mixed-effects logit regression, Part 2. For fixed effects, regression coefficients (β), their standard errors (SE), z-scores and the respective p-values are given. For random effects, variance and standard deviations are given.

Intensity-Duration comparison
Note that for the D–I contrast, the negative β means that there were more trochaic responses for Intensity than for Duration since Intensity is subtracted from Duration. Interactions including the D–I contrast that have negative βs indicate an increase in the magnitude of the D–I difference, which corresponds to more German-like responses.
Across all groups, there were significantly more trochaic responses to intensity-varied than to duration-varied sequences. Moreover, differences were observed between L2 learners and German monolinguals (significant G–L2*D–I). The L2 learners showed less of a difference than the German monolinguals in the number of trochaic responses between the duration and intensity conditions. However, the L2 learners did not differ from the French monolinguals (nonsignificant L2–F*D–I).
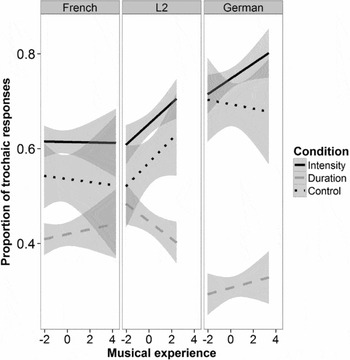
The only difference between the L2 learners and the French monolinguals was found in interactions with musical experience (see Figure 2). D–I*Musical experience was significant: the difference in grouping preferences between Intensity and Duration increased with musical experience. However, the L2 learners’ grouping preferences were more enhanced by musical experience than the French monolinguals’ (significant L2–F*D–I*Musical experience).
Linear regression lines reflecting the mean proportion of trochaic responses (0 = “iambic”, 1 = “trochaic”) for the effect of musical experience broken down by condition and group. The values for musical experience were the output of a Principal Component Analysis including information on participants’ years of musical experience, age of acquiring an instrument, and the number of learned instruments. Lower values indicate less musical experience. Shaded areas indicate the standard deviations.

Control-Duration comparison
Note that for the C–D contrast, the positive β means that there were more trochaic responses for Control than for Duration since Duration is subtracted from Control. Interactions including the C–D contrast that have positive βs indicate an increase in the magnitude of the C–D difference, which corresponds to more German-like responses.
Across all groups, there were significantly more trochaic responses to control than to duration-varied sequences. The contrast between the control and the duration-varied sequences was larger for the German monolinguals than for the L2 learners (significant G–L2*C–D), while there was no difference between the L2 learners and French monolinguals (nonsignificant L2–F*C–D).
However, differences between the L2 learners and the French monolinguals as well as the L2 learners and the German monolinguals became evident in the interaction with musical experience: the more musically experienced the L2 learners were, the more German-like their grouping preferences were, while the monolinguals’ grouping preferences did not change with musical experience (significant L2–F*C–D*Musical experience and G–L2*C–D*Musical experience).Footnote 1
Part 3: Exploring predictors of L2 learners’ rhythmic perception
Data processing and analysis
In order to reveal which factors are associated with the L2 group's performance on the grouping task, a third model was applied to the L2 learners’ data. The fixed factor Condition was specified as a sliding contrast as described above. Furthermore, several potential (continuous and categorical) predictors of L2 rhythmic perception were added as fixed factors.
To reduce collinearity, we applied a predictor reduction via PCA whenever at least two questions of the questionnaires assessed the same kind of information and were correlated. Otherwise, we included the variable in isolation. To reduce collinearity further, all continuous variables were centered. Although some of the variable combinations included in the model comparisons were correlated, we did not further control for collinearity by means of residualization (see Wurm & Fisicaro, Reference Wurm and Fisicaro2014; York, Reference York2012, who show that an inclusion of residualized factors has stronger detrimental impacts on the interpretability of effects than an inclusion of correlated variables).
The method of testing various potential variables is an exploratory approach. For that reason, we used the Akaike information criterion (AIC) as a measure for comparing the relative goodness of fit between models. Our model comparisons included 12 predictors, described in more detail below. To test the effects of quality and quantity of exposure to German, we included six predictors from the questionnaire. The first one (Exposure-G, amount of daily German input in %) corresponded to the amount of L2 exposure, while the other five provided information regarding the type of exposure. These five variables were based on participants’ ratings on an 11-point scale ranging from not important/never (0) to most important/all the time (10). Of these five predictors, three were related to the type of input considered by the participants to be relevant for their acquisition (Acq) of German: a) Acq-Reading, hence non-auditory input, b) Acq-Listening, a PC for non-interactive auditory exposure to TV/radio input, and c) Acq-Interacting, a PC combining the relevance of interacting with family and friends for acquisition, that is interactive auditory exposure. The other two predictors were related to the amount of the same types of input in current life (Cur): a) Cur-Reading, and b) Cur-Auditory, a PC combining four correlated factors relating to TV/radio/friends/family input. The remaining five variables were tested because they were identified as predictors of L2 perception in prior studies. Two of these reflected general L2 proficiency: a) the c-test score obtained from the proficiency test, and b) a PC for the self-estimated oral L2 skills in responses to five questions regarding the L2 learners’ self-estimated German skills (oral language, comprehension, pronunciation, strength and detectability of foreign accent). Two variables were inherent to the experimental design and tapped into potential language mode effects: a) the language in which the instructions were provided (French or German), and b) the voice (French or German) with which the stimuli were presented.Footnote 2 The fifth variable was age of arrival in Germany. Details on the PCs are provided in the Supplementary Materials (Supplementary Materials, Table S3).Footnote 3
Our model comparisons started out with a model including all covariates, which was then reduced in a step-wise fashion. The final model, which yielded the lowest AIC score (AIC: 4771) and hence can be considered to provide an optimal account for the variance in the L2 learners’ data, included the predictors Musical experience, Exposure-G, Acq-Reading, Cur-Reading, Acq-Listening, and Cur-Auditory. The first three predictors were tested in interaction with Condition, while the latter three predictors were not tested in this interaction, as this would not have helped to capture more variance.
Results
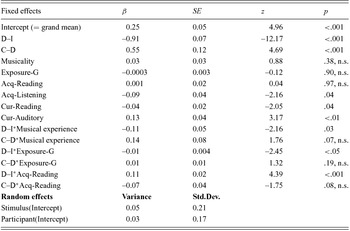
Results of the covariate analysis of the L2 group are given in Table 5 and displayed in Figure 2. As in the previous model, there were effects of Condition: duration-varied sequences were judged less often to be trochaic than intensity-varied sequences (negative D–I) and control sequences (positive C–D).
Parameters of the linear mixed-effects logit regression, Part 3. For fixed effects, logit-transformed regression coefficients (β), their standard errors (SE), z-scores and the respective p-values are given. For random effects, variance and standard deviations are given.

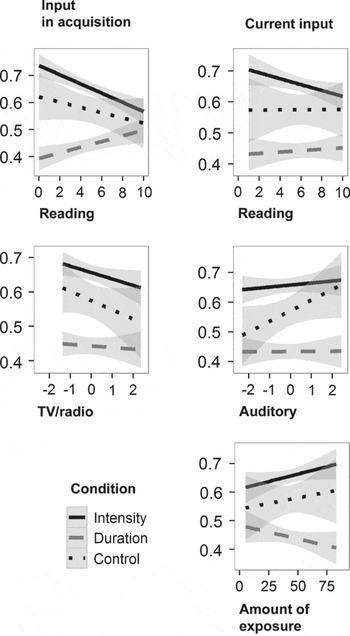
Effects of the covariates are illustrated in Figure 3. Three variables, Musical experience, Exposure-G and Acq-Reading, interacted with D–I. Again, given the direction of these effects, interactions with the D–I contrast that have negative coefficients correspond to more German-like responses. Musical experience (as already described in Part 1) and Exposure-G had “positive” effects on the D–I difference: L2 learners with more musical experience and L2 learners who are currently generally more exposed to German input gave more German-like responses with more trochaic responses in the intensity condition, and more iambic responses in the duration condition. In contrast, Acq-Reading had a “negative” influence on rhythm perception: the less importance was attributed to reading (which is non-interactive and non-auditory) input for the acquisition of German, the more German-like the responses in the task were (positive D–I*Acq-Reading).
Linear regression lines reflecting the mean proportion of trochaic responses (0 = “iambic”, 1 = “trochaic”) for the effect of specific types of L2 input on condition. Lower values indicate less relevance of a specific input type during acquisition (left column) and less amount of a specific input type in current life (right column). Units of measurement on the x-axis: Likert scale (0-10) for reading, principal component for auditory and TV/radio, and % for exposure. Shaded areas indicate the standard deviations.

Three further predictors had a significant main effect: first, higher ratings of TV, radio, friends and family as a current source of German input go along with more trochaic responses across conditions, including the duration condition (positive Cur-Auditory). Moreover, both Acq-listening and Cur-Reading had effects in the opposite direction (reflected by the negative coefficients): L2 learners who attributed less importance to listening to radio and TV for their acquisition of German and L2 learners who are currently less exposed to written German input gave more trochaic responses across conditions, again including duration.
Proficiency
A correlation analysis including the c-test scores in German, the self-estimated rates of L2 proficiency and the factors found to be relevant predictors of L2 rhythmic perception in the generalized mixed model (Part 3) revealed that the c-test scores significantly correlate with a PC of the self-assessed rates of oral proficiency (PC-Proficiency; r = .52, p < .001), and with reading (r = .80), writing (r = .84), vocabulary (r = .69) and grammar (r = .80; all p’s < .05) skills. Hence, the c-test scores are likely to give a good indication of the participants’ general L2 proficiency. Nonetheless, neither the c-test scores nor the PC-proficiency were included into the described model because neither were significant predictors of L2 rhythmic perception, nor could they account for variability in the data. Furthermore, the c-test scores were uncorrelated with Musical experience (r = –.08, p = .61), Exposure-G (r = .28, p = .08), Acq-Reading (r = .29, p = .07), Acq-Listening (r = .21, p = .21), but significantly correlated with Cur-Reading (r = .46, p < .01) and Cur-Auditory (r =.39, p < .05).
Discussion
French advanced L2 learners of German were tested on their rhythmic grouping abilities. We predicted that L2 experience with contrastive lexical stress should lead to more consistent rhythmic grouping preferences compared to those of French monolinguals. This prediction was motivated by the finding that German monolinguals are more consistent in their rhythmic grouping preferences than French monolinguals (Bhatara et al., Reference Bhatara, Boll-Avetisyan, Unger, Nazzi and Höhle2013; Reference Bhatara, Boll-Avetisyan, Agus, Höhle and Nazziin press), and that L2 experience can affect L2 prosodic processing in other languages (Lin et al., Reference Lin, Wang, Idsardi and Xu2014; Tremblay, Reference Tremblay2009). However, given some studies suggesting that stress perception in European French listeners is not improved by L2 experience with lexical stress (Altmann, Reference Altmann2006; Dupoux et al. Reference Dupoux, Sebastian-Gallés, Navarrete and Peperkamp2008; Kijak, Reference Kijak2009; Schmidt-Kassow et al., Reference Schmidt-Kassow, Rothermich, Schwartze and Kotz2011), we explored various predictors that are known to affect L2 phonological acquisition, such as the amount and type of exposure. In so doing, our exploratory data analysis indicated that several of these language-related factors, together with musical experience, modulate sensitivity to prosodic information among French L2 learners of German.
First, we established that rhythmic grouping by the L2 learners was in line with the predictions of the ITL: like the German and French monolinguals (Bhatara et al., Reference Bhatara, Boll-Avetisyan, Unger, Nazzi and Höhle2013), the L2 learners perceived a trochaic structure when listening to syllable sequence alternating in intensity and an iambic structure when listening to sequences with syllables alternating in duration. Like the German but not the French monolinguals, the L2 listeners perceived trochees when listening to control sequences without rhythmic alternation.
Second, we tested whether L2 learners differed in their grouping preferences from German and French monolinguals. We found that they did not differ significantly from French monolinguals as a group, but differences were revealed if musical experience was taken into account: L2 learners who had more musical experience performed more similarly to the German monolinguals. Still, although the grouping abilities of the L2 learners were affected by their L2 experience, they continued to differ as a group from the German monolinguals, suggesting limits in the way prosodic processing can change as a result of L2 learning.
Third, we investigated the influence of several potential predictors of rhythm perception related to L2 experience. We found that neither general measures of language proficiency, age of arrival, nor the experimental variables “language of instruction” and “stimulus voice” accounted for any variance in the data. Instead, we identified five input quality and quantity factors that were related to rhythmic grouping preferences in the French L2 learners of German. Three of these language-related factors concern current L2 input while the other two concern L2 acquisition. Moreover, these factors were associated with different perceptual outcomes: two were associated with a more German-like perception, while the other three were associated with a more trochaic perception across conditions. A more German-like perception was found when L2 learners were currently exposed to more German, and when they had not considered written input (Acq-Reading) to be relevant for their acquisition of German. A general trochaic bias was found in L2 learners who indicated that their current contact with German was mainly through auditory input. Furthermore, this general trochaic bias was negatively correlated with reliance on TV/radio during acquisition and with current reading of German – i.e., the more the participants read or the more they reported that TV/radio exposure had been important during acquisition, the less they demonstrated a trochaic bias.
In the following, we discuss the effects of the factors that improved the statistical model with respect to the AIC, after a brief discussion of the factors that did not improve the model. Finally, we discuss potential explanations for why some predictors were associated with an increase of the effects of the ITL whereas others were associated with a general trochaic bias.
Factors not affecting rhythmic grouping
L2 proficiency
General L2 proficiency had no effect on rhythmic perception in the present study. Neither the German c-test scores nor self-estimated oral proficiency had significant effects on grouping, and neither improved the statistical model. While L2 studies frequently use c-tests as a measure for individual differences among L2 learners (Tremblay, Reference Tremblay2011) because they often correlate with different aspects of L2 proficiency (Eckes & Grotjahn, Reference Eckes and Grotjahn2006), they may not relate closely to prosodic proficiency. As indicated by the present results, the acquisition of L2 stress appears to depend on exposure to spoken language, just like the acquisition of other phonological aspects of an L2 (e.g., Altenberg, Reference Altenberg2005; Flege & Liu, Reference Flege and Liu2001). L2 proficiency, however, can be influenced by many other factors that do not relate to exposure at all, such as motivation (Bongaerts, Reference Bongaerts and Birdsong1999), language aptitude (Abrahamsson & Hyltenstam, Reference Abrahamsson and Hyltenstam2008), and general cognitive skills such as working memory (Service & Kohonen, Reference Service and Kohonen1995), just to name a few. This indicates that measures of general L2 proficiency might be too global to predict L2 prosodic development (though see Lin et al., Reference Lin, Wang, Idsardi and Xu2014). This could explain why Tremblay (Reference Tremblay2009) did not find differences across groups with varying proficiency levels but found an impact of daily L2 exposure on the processing of word stress in native listeners of Canadian French. It might also explain why in Dupoux et al.’s study (Reference Dupoux, Sebastian-Gallés, Navarrete and Peperkamp2008), a global measure of L2 proficiency was not a significant predictor of L2 contrastive lexical stress acquisition in European French learners of Spanish.
Factors affecting rhythmic grouping
Musical experience
Musical experience throughout the lifespan was a positive predictor of German-like rhythmic perception in L2 learners. This finding is in line with the proposal of the ITL as an extra-linguistic principle accounting for rhythmic patterns in music and language (Hayes, Reference Hayes1995). However, musical experience did not generally affect speech rhythm perception. Rather, it appeared to interact with L2 learning. Indeed, with increased musical experience, the difference between the duration and both the intensity and control conditions became larger in the L2 learners but not in the monolinguals. Hence, the present results rather suggest an effect of musical experience on L2 learning.
To account for this effect, we speculate that musical experience does not directly influence rhythmic grouping preferences when perceiving speech (which explains why the French monolinguals were unaffected by musical experience). However, musical experience may have influenced the L2 learners’ acquisition of word stress in German and, hence, an establishment of abstract representations of stress which was proposed to have a relevant role in rhythmic grouping (Bhatara et al., Reference Bhatara, Boll-Avetisyan, Unger, Nazzi and Höhle2013). As pointed out in the introduction, musical experience can enhance listeners’ sensitivity to suprasegmental features of a non-native language (Gottfried et al., Reference Gottfried, Staby and Ziemer2004; Kolinsky et al., Reference Kolinsky, Cuvelier, Goftry, Peretz and Morais2009). Hence, we suggest that musical experience may facilitate the detection of the acoustic correlates of word stress in French L2 learners of German, which is a necessary condition to build up a representation of stress. This process may be supported by the acoustic overlap of signaling rhythm in music and language. These explanations could also account for why musical experience was not associated with rhythmic grouping in the monolingual French listeners, as they have no abstract representation of lexical stress. Taken together, the present results could be interpreted as indicative of an effect of abstract knowledge of either L1 or L2 lexical stress rather than a direct effect of musical experience on rhythmic grouping.
Note that musical experience was not correlated with general L2 proficiency. This is in line with findings by Slevc and Miyake (Reference Slevc and Miyake2006) reporting effects of musical ability on L2 segmental phonology production and perception (discrimination of non-native phoneme contrasts), but not syntax and lexical knowledge. In the current study, we may have found a link between music and L2 regarding suprasegmental L2 knowledge; a connection that is even more logical since music and language share rhythmic properties.
While our PC combining the variables of years of experience, age of acquisition and number of instruments provides us with a global measure of the participants’ musical experience, the three questions we used did not allow us to measure the quality of this musical experience. Therefore, future studies should endeavor to use more fine-grained or precise measures for assessing effects of musicality or musical experience (as we did in the present study for the language measures), possibly by manipulating these factors experimentally. For example, in addition to the questions used in the present study, future studies could collect information on whether a person had individual or group lessons, studied music in a conservatory or in basic music classes, and whether they practiced daily or not, both in the past and currently.
Furthermore, it would also be interesting for future studies to use musicality tests for assessing listeners’ musical aptitude. It is likely that musical aptitude and musical experience are correlated given that people with higher musical aptitude are more likely to pursue musical training. However, future studies should directly address the question of whether individuals who are inherently more musical are better at picking up prosodic properties of an L2, and how or even if this relates to their musical experience.
Amount of L2 exposure
The current quantity of daily exposure to German significantly predicted rhythmic grouping. With more daily exposure to German, the L2 learners in our study also developed more German-like grouping preferences. This is in line with previous findings of effects of daily exposure on other aspects of L2 perception and production such as phonemes and phonotactics (Altenberg, Reference Altenberg2005) and word stress (Tremblay, Reference Tremblay2009).
Type of input
In this study, we examined the effects of the type of input during acquisition and in current life. With respect to current input, we found that more L2 auditory input and, paralleling this, less L2 written input was associated with more trochaic responses in all conditions, including the duration condition. Hence, certain types of current input were associated with a general trochaic bias. Though duration cues are not processed as they should be, this general trochaic grouping strategy is German-like in the other two conditions (see further discussion below). The finding that current quality of input is related to L2 phonology is not new. Previous studies have found that the interactive use of the L2 with native speakers has a significant impact on phonological abilities in perception (e.g., phoneme identification, Díaz-Campos, Reference Díaz-Campos2004; Flege & Liu, Reference Flege and Liu2001). It has also been found previously that current media, written and oral L2 input are predictors of L2 prosody production (Huang & Jun, Reference Huang and Jun2011).
To our knowledge, we found for the first time indications that the type of input during the initial stages of acquisition may have a sustained impact on rhythm perception in L2 learners (although previous studies have assessed, but failed to reveal, its potential influence, e.g., Huang & Jun, Reference Huang and Jun2011). The less relevance L2 learners attributed to reading during acquisition of German, the more German-like grouping preferences were found. Moreover, the less relevance L2 learners attributed to TV/radio exposure during acquisition, the more they demonstrated a general trochaic bias. Our findings also show that the same type of input can have different effects during the initial stages of L2 learning versus in current life: while less importance attributed to reading at the acquisition stage was associated with a more German-like perception in accordance with the ITL, less reading in current life was associated with a general trochaic bias.
ITL or trochaic bias: a different status of intensity(/pitch) versus duration changes?
Our study has identified some predictors related to L2 German and musical experience that affect rhythmic grouping preferences in French listeners. However, not all predictors were associated with similar perceptual outcomes. More musical experience, more daily exposure to German and less importance attributed to reading exposure at the initial stages of L2 acquisition were associated with enhanced grouping preferences in accordance with the ITL. This relation is logical, as this would mirror the grouping preferences of the native speakers of the target language. More puzzling, however, is that less reading and more auditory exposure in current life as well as more importance attributed to passive auditory exposure at the initial stages of L2 acquisition were associated with relatively more trochaic groupings across all conditions, including the grouping of duration-varied syllable sequences.
One possible explanation for this effect is that L2 learners may have overgeneralized the trochaic pattern. Work by Cutler and colleagues suggests that postulating word beginnings at strong syllables is an extremely successful segmentation strategy for English listeners, as English words are predominantly trochaic (for a summary, see Cutler, Reference Cutler1994). German words are also predominantly trochaic. Hence, even if L2 experience does not per se enhance sensitivity to all stress cues, an overgeneralization of a trochaic listening strategy while ignoring duration as a cue for an iambic stress pattern is still prone to be a successful strategy for processing German speech. Hence, the emergence of an overall trochaic bias in the French L2 learners who were frequently exposed to auditory German and infrequently exposed to written German may indicate the development of a partial German-like rhythmic perception.
A second possible explanation for these results is that there is a qualitative difference in the way listeners perceive intensity and duration variation in speech. Perhaps duration is not an early, robust cue to iambic structure. Indeed, while pitch and/or intensity variation consistently leads to trochaic groupings in adults (Bhatara et al., Reference Bhatara, Boll-Avetisyan, Unger, Nazzi and Höhle2013; Reference Bhatara, Boll-Avetisyan, Agus, Höhle and Nazziin press; Crowhurst & Teodocio Olivares, Reference Crowhurst and Teodocio Olivares2014; Iversen et al., Reference Iversen, Patel and Ohgushi2008; Kusumoto & Moreton, Reference Kusumoto and Moreton1997) and infants (Bion, Benavides-Varela & Nespor, Reference Bion, Benavides-Varela and Nespor2011; Molnar et al., Reference Molnar, Lallier and Carreiras2014; Yoshida et al., Reference Yoshida, Iversen, Patel, Mazuka, Nito, Gervain and Werker2010) with various native languages, grouping by duration variation depends on the particular native language (adults: Crowhurst & Teodocio Olivares, Reference Crowhurst and Teodocio Olivares2014; Iversen et al., Reference Iversen, Patel and Ohgushi2008; Kusumoto & Moreton, Reference Kusumoto and Moreton1997; infants: Hay & Saffran, Reference Hay and Saffran2012; Molnar et al., Reference Molnar, Lallier and Carreiras2014; Yoshida et al., Reference Yoshida, Iversen, Patel, Mazuka, Nito, Gervain and Werker2010), and duration-based grouping preferences seem to emerge later in infancy (Bion et al., Reference Bion, Benavides-Varela and Nespor2011; Hay & Saffran, Reference Hay and Saffran2012; Yoshida et al., Reference Yoshida, Iversen, Patel, Mazuka, Nito, Gervain and Werker2010). Our results that some factors are associated with an overall increase in trochaic responses even in duration-varied sequences might constitute additional evidence that duration is not as robust a grouping cue as intensity and pitch. Moreover, the results suggest that this is true for both L1 and L2 acquisition.
Conclusion
The present results on French L2 learners of German show that the effects of the Iambic/Trochaic Law, extended here to this population of late bilinguals, are not only modulated by L1 experience (Bhatara et al., Reference Bhatara, Boll-Avetisyan, Unger, Nazzi and Höhle2013, Reference Bhatara, Boll-Avetisyan, Agus, Höhle and Nazziin press; Crowhurst & Teodocio Olivares, Reference Crowhurst and Teodocio Olivares2014; Iversen et al., Reference Iversen, Patel and Ohgushi2008; Kusumoto & Moreton, Reference Kusumoto and Moreton1997; Yoshida et al., Reference Yoshida, Iversen, Patel, Mazuka, Nito, Gervain and Werker2010), but also by specific factors involved with adult L2 experience. This first establishes that even after childhood, learning an L2 can affect rhythm perception. Second, some of the factors identified relate to quantitative and qualitative (e.g., written versus auditory input) indicators of L2 experience. Lastly, we found that musical experience influences the perception of rhythmically structured speech, if listeners have sufficient knowledge of an L2 for which stress is relevant. On the contrary, general measures of L2 proficiency did not capture variance in L2 learners’ rhythmic grouping. The current study did not directly investigate the acquisition of word stress in an L2, but rather the modulation of rhythmic perception of speech streams. It would be interesting for future studies to directly assess whether factors relating to L2 and musical experience influence the acquisition of L2 lexical stress. However, given the proposal that rhythmic grouping preferences relate to experience with word-level prosodic structure (Bhatara et al., Reference Bhatara, Boll-Avetisyan, Unger, Nazzi and Höhle2013; Reference Bhatara, Boll-Avetisyan, Agus, Höhle and Nazziin press), our results have implications for the study of stress ‘deafness’. Many studies have reported that French adults cannot overcome their stress ‘deafness’ even if they are advanced learners of an L2 with lexical stress (Altmann, Reference Altmann2006; Dupoux et al., Reference Dupoux, Sebastian-Gallés, Navarrete and Peperkamp2008; Kijak, Reference Kijak2009, Schmidt-Kassow et al., Reference Schmidt-Kassow, Rothermich, Schwartze and Kotz2011). We also failed to find an overall difference between French monolinguals and French L2 learners of German. However, by making use of more fine-grained information related to L2 and musical experience, we found that French L2 learners become more sensitive to rhythmic structure under specific circumstances. Such an approach should be used in future studies on stress ‘deafness’.
To conclude, our results imply that the processes underlying the perception of speech rhythm are more dynamic and flexible than previously thought. Future research should further investigate L2 experience as well as both musical experience and ability in more detail to better understand the contributions of linguistic and non-linguistic factors to rhythmic perception.
Supplementary Material
For supplementary material accompanying this paper, visit http://dx.doi.org/10.1017/S1366728915000425