1 Introduction
The chaotic and multiscale nature of turbulent flows continues to challenge the understanding of fluid dynamicists. One route to penetrating such a mathematically demanding system is to view a turbulent flow as a trajectory through a high-dimensional phase space (Hopf Reference Hopf1948). This trajectory then passes near the vicinity of unstable solutions and accumulates characteristics of these states which can be extracted, via numerical computation, for thorough investigation. Such an approach has been pioneered for wall-bounded shear flows (Kawahara & Kida Reference Kawahara and Kida2001; Viswanath Reference Viswanath2007; Cvitanović & Gibson Reference Cvitanović and Gibson2010; Kawahara, Uhlmann & van Veen Reference Kawahara, Uhlmann and van Veen2012; Kreilos & Eckhardt Reference Kreilos and Eckhardt2012; Willis, Short & Cvitanovic Reference Willis, Short and Cvitanovic2016), two-dimensional (2D) body-forced Kolmogorov flow (Chandler & Kerswell Reference Chandler and Kerswell2013; Lucas & Kerswell Reference Lucas and Kerswell2015) and highly symmetric isotropic turbulence (van Veen, Kida & Kawahara Reference van Veen, Kida and Kawahara2006).
These unstable states, in particular the time-dependent recurrent flows or UPOs (unstable periodic orbits), contain valuable dynamical information which may provide some predictability to the inherent complexity of the turbulence. This has been addressed through the application of ‘periodic orbit theory’ (Cvitanović Reference Cvitanović1992), whereby the statistics of individual UPOs are combined weighted by their relative stability in an attempt to rationalise the turbulent statistics. Recent work (Lan & Cvitanović Reference Lan and Cvitanović2004; Chandler & Kerswell Reference Chandler and Kerswell2013; Lucas & Kerswell Reference Lucas and Kerswell2015) has assessed the effectiveness of this strategy and discussed computational nuances. Rather than attempt this for three-dimensional Kolmogorov flow, we use the extracted recurrent flows as a guide for what complicated and interlinked physical processes may underpin the turbulence. A very successful example of such an approach is plane Couette flow, where a nearly recurrent flow was found (Hamilton, Kim & Waleffe Reference Hamilton, Kim and Waleffe1995), which suggested the ‘self-sustaining process’ (Waleffe Reference Waleffe1997), subsequently found manifested in a UPO extracted from turbulent data (Kawahara & Kida Reference Kawahara and Kida2001). We consider three-dimensional flow, since this permits a greater variety of forcing than our previous 2D study (Lucas & Kerswell (Reference Lucas and Kerswell2015); see also van Veen & Goto (Reference van Veen and Goto2016) for a recent three-dimensional (3D) study with the usual monochromatic forcing), in particular enabling a comparison between shear-driven (e.g. plane Couette flow) and vortically driven turbulence. The vortical case has been examined previously for sustaining processes (Goto Reference Goto2008, Reference Goto2012; Yasuda, Goto & Kawahara Reference Yasuda, Goto and Kawahara2014; Goto, Saito & Kawahara Reference Goto, Saito and Kawahara2017) and so is a natural choice to tackle with a recurrent flow analysis.
2 Formulation
We consider the three-dimensional body-forced incompressible Navier–Stokes equations,
 $$\begin{eqnarray}\displaystyle & \displaystyle \frac{\unicode[STIX]{x2202}\boldsymbol{u}}{\unicode[STIX]{x2202}t}+\boldsymbol{u}\boldsymbol{\cdot }\unicode[STIX]{x1D735}\boldsymbol{u}+\unicode[STIX]{x1D735}p=\frac{1}{Re}\unicode[STIX]{x0394}\boldsymbol{u}+\boldsymbol{f}, & \displaystyle\end{eqnarray}$$
 $$\begin{eqnarray}\displaystyle & \unicode[STIX]{x1D735}\boldsymbol{\cdot }\boldsymbol{u}=0, & \displaystyle\end{eqnarray}$$
where the Reynolds number is defined as
 $Re:=\sqrt{\unicode[STIX]{x1D712}}/\unicode[STIX]{x1D708}(L_{f}/2\unicode[STIX]{x03C0})^{3/2}$
, with
 $L_{f}$
the forcing length scale,
 $\unicode[STIX]{x1D712}$
the forcing amplitude and
 $\unicode[STIX]{x1D708}$
the kinematic viscosity, having non-dimensionalised the equations with length scale
 $L_{f}/2\unicode[STIX]{x03C0}$
and time scale
 $\sqrt{L_{f}/2\unicode[STIX]{x03C0}\unicode[STIX]{x1D712}}$
(see, e.g., Chandler & Kerswell Reference Chandler and Kerswell2013; Lucas & Kerswell Reference Lucas and Kerswell2014). Two forms of forcing are considered – the first,
 $\boldsymbol{f}_{u}=\sin 2y\sin 2z\hat{\boldsymbol{x}}$
, driving a unidirectional basic flow
 $\boldsymbol{u}_{lam}:=(1/8)Re\sin 2y\sin 2z\hat{\boldsymbol{x}}$
and the second,
 $\boldsymbol{f}_{\unicode[STIX]{x1D714}}:=\sin 2y\cos 2z\hat{\boldsymbol{y}}-\cos 2y\sin 2z\hat{\boldsymbol{z}}$
, driving a unidirectional vorticity
 $\unicode[STIX]{x1D74E}_{lam}:=(1/2)Re\sin 2y\sin 2z\hat{\boldsymbol{x}}$
, where vorticity is defined as
 $\unicode[STIX]{x1D74E}=\unicode[STIX]{x1D709}\hat{\boldsymbol{x}}+\unicode[STIX]{x1D702}\hat{\boldsymbol{y}}+\unicode[STIX]{x1D701}\hat{\boldsymbol{z}}=\unicode[STIX]{x1D735}\times \boldsymbol{u}$
. The equations were solved over the periodic cube
 $[0,2\unicode[STIX]{x03C0}]^{3}$
using a fully dealiased (two-thirds rule) pseudospectral method implemented in CUDA to run on a GPU card (see Lucas & Kerswell Reference Lucas and Kerswell2014 for details). A resolution of
 $128^{3}$
was used throughout, which allowed the code to run locally (and efficiently) on a single GPU card (an M2090 6 GB Tesla card), and the flow field was initiated in Fourier space on the shell
 $2.5\leqslant |\boldsymbol{k}|\leqslant 9.5$
with complex coefficients having uniform amplitudes but randomly distributed phases such that the total enstrophy
 $\langle |\unicode[STIX]{x1D74E}|^{2}\rangle _{V}:=1/(2\unicode[STIX]{x03C0})^{3}\iiint |\unicode[STIX]{x1D74E}|^{2}\,\text{d}x\,\text{d}y\,\text{d}z=1$
. To uncover recurrent processes embedded in the turbulent attractor, a very long direct numerical simulation (DNS) data set was produced, and episodes where the flow appeared to almost repeat were identified on the fly. Flow fields from these episodes were then used to search for exactly recurring flow solutions using a Newton–GMRES–hookstep algorithm (Viswanath Reference Viswanath2007; Chandler & Kerswell Reference Chandler and Kerswell2013; Lucas & Kerswell Reference Lucas and Kerswell2015) which took months of CPU time even with GPU acceleration. Every recurring solution found was examined for its underlying dynamical processes.
3 Results
3.1 Case
 $\boldsymbol{f}_{u}$

At
 $Re=20$
(and
 $R_{thres}=0.8$
– see Lucas & Kerswell Reference Lucas and Kerswell2015), a DNS data set of duration
 $T=6\times 10^{4}$
(in units of
 $\sqrt{L_{f}/2\unicode[STIX]{x03C0}\unicode[STIX]{x1D712}}$
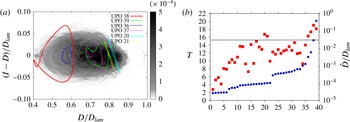
) yielded a total of 233 recurrent episodes which allowed 64 recurrent flows – 39 UPOs, 19 travelling waves (TWs) and six equilibria (EQs) – to be converged. The UPOs found are documented in figure 1 (and the supplemental material available at https://doi.org/10.1017/jfm.2017.97). Unstable periodic orbits of longer period are more difficult to isolate because they tend to be more strongly unstable (both larger unstable growth rates and more unstable directions) than shorter-period UPOs, and as a result near-recurrent episodes in the DNS are rarer and subsequent convergence is more challenging. However, longer-period orbits tend to span the turbulent attractor better (as measured by
 $\hat{D}/D_{lam}:=(\max D(t)-\min D(t))/D_{lam}$
, where
 $D=\langle |\unicode[STIX]{x1D735}\boldsymbol{u}|^{2}\rangle _{V}/Re$
is the total dissipation) and should be more representative of the dynamical processes at play, so we concentrate on these subsequently. A threshold of
 $\hat{D}=0.03D_{lam}$
(see figure 1
b) picks out six UPOs – 20, 21, 36, 37, 38, 39 – which are compared with a probability density function (p.d.f.) of the DNS in figure 1(a).
(a) Projection of dynamics onto the normalised
 $D$
–
 $(I-D)$
plane, where
 $I=\langle \boldsymbol{u}\boldsymbol{\cdot }\boldsymbol{f}_{u}\rangle _{V}$
is the energy input rate and
 $D=\langle |\unicode[STIX]{x1D735}\boldsymbol{u}|^{2}\rangle _{V}/Re$
is the dissipation rate. Grey colours represent the probability density function (p.d.f.) of the DNS with forcing
 $\boldsymbol{f}_{u}$
and lines represent converged unstable periodic orbits. (b) Distribution of period
 $T$
(blue circles) and normalised dissipation range
 $\hat{D}/D_{lam}$
(red squares) over the UPOs found.

Of these UPOs, the final four show the characteristic features of the self-sustaining-process (SSP)/vortex–wave-interaction (VWI) theory of wall-bounded shear flows in that the peak amplitudes of (small) streamwise rolls, streaks and (streamwise-dependent) waves are respectively staggered in time. The now well-known loop of events (Hall & Smith Reference Hall and Smith1991; Waleffe Reference Waleffe1997; Hall & Sherwin Reference Hall and Sherwin2010) that produce this starts with the streamwise rolls advecting the underlying shear to drive streaks, which, when they are large enough, become unstable to streamwise-dependent waves. These waves then grow by extracting energy from the streaks (which then diminish) and through wave–wave self-interaction re-energise the rolls, whereupon the process repeats. What is interesting is that the SSP/VWI process is usually invoked to explain the existence of solutions other than the basic state when the latter is linearly stable. Here, we find the same process to be operative even though the basic state is linearly unstable. To show this, the flow field of UPO 39 with the laminar state subtracted (
 $\boldsymbol{u}_{p}:=\boldsymbol{u}-\boldsymbol{u}_{lam}=u_{p}\hat{\boldsymbol{x}}+v_{p}\hat{\boldsymbol{y}}+w_{p}\hat{\boldsymbol{z}}$
) is decomposed into streaks
 $\overline{u}_{p}\hat{\boldsymbol{x}}$
, rolls
 $\overline{v}_{p}\hat{\boldsymbol{y}}+\overline{w}_{p}\hat{\boldsymbol{z}}$
and streamwise-dependent waves
 $\boldsymbol{u}_{p}-\overline{\boldsymbol{u}}_{p}$
, with the corresponding energies being defined as
 $$\begin{eqnarray}\displaystyle E_{streak}={\textstyle \frac{1}{2}}\langle \overline{u}_{p}^{2}\rangle ,\quad E_{roll}={\textstyle \frac{1}{2}}\langle \overline{v}_{p}^{2}+\overline{w}_{p}^{2}\rangle ,\quad E_{wave}={\textstyle \frac{1}{2}}\langle (\boldsymbol{u}_{p}-\overline{\boldsymbol{u}}_{p})^{2}\rangle , & & \displaystyle\end{eqnarray}$$
so that
 $E:=\langle \boldsymbol{u}_{p}^{2}\rangle /2=E_{streak}+E_{roll}+E_{wave}$
, where
 $\overline{(\cdot )}:=\int _{0}^{2\unicode[STIX]{x03C0}}(\cdot )\,\text{d}x/2\unicode[STIX]{x03C0}$
and
 $\langle (\cdot )\rangle :=\iiint (\cdot )\,\text{d}x\,\text{d}y\,\text{d}z/(2\unicode[STIX]{x03C0})^{3}$
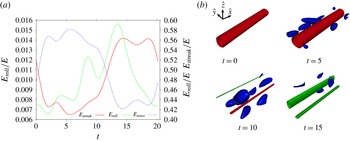
. Figure 2 shows time series for these energies, relative to the total energy, and 3D isosurfaces for a subregion best exhibiting the regeneration cycle (secondary frequencies in the time series relate to individual streaks undergoing an SSP cycle in/out of phase with each other): initially large streaks (
 $t=0$
) pump their energy into the wave field (
 $t=5$
), which then decays, pouring energy into the rolls (
 $t=10$
and
 $t=15$
), which subsequently drive the streaks. A similar plot for UPO 38 is included in the supplementary material to demonstrate the generality of this picture.
Plots showing the SSP decomposition for UPO 39. (a) Time series for the energies
 $E_{streak}$
(red),
 $E_{roll}$
(green) and
 $E_{wave}$
(blue). (b) Isosurfaces for the velocity components contributing to these energies (
 $\bar{u}_{p}=0.75$
, red;
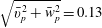 $\sqrt{\bar{v}_{p}^{2}+\bar{w}_{p}^{2}}=0.13$
, green;
 $|\boldsymbol{u}_{p}-\bar{\boldsymbol{u}}_{p}|=1$
, blue) for a subdomain chosen to best illustrate the loop of dynamics involving streaks, waves and rolls.

The key component of the SSP/VWI mechanism (in the simplest steady setting) is the presence of a neutral (small-amplitude) wave mode riding on the much larger streamwise-averaged streamwise flow
 $\overline{u}(y,z)\hat{\boldsymbol{x}}$
. For a linearly stable base flow
 $u_{lam}(y,z)\hat{\boldsymbol{x}}$
, small finite-amplitude rolls are required to adjust this to make it marginally stable (with the neutral mode so generated nonlinearly feeding back to sustain the rolls). For a linearly unstable flow, the same can clearly still happen, but now the rolls can act to stabilise
 $u_{lam}(y,z)\hat{\boldsymbol{x}}$
by making one (or perhaps more) unstable wave mode(s) on
 $u_{lam}(y,z)\hat{\boldsymbol{x}}$
neutral on
 $\overline{u}(y,z)\hat{\boldsymbol{x}}$
. The same thinking carries over to the more generic time-periodic situation, with the rolls generating streamwise flows that are on average neutrally stable to a wave mode (or collection of wave modes). For example, there are
 $12/18$
unstable directions of the streak field
 $\overline{u}_{p}$
for UPOs
 $38/39$
when the streak field is maximum and
 $2/14$
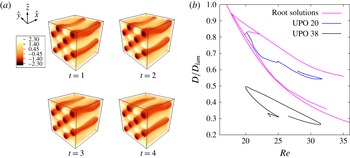
when it is minimum. This would then create finite-amplitude states through saddle node bifurcations familiar from flows like plane Couette flow and pipe flow typically unconnected to the laminar state (e.g. see UPO 38 in figure 3
b).
Since
 $u_{lam}$
is unstable, there are also ‘derivative’ states which arise through a continuous sequence of bifurcations off the laminar state; UPO 20 is a typical example shown in figure 3(a). Long-wavelength streamwise disturbances propagate on top of the base flow, consistent with the long-wavelength instability of Kolmogorov flow (Meshalkin & Sinai Reference Meshalkin and Sinai1961), and the streak field is small and varies very little. As a result, there is no stability change of
 $u(y,z)\hat{\boldsymbol{x}}$
for UPO 20 over a cycle: 20 unstable directions are always found for
 $\overline{u}_{p}$
compared with the 32 unstable directions for
 $u_{lam}(y,z)\hat{\boldsymbol{x}}$
. Since both SSP/VWI UPOs and ‘derivative’ UPOs have been extracted directly from turbulent DNS at
 $Re=20$
(and by implication are therefore embedded in the turbulent attractor), the overall conclusion of our computations at
 $Re=20$
is that both are dynamically important in the complex dynamics observed.
(a) A rendering of the streamwise velocity,
 $u\hat{\boldsymbol{x}},$
for UPO 20 at four snapshots. This shows the propagation of long-wavelength streamwise disturbances along the base flow. (b) A bifurcation diagram for UPOs 20 and 38 showing, through a sequence of bifurcations (three), the connection to the base flow
 $u_{lam}$
(where
 $D/D_{lam}=1$
) at
 $Re\approx 17$
for UPO 20, but no such connections for UPO 38.

At
 $Re=30$
, a time integration of
 $T=1.6\times 10^{5}$
finds 67 guesses; however, none of these can be converged to invariant solutions presumably because these are becoming more unstable. To quantify this, all six large-
 $\hat{D}$
UPOs were continued up in
 $Re$
from 20 using the arclength continuation. All continuations quickly turned back (figure 3 shows two such continuations), retreating to lower
 $Re$
, with only three out of the six UPOs (UPOs 20, 21 and 38) extending beyond
 $Re=30$
. UPO 21 reaches the furthest (
 $Re=42$
), and by then its instability has considerably increased by two complementary measures: (a) the sum of the unstable growth rates more than quadruples and (b) the number of unstable directions jumps from 20 to 93. The other UPOs show similar rapid destabilisation (e.g. the dimension of the unstable manifold for UPO 37 jumps from 15 at
 $Re=20$
to 58 at
 $Re=27$
, while that for UPO 20 increases from 25 at
 $Re=20$
to 67 at
 $Re=30$
). These figures suggest that the dimension of the chaotic attractor very quickly increases as
 $Re$
increases beyond 20.
3.2 Case
$\boldsymbol{f}_{\unicode[STIX]{x1D714}}$

For unidirectional vorticity forcing at
 $Re=15$
, a DNS of duration
 $T=10^{4}$
with
 $R_{thres}=0.8$
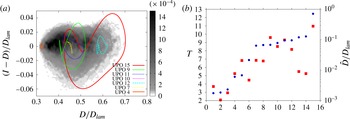
yielded a total of 600 recurrent episodes, from which 22 unstable recurrent flows – 15 UPOs, three TWs and four EQs – were converged with the Newton–GMRES–hookstep algorithm. Figure 4 shows the projection of the six UPOs with largest
 $\hat{D}$
and a p.d.f. of the DNS trajectory on the
 $(I-D)/D_{lam}$
versus
 $D/D_{lam}$
plane. These solutions can be classified into three categories.
(a) Projection of dynamics onto the normalised
 $D$
–
 $(I-D)$
plane, where
 $I=\langle \boldsymbol{u}\boldsymbol{\cdot }\boldsymbol{f}_{u}\rangle _{V}$
is the energy input rate and
 $D=\langle |\unicode[STIX]{x1D735}\boldsymbol{u}|^{2}\rangle _{V}/Re$
is the dissipation rate. Grey colours represent the p.d.f. of the DNS with forcing
 $\boldsymbol{f}_{\unicode[STIX]{x1D714}}$
and lines represent converged unstable periodic orbits. (b) Distribution of period
 $T$
(blue circles) and normalised dissipation range
 $\hat{D}/D_{lam}$
(red squares) over the set of 15 UPOs.

The simplest solutions are two-dimensional. As an example, UPO 15, which has the largest
 $\hat{D}$
, shows a classical 2D loop of vortex merger and splitting with no variations in the
 $x$
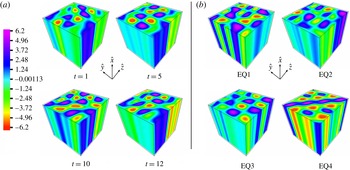
direction. This type of process was examined in detail in 2D Kolmogorov flow in Lucas & Kerswell (Reference Lucas and Kerswell2015). All four equilibria are 2D states and are shown in figure 5.
Snapshots in isometric view of the axial vorticity
 $\unicode[STIX]{x1D709}$
for the two-dimensional UPO 15 (a) and steady states EQ1–4 (b) in the case
 $\boldsymbol{f}_{\unicode[STIX]{x1D714}}$
.

The second type of solution breaks the
 $x$
-translational symmetry, but shows quite low-amplitude time dependence in the form of vortex waves (Kelvin modes) on the basic vortex tubes. This describes most of the low-amplitude (small-
 $\hat{D}$
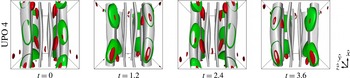
) UPOs, with figure 6 showing an example, UPO 4, which was the UPO converged most frequently (eight times) from the recurrent guesses. Here, as in the other low-amplitude UPOs, the three-dimensionality is provided by a dominant
 $k_{z}=1$
long axial wavelength in the solutions. These first and second types of solution are clearly ‘derivative’ states, which can be smoothly traced back, via a small number of bifurcations, to the laminar solution as
 $Re$
is reduced.
Isometric view of vorticity isosurfaces (
 $|\unicode[STIX]{x1D709}|=3$
coloured grey,
 $|\unicode[STIX]{x1D702}|=0.5$
coloured red and
 $|\unicode[STIX]{x1D701}|=0.5$
coloured green) for UPO 4 in case
 $\boldsymbol{f}_{\unicode[STIX]{x1D714}}.$
This UPO exhibits the growth and propagation of bending modes of the basic vortex tubes.

Isometric view of vorticity isosurfaces (
 $|\unicode[STIX]{x1D709}|=4$
coloured grey,
 $|\unicode[STIX]{x1D702}|=1.5$
coloured red and
 $|\unicode[STIX]{x1D701}|=1.0$
coloured green) for UPO 9 in case
 $\boldsymbol{f}_{\unicode[STIX]{x1D714}}$
. It should be noticed that here we show a quarter of the domain to focus attention on the generation of transverse vorticity about the stagnation point.

The third type of solution has larger
 $\hat{D}$
(excluding the outlying 2D state, UPO15), with UPOs 7 and 9 being prime examples. These UPOs exhibit some of the characteristics of the other solutions, i.e. shift-and-reflect and
 $x$
-invariance symmetry breaking, but also more complex nonlinear behaviour too. This is generally manifested by larger-amplitude bending of axial vortex tubes and consequently more substantial production of transverse vorticity. The transverse vorticity is observed principally organised at the hyperbolic stagnation points, e.g. figure 7, but sometimes as localised toroidal vortex tubes about the basic axial vorticity, e.g. figure 8.
Figure 7 shows a quarter of the domain of UPO 9 and highlights the production of stagnation point transverse vorticity in the form of a thin vortex sheet. This occurs when the main axial vortex tubes are arranged such that adjacent vortices are bent towards each other, thereby increasing the local shear. In this region, the anti-parallel vortex lines will viscously reconnect if they approach closely enough, resulting in transverse vorticity which is then stretched into thin sheets by the background strain. This has some similarity to the transient growth enhancement in Taylor–Green vortices reported by Gau & Hattori (Reference Gau and Hattori2014), where linear non-modal energy optimals show concentrated growth near the hyperbolic stagnation points. Following this production phase, the thin sheet decays due to viscosity and the axial vorticity is re-energised by the forcing. It should be noted that while this is observed in one vortex ‘cell’, other vortex tubes are meanwhile undergoing similar, but distinct, interactions out of phase with the one presented here. This makes quantitative analysis of precise isolated mechanisms a challenge, and indicates that precise periodicity of invariant solutions may be quite rare.
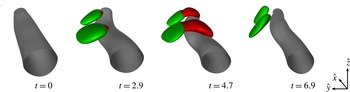
Figure 8 shows a close-up of an individual vortex tube in UPO 7 as it goes through another type of periodic cycle. The initially straight vortex tube gives rise to a growing patch of azimuthal vorticity (see
 $t=2.9$
and
 $t=4.7$
) before it dies away (at
 $t=6.9$
). This evolution is reminiscent of the ‘anti-lift-up’ mechanism found in Antkowiak & Brancher (Reference Antkowiak and Brancher2007). Here, azimuthal streaks are found to be the (linear) transient energy growth optimal for vortex tubes, evolving into much larger-amplitude azimuthal vortices (rolls), as opposed to the generic lift-up mechanism in unidirectional shear flow of streamwise rolls growing into much larger streamwise streaks (Farrell Reference Farrell1988).
Isometric view of vorticity isosurfaces (
 $|\unicode[STIX]{x1D709}|=4.5$
coloured grey,
 $|\unicode[STIX]{x1D702}|=1$
coloured red and
 $|\unicode[STIX]{x1D701}|=1$
coloured green) for UPO 7 in case
 $\boldsymbol{f}_{\unicode[STIX]{x1D714}}$
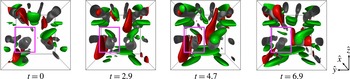
. Here, we show the full domain, including the subdomain of figure 9 (highlighted with a magenta box), in order to show the complexity of the processes occurring.

The existence of this ‘new’ transient growth mechanism could suggest the existence of an alternative type of self-sustaining process where the roles of the rolls and streaks (now defined relative to a different basic state so that, for example, ‘streamwise-independent’ means axisymmetric) are reversed. However, Rincon, Ogilvie & Cossu (Reference Rincon, Ogilvie and Cossu2007) argued convincingly against this possibility in the context of the Keplerian disk problem, where the basic flow field is well known to be linearly stable. Here, our situation is rather different since the basic flow is unstable at this
 $Re$
and so (as argued for the shear case above) the growing azimuthal rolls have more flexibility in manufacturing a (non-axisymmetric) wave mode which is neutral on average about the (now axially and radially varying) vortex to drive the (small) azimuthal streaks. The core problem that Rincon et al. (Reference Rincon, Ogilvie and Cossu2007) identified, however, remains that the evolving finite-amplitude roll field interacts nonlinearly with itself and therefore is much more tightly constrained than the streak field in the SSP, which does not self-interact due to its streamwise independence.
Nevertheless, Goto et al. (Reference Goto, Saito and Kawahara2017) (see also Goto Reference Goto2008, Reference Goto2012) do report that ‘daughter’ vortices are often observed in vortically driven turbulence forming in the large-scale strain regions, perpendicular to their ‘parents’ in anti-parallel pairs, and conjecture that this may be a driving mechanism for the turbulent cascade process. Here, we see a similar picture emerge from the converged UPOs (e.g. figure 7), although we do not see the same scale separation and only one generation of offspring, both presumably due to the low Reynolds number used here.
The full dynamics of the UPOs is typically more complex than the individual interactions we have so far highlighted. For example, figure 9 shows the full domain of UPO 7, where the coherence between different cells appears to be lost. Furthermore, while we have discussed two possible transient growth mechanisms postulated before (Antkowiak & Brancher Reference Antkowiak and Brancher2007; Gau & Hattori Reference Gau and Hattori2014), the ‘base flow’ in these UPOs is not really the low-
 $Re$
laminar solution, but rather other averaged configurations arising from saturated instabilities such as the 2D states shown in figure 5.
Isometric view of vorticity isosurfaces (
 $|\unicode[STIX]{x1D709}|=4.5$
coloured grey,
 $|\unicode[STIX]{x1D702}|=1$
coloured red and
 $|\unicode[STIX]{x1D701}|=1$
coloured green) for UPO 7 in case
 $\boldsymbol{f}_{\unicode[STIX]{x1D714}}$
. It should be noticed that here we show a subdomain to focus attention on the generation of azimuthal vorticity around a vortex tube.

4 Discussion
Unstable solutions have been extracted directly from 3D body-forced turbulence for the first time at least at modest
 $Re$
. Two distinct forms of forcing, unidirectional in either the velocity or the vorticity field, have been compared and the unstable orbits analysed to reveal possible sustaining mechanisms at work in these flows. When the forcing produces a unidirectional velocity with background shear, the UPOs found partition into two groups: those that originate from a linear instability of the base state – ‘derivative’ states – and those (generally of larger amplitude) that do not, which show the characteristic features of the SSP/VWI process (Hall & Smith Reference Hall and Smith1991; Hamilton et al.
Reference Hamilton, Kim and Waleffe1995; Waleffe Reference Waleffe1997). The key new realisation here is that SSP/VWI UPOs can be built upon a
 $u(y,z)\hat{\boldsymbol{x}}$
base flow when it is unstable. It has already been observed that SSP/VWI states can arise for a linearly stable base flow and subsequently co-exist with ‘derivative’ states connected to the base flow once it becomes linearly unstable at higher
 $Re$
(e.g. channel flow). However, here the base flow becomes linearly unstable before (at lower
 $Re$
) the SSP/VWI states arise. Our calculations indicate that ‘derivative’ UPOs and SSP/VWI UPOs are both dynamically important (embedded in the turbulent attractor) in the complex flows computed at least at
 $Re=20$
.
The situation is more complicated when the forcing is unidirectional in the vorticity. A number of steady and time-dependent two-dimensional states are extracted from the 3D turbulence, indicating that at this relatively low
 $Re$
, 2D vortex dynamics can still play a role. Beyond these states, bending modes of the main vortex tubes provide the simplest three-dimensional behaviour. Transverse vorticity is then observed to arise from two different transient growth mechanisms: stagnation point generation (Gau & Hattori Reference Gau and Hattori2014) and local azimuthal generation (Antkowiak & Brancher Reference Antkowiak and Brancher2007). The former is a feature of the global structure of the flow – driven vortices in periodic cells – and is difficult to avoid unless a single driven vortex is treated in isolation. The latter is particularly interesting in that it has recently been conjectured as the central process in the turbulent cascade (Goto et al.
Reference Goto, Saito and Kawahara2017) and may form a key stage in a new self-sustaining process. The existence of such a process would allow finite-amplitude states to exist without having to rely on a linear instability as an energy input. Put another way, in the absence of any such process, no other states should exist for any driven vortical state that is linearly stable for all
 $Re$
. This would mean no turbulence, in contrast to the unidirectional shear situation where SSP/VWI exists. However, we have been unable to confirm this in the periodic flow configuration studied here, where multiple vortex tubes are driven in one domain across which periodicity is assumed. This gives rise to a complicated array of linear instability modes which are either global (reaching across multiple vortex tubes) or localised to one tube (Gau & Hattori Reference Gau and Hattori2014).
One notable outcome of this work is the very limited success of recurrent flow analysis as
 $Re$
is increased. Undoubtedly this is because the dimension of the chaotic attractor increases steeply, as indicated by the rapid destabilisation of UPOs continued up from lower
 $Re$
. Future work will have to concentrate on this difficulty, which is clearly more pronounced in 3D than 2D (Lucas & Kerswell Reference Lucas and Kerswell2015), to make searches for recurrent flows as efficient as possible. The results presented here are the result of many months of wall time even with the substantial savings afforded by GPU-accelerated time stepping. Possible improvements may come from quotienting out the continuous symmetries (Willis, Cvitanović Avila Reference Willis, Cvitanović and Avila2013), which will reduce the overall degrees of freedom in the problem and remove the relative translations of states. A novel pre-processing of guesses prior to GMRES–Newton iterations to pre-condition or filter them with the goal of increasing the overall convergence rate may also improve efficiency (Farazmand Reference Farazmand2016). Savings may also be made by employing a windowing method to concentrate numerical effort on some precise subdomain of interest, thereby focusing on localised behaviour and again reducing the overall degrees of freedom in the problem (Teramura & Toh Reference Teramura and Toh2014).
Acknowledgements
We would like to thank S. Goto for helpful discussions and for sharing his submitted manuscript (Goto et al. Reference Goto, Saito and Kawahara2017) with us, and the anonymous referees for their helpful suggestions. We are also grateful for numerous free days of GPU time on ‘Emerald’ (the e-Infrastructure South GPU supercomputer: http://www.einfrastructuresouth.ac.uk/cfi/emerald) and the support of EPSRC through grant no. EP/H010017/1.
Supplementary material
Supplementary material is available at https://doi.org/10.1017/jfm.2017.97.