Introduction
Tropical and sub-tropical estuarine ecosystems are understudied, especially when compared to temperate estuaries (Bowen and Valiela Reference Bowen and Valiela2008; Vieillard et al. Reference Vieillard, Newell and Thrush2020), and there has been little focus on the basic ecology of tropical urban estuaries (Oczkowski et al. Reference Oczkowski, Santos, Martin, Gray, Hanson, Watson, Huertas and Wigand2020a, Reference Oczkowski, Santos, Gray, Miller, Huertas, Hanson, Martin, Watson and Wigand2020b). Tropical estuaries are among the most vulnerable to urbanisation and, as they are at sea level, are particularly vulnerable to climate change effects like sea-level rise, hurricanes, and storm surges (e.g. McGranahan et al. Reference McGranahan, Balk and Anderson2007). Given insufficient knowledge about how low-latitude estuaries function, scientists and managers have been applying conceptual frameworks developed in temperate estuaries to tropical estuaries. This, however, may lead to inaccurate assessments. For example, in temperate estuaries, water quality monitoring using traditional indices like nutrient concentrations, water clarity, and biological oxygen demand would identify all mangrove lagoons as polluted, regardless of whether they were or not, as such systems are characterised by natural low light conditions and high turbidity (Webber et al. Reference Webber, Webber and Ford2018). Conversely, we often use high phytoplankton biomass as an indicator of eutrophication, but mangrove tannins may suppress plankton growth; naturally low phytoplankton populations could lead coastal managers and scientists to fail to recognise eutrophic areas of concern (Webber et al. Reference Webber, Webber and Ford2018). Further, the physical drivers and variability of nutrient delivery via rivers and upland runoff are different in tropical and temperate systems, which also drives differences in patterns of primary production (e.g., Bowen and Valiela Reference Bowen and Valiela2008; Eyre and Balls Reference Eyre and Balls1999; Nittrouer et al. Reference Nittrouer, Brunskill and Figueiredo1999). There is an increasing awareness that scientific research of coastal systems must continue to extend to tropical and sub-tropical coastal systems so that effective management strategies can be developed for all coastal systems and not just those in temperate northern latitudes (Neumann et al. Reference Neumann, Vafeidis, Zimmermann and Nicholls2015; Vieillard et al. Reference Vieillard, Newell and Thrush2020).
Stable isotopes of nitrogen (δ15N) and carbon (δ13C) may be a useful tool to examine some of the differences in temperate and tropical estuaries (Fry Reference Fry2006). In temperate areas, measurements of δ15N are often used as an indicator of urbanisation, where human-associated nutrient runoff, like that from sewage and overland flow, is associated with higher δ15N values (>6 ‰) than one would otherwise measure in less impacted or unimpacted coastal regions (<6 ‰, e.g., Costanzo et al. Reference Costanzo, Udy, Longstaff and Jones2005; Oczkowski et al. Reference Oczkowski, Nixon, Granger, El-Sayed and McKinney2009; Xuan et al. Reference Xuan, Tang, Liu and Cao2020), while δ13C can indicate organic matter source and in situ carbonate chemistry and productivity (Fry Reference Fry2006; Oczkowski 2018; Cotovicz et al. Reference Cotovicz, Knoppers, Deirmendjian and Abril2019). Estuarine biota often reflect upstream sources, where higher δ15N values are measured in plants and animals receiving anthropogenic nitrogen (Costanzo et al. Reference Costanzo, Udy, Longstaff and Jones2005, Oczkowski et al. Reference Oczkowski, Nixon, Granger, El-Sayed and McKinney2009, Fry Reference Fry2006) or, in the case of δ13C, plant metabolic pathways (Fry Reference Fry2006). These traditional relationships between urban source and in situ sink may look different in tropical estuaries. For example, among their results, Bowen and Valiela (Reference Bowen and Valiela2008) observed a decoupling of urban N sources and sinks at a tropical estuarine site, where submerged and attached vegetation had much lower δ15N values than watershed contributions, implying that urban wastes carried by groundwater were contributing little N to the primary producers.
In a survey of subtidal sediment nutrient content and nitrogen and carbon stable isotope values from the San Juan Bay Estuary (SJBE) in Puerto Rico, we also observed unexpectedly low δ15N values (<2 ‰), but high nitrogen content, in the estuarine surface sediments in the most intensely urbanised part of the estuary (Oczkowski et al. Reference Oczkowski, Santos, Martin, Gray, Hanson, Watson, Huertas and Wigand2020a). The Caño Martín Peña (CMP) receives urban runoff and untreated sewage and has both the longest residence time and lowest δ15N values in the SJBE. There are a few sources of low δ15N to explain these observations, the two predominant ones being synthetic fertiliser application and fixation of N2 (both with a δ15N range of −2 to +2‰, Fry Reference Fry2006). We suggested that the low δ15N values in the sediment may reflect N2 fixation as the samples were not collected near agricultural areas or lawns that use low δ15N fertiliser (Oczkowski et al. Reference Oczkowski, Santos, Martin, Gray, Hanson, Watson, Huertas and Wigand2020a). Evidence for fixation, via low δ15N values, was observed in other parts of the estuary and complementary work using dated sediment cores found low δ15N values associated with recent urbanisation and infilling of the least flushed parts of the estuary (Oczkowski et al. Reference Oczkowski, Santos, Gray, Miller, Huertas, Hanson, Martin, Watson and Wigand2020b). Mangroves surround much of the SJBE, and high rates of N2 fixation have been measured in mangrove forests, where fixation can supply about half of mangrove N demand; these rates do not appear to be influenced by nitrogen availability (Holguin et al. Reference Holguin, Vázquez and Bashan2001, and references therein). Further, microbial mats on the surface of subtidal and intertidal lagoonal sediments in low latitudes have also been shown to fix N2 (Alonso-Hernández et al. Reference Alonso-Hernández, García-Moya, Tolosa, Díaz-Asencio, Corcho-Alvarado, Morera-Gómez and Fanelli2017, Reference Alonso-Hernández, Fanelli, Diaz-Asencio, Santamaría and Morera-Gómez2020; Bouton et al. Reference Bouton, Vennin, Thomazo, Mathieu, Garcia, Jaubert and Visscher2020). Fixation has been metabolically linked with sulphate reduction and possibly methane production (Holguin et al. Reference Holguin, Vázquez and Bashan2001; Reis et al. Reference Reis, Nardoto and Oliveira2017, Reference Reis, Reed, Oliveira and Nardoto2019; Shiau et al. Reference Shiau, Lin, Tan, Tian and Chiu2017, Shiau et al. Reference Shiau, Lin, Yam, Chang, Wu, Hsu and Chiu2021) and positively correlated to carbon supply (O’Neil and Capone Reference O’Neil and Capone1989; Bhavya et al. Reference Bhavya, Kumar, Gupta, Sudheesh, Sudharma and Varrier2016; Shiau et al. Reference Shiau, Lin, Tan, Tian and Chiu2017). The surprising observation from these studies is that, in the tropics, urban runoff may not be the primary source of N to the estuarine primary producers and the benthos, despite apparently high nutrient loads.
Here, we seek to address the hypothesis that the biogeochemical drivers of water column chemistry in tropical urban estuaries are different from those in temperate systems by seeing whether the unexpectedly low δ15N values measured in the surface sediments in the SJBE might also be observed in the water column. This study is intended to be a first step to document the potential for water column N2 fixation in a tropical urban estuary. More broadly, the results of this study identify knowledge gaps in our fundamental understanding of tropical coastal nutrient biogeochemistry. This work also provides critical baseline information that can be used to identify the effects of both urban development and restoration on tropical urban estuaries, including, specifically, the SJBE, which is currently undergoing a major restoration project.
Materials and methods
Site description
The SJBE has a sub-tropical moist climate, with the driest months in the winter (February and March) and heavy rains most common in the spring and summer months (Holdridge Reference Holdridge1967; Méndez Lázaro et al. Reference Méndez Lázaro, Santiango Nieves and Miranda Bermúdez2014). The watershed is roughly 240 km2, and the estuary proper, which is a series of interconnected bays, canals, and lagoons, covers about 25 km2 (Bunch et al. Reference Bunch, Cerco, Dortch, Johnson and Kim2000). Here, we consider the SJBE as a series of interconnected sub-regions, distinguished by their morphological characteristics (Fig. 1). They are, from west to east: The San Juan Bay, the western CMP, the eastern CMP, San José Lagoon, Caño Suárez, Torrecilla Lagoon, and Piñones Lagoon. The watershed, including all the land adjacent to the waterbodies, is primarily underlain with quaternary alluvium, artificial fill, quartz sands, and mangrove and swamp deposits (Webb and Gómez Gómez Reference Webb and Gómez Gómez1998). The SJBE is largely urban, with a clear urbanisation gradient from west to east. Where the communities adjacent to the CMP have population densities on the order of 8775 people per km2, the eastern Piñones Lagoon is surrounded by the largest intact mangrove forest on the island (Fig. 1, Army Corps 2016). Almost the entire estuary, except for Piñones Lagoon, has been heavily modified by dredging and infilling. For example, the CMP went from a reported 1.5–3 m depth and 61–122 m width in its eastern half to entirely filled in spots by the early 2000s (US ACE 2004, 2016). The western half of the CMP was dredged and straightened in the early 1900s and then dredged again in the mid-1980s (US ACE 2016). The Suarez Canal received similar treatment—dredging and straightening—in the 1960s (Ellis Reference Ellis1976). The tidal ranges are about 60 cm in the portions of the SJBE with open exchange with the sea (Torrecilla and San Juan Bay; Fig. 1; Webb and Gómez-Gómez Reference Webb and Gómez Gómez1998) but only ∼5 cm in San José Lagoon and Piñones, which have no direct exchange with the ocean (Bunch et al. Reference Bunch, Cerco, Dortch, Johnson and Kim2000, GLM Engineering Group, PSC 2020).
This map of the San Juan Bay Estuary (SJBE) in Puerto Rico shows the individual sampling locations as well as the regional delineations of the sub-regions of the Estuary. Boat Week refers to the samples that were only collected monthly, from boats, in collaboration with the San Juan Bay Estuary Partnership. Boat & Land Weeks refers to the samples that were collected, via pole sampler, from land during both of the monthly sampling events, which were spaced approximately two weeks apart. Where possible, station locations (and names) were based on the San Juan Bay Estuary Partnership monitoring program (https://estuario.org/landing-page-2021-en/).

Field collection
Between April 26, 2021, and April 25, 2024, water samples were collected via two discreet sampling efforts per month, from 16 stations, throughout the SJBE (Fig. 1). The first sampling was conducted in conjunction with the San Juan Bay Estuary Partnership (SJBEP), over three days, where we collected water samples at a subset of their monthly monitoring stations. We refer to this sampling as ‘boat-based’, because samples were primarily collected by boat. To increase the temporal resolution of the dataset, particularly in the CMP region, we then conducted a second monthly sampling approximately two weeks later, entirely from land and in collaboration with students at Universidad del Sagrado Corazón, which we refer to as ‘land-based’, as all samples were collected from land.
At each station, two 1-litre bottles of water were used to collect the samples: one bottle for nutrient analysis and one for microbial analysis. Samples were collected from the boat by dipping the bottles just below the water surface to fill them and then placing them in a cooler, on ice (approximately 4 ± 2°C) until arrival at the laboratory for processing. Shore-based samples were collected via a pole sampler. In situ measurements of conductivity, salinity, pH, dissolved oxygen (DO, mg L-1), barometric pressure (mm Hg), and temperature (°C) of the water were taken with a calibrated YSI multi-parameter metre (YSI Inc., Yellow Springs, OH).
Boat-based sampling details
Sixteen water samples were collected across the SJBE over three consecutive days. We sampled water from a subset of stations routinely monitored by the SJBEP (https://estuario.org/chemical-and-physical-properties/), with some additional stations incorporated to expand the data collection network and target areas of the estuary not accessible by boat (Table S1, Fig. 1). On the first day, water samples were collected from stations in San Juan Bay (BSJ1, BSJ2, BSJ3) and CMP (CMP1, CMP2). On the second day, the stations sampled included Torrecilla Lagoon (LT1, LT2), the Suárez Channel (CS1, CS2), San José Lagoon (LSJ1, LSJ2), and Los Corozos Lagoon (LLC). The third day was dedicated to sampling locations inaccessible by boat, including Caño Martín Peña West (CMPW), Caño Martín Peña East (CMPE), San José Lagoon 3 (LSJ3), and Piñones Lagoon (LP1).
Land-based sampling details
In the first two years of the land-based sampling (May 11, 2021 to December 29, 2022), the entire shore-based sampling occurred over two days: the first covering CMP2, CMPW, CMPE, and LSJ3, and the second day covering LP1, LT1, and CS2. Land-based sampling was conducted in collaboration with volunteer students from the Universidad del Sagrado Corazón. In the third year, beginning on January 12, 2023, through April 25, 2024, the land-based sampling was consolidated into one day, reducing the sampling stations to CMP2, CMPW, CMPE, LSJ3, and CS2, with Universidad del Sagrado Corazón leading the land-based sampling events, with a reduced suite of parameters: while they still collected water samples for faecal indicators and made in situ measurements of physico-chemical parameters using a YSI multi-parameter probe, the reduced sampling omitted the stable isotope and nutrient analyses described below.
Lab processing of water
Filtration for nutrients
Upon arrival at the Puerto Rico Department of Natural and Environmental Resources, Environmental Research Laboratory, each water sample was filtered in duplicate through pre-combusted (450 °C, 6 hours) glass fibre filters (Whatman GFF, 0.7 µm pore size, 25 mm diameter) using filter flasks with funnels attached to an electric vacuum pump. Two filters were processed per station, with the same volume of sample water filtered for each duplicate. The final volume was documented, ensuring that the same volume was filtered for both duplicates, with a maximum of 400 mL per filter. Filtrate and filters were stored at −20°C until shipment on dry ice to the EPA lab in Narragansett, Rhode Island, for further analysis. Between samples, the filter funnels were rinsed three times with deionised (DI) water, and new flasks were used for each station to avoid cross-contamination.
Enterococcus analysis
Water samples were analysed for concentrations of Enterococcus using the Defined Substrate Method, which provides results within 24 hours as described in the IDEXX Enterolert assay (IDEXX Laboratories, Inc., Westbrook, Maine, USA). The IDEXX Quanti-Tray/2000 system was employed to determine the culturable concentrations, expressed as the most probable number (MPN) per 100 mL, with 10 MPN/100 mL as the minimum detection limit and 24,193 MPN/100 mL as the upper limit of detection. Following IDEXX standard procedures, samples were processed within 6 hours of collection. Prior to analysis, sample bottles were vigorously shaken to ensure homogeneity, and a 1:10 dilution was prepared by adding 10 mL of the water sample to 90 mL of sterile water in a sterile vessel containing sodium thiosulphate. For samples from locations with anticipated high bacterial concentrations (based on prior sampling), a 1:100 dilution was performed to prevent results exceeding the upper detection threshold. This adjustment was implemented after observing that bacterial concentrations in initial analysis for CMP samples exceeded the upper quantifiable range of the Quanti-Tray/2000 system. Enterolert was then added, and the vessels were gently shaken to mix. All tests were performed in duplicates to ensure accuracy. The mixtures were poured into Quanti-Tray/2000 trays, containing 97 wells each, sealed and incubated for 24 hours at 41 ± 0.5°C.
After 24 hours of incubation, wells were examined under UV light (6-watt, 365-nm UV light) in a dark environment. Wells exhibiting fluorescence indicated a positive result for Enterococci. Non-fluorescing wells were considered negative. The number of positive wells was recorded, and MPN values of Enterococci per 100 mL of sample were calculated using the Quanti-Tray/2000 MPN table, IDEXX table, and the dilution factor used. For data analysis purposes, concentrations below the lower limit of detection (10 MPN/100 ml) were reported as a value of 10 MPN/100 mL and concentrations above the upper detection threshold (24,196 MPN/100 ml) were assigned a value of 24,196 MPN/100 ml.
Nutrient analyses
Analyses for ammonium (NH4 +), nitrate+nitrite (NO3 −+NO2 −), nitrite (NO2 −), and orthophosphate (PO4 3−) were run simultaneously on two connected Astoria 2 segmented flow analysers (Astoria-Pacific, Clackamas, Oregon, USA). EPA methods (350.1, 353.2, and 365.1) were followed for all analyses. Samples were calibrated against a minimum five-point standard curve for each analyte (NSI Lab Solutions, Raleigh, NC, USA). Check standards from a secondary source (LabChem Inc, Zelienople, PA, USA) were run every 15 samples, with an allowable 20% difference, and ultrapure DI water blanks were run every 10 samples for drift and baseline corrections. Based on check standards, sample reproducibility was better than 20%.
Particulate and stable isotope analyses
Frozen filters were dried in a 60°C oven for at least 48 hours. Dried filters were rolled into tinfoil squares and pelletised using a pellet press. Pellets were then analysed for N and C stable isotopes using an Elementar Vario Select elemental analyser connected via continuous flow to an Isoprime visION ratio mass spectrometer (Elementar Americas, Ronkonkoma, NY, USA). Working standards of blue mussel homogenate (δ13C = −18.3‰, δ15N = 11.2‰) were calibrated against isotope standard reference materials, including United States Geological Survey (USGS) 40 (δ13C = −26.39‰, δ15N = −4.52‰) and USGS 41a (δ13C = 37.63‰, δ15N = 47.57‰) to the air (δ15N) and Vienna Pee Dee Belemnite (δ13C) scales (Balint et al. Reference Balint, Schwartz, Fowler, Linnekogel, Clemons and Burkemper2024). Isotope values are expressed in δ notation where δX (‰) = [(R sample/R standard) − 1] × 103 where X is 13C or 15N and R is 13C/12C or 15N/14N, respectively. USGS 40, USGS 41a, acetanilide, cystine, and internal working standards were included every 48 samples, as well as at the beginning and end of the run. Duplicate samples were analysed in separate runs, with variance between duplicates generally better than 0.3‰. The precision of the laboratory standards was better than ± 0.3‰ for isotope values, based on long-term replication. Particulate N and C content was calculated by comparing sample peak areas to a standard curve of peak area plotted against elemental composition of standard reference material cystine (%C = 30.0%, %N = 11.7%) with USGS40 (%C = 40.8%, %N = 9.5%) and acetanilide (%C = 71.09%, %N = 10.36%) used as a quality control. We divided the N and C content by the volume of water filtered to yield concentrations of particulate N and C in mg/l.
Data analysis and management
To determine differences in stable isotope values among regions of the SJBE, we used a generalised linear mixed model that accounts for heteroscedasticity by station and for non-independence of residuals by stations within regions (e.g., Bates et al. Reference Bates, Maechler, Bolker, Walker, Christensen, Singmann, Dai, Grothendieck, Green and Bolker2015) and a linear regression model to compare δ15N values to DIN concentrations. We used ANOVA to compare salinity, dissolved inorganic nitrogen (DIN) concentrations, and δ15N values between rainy (May through November) and dry (December through April) seasons for each of the regions. All data manipulation was done in R version 2024.04.2. Figures were created in R, using ggplot (Wickham Reference Wickham2016), with the exception of the last figure, which was created using SigmaPlot 15.0. All data are available on Zenodo (https://zenodo.org/records/15181650).
Results
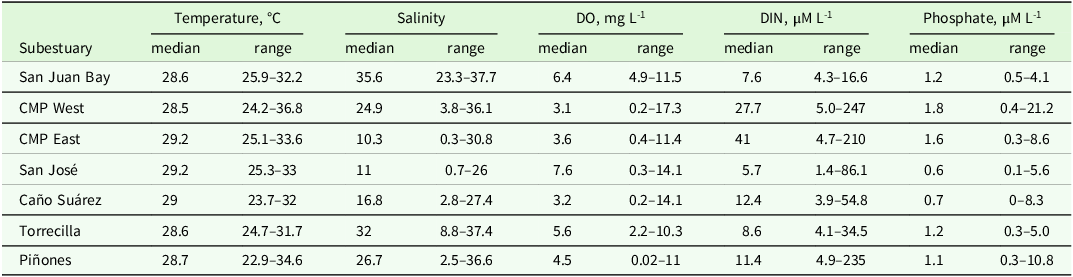
Across all the sub-regions of the SJBE, the median temperature was 29°C during the study period (Table 1). Salinity was more variable, although there were no significant differences between wet (May through November) and dry (December through April) seasons (Table 1, Fig. S1). CMP East and San José Lagoon, the innermost and presumably most poorly flushed portions of the estuary, had median salinity values of 10 and 11, respectively. The highest median values were from the San Juan Bay and La Torrecilla Lagoon (henceforth Torrecilla Lagoon), both of which have open exchange with the ocean. Salinity values ranged widely across the study period. Both CMP East and CMP West, as well as Piñones, had salinity ranges >30. The salinity range was narrowest (∼14) in San Juan Bay (Table 1, Fig. S1).
The median and range of values measured for temperature, salinity, dissolved oxygen (DO), dissolved inorganic nitrogen (DIN), and phosphate for each sub-region of the San Juan Bay Estuary

Dissolved oxygen (DO) concentrations were lowest in the channels of the SJBE, where median values were hypoxic (e.g., <5 mg/l) in CMP West (3.1 mg/l), CMP East (3.7 mg/l), and Suárez Canal (3.2 mg/l), which is the acceptable lower limit for surface water set by the Government of Puerto Rico’s Department of Natural and Environmental Resources (DRNA 2022; Table 1). We periodically measured values <5 mg/l in every region of the estuary that does not have direct ocean exchange, indicating that they were at times hypoxic. While DO concentrations occasionally dipped in the lagoons (San José, Torrecilla, Piñones), the CMP, Suárez Canal, and Piñones were frequently hypoxic (Fig. 2).
Dissolved oxygen concentrations, measured approximately twice a month over the study period, for each region of the San Juan Bay Estuary. Samples with concentrations that were below the 5 mg/L guideline, and located below the black horizontal line, indicate hypoxic conditions.

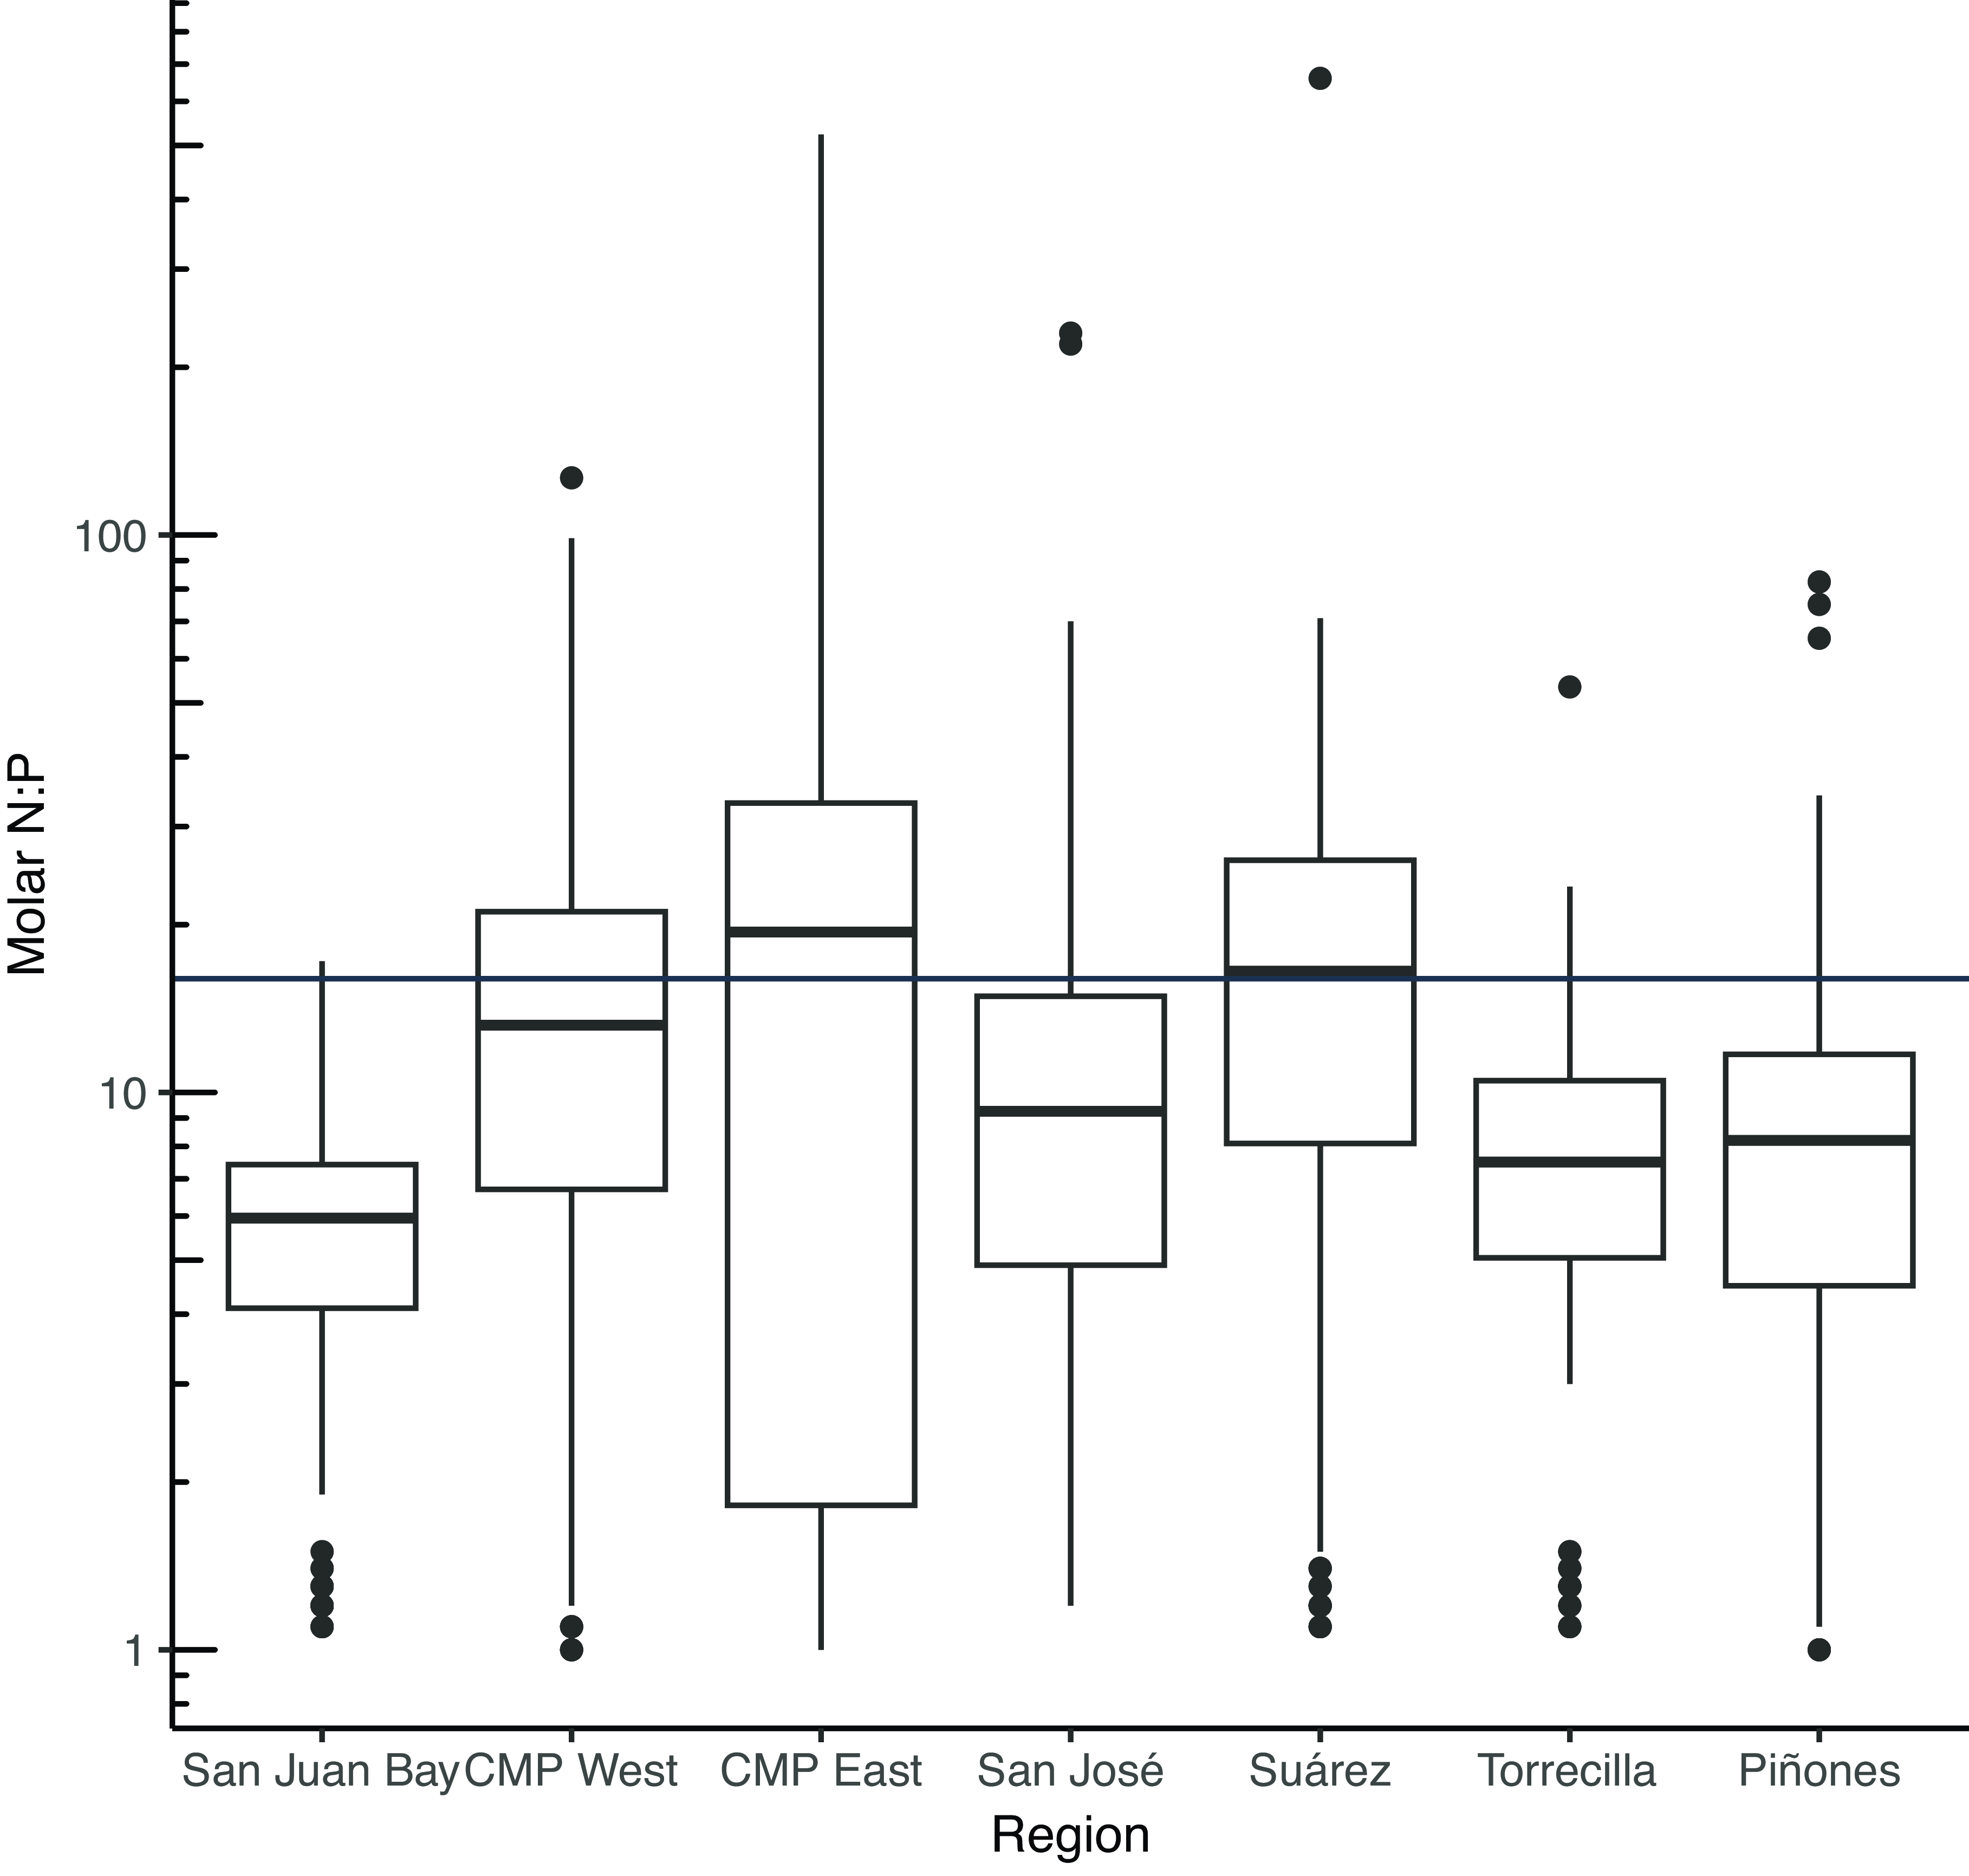
The DIN pool was primarily ammonium, with nitrate generally less than 20% of DIN. DIN concentrations were greatest in the CMP West and CMP East, which were where the highest overall concentrations were also measured (Fig. S2; Table 1). Similarly, CMP West and CMP East had the highest phosphate concentrations. When comparing the molar ratios of dissolved bioavailable nitrogen to phosphorus (N:P), the canals (CMP and Suárez) were more P-limited than the lagoonal sites and the San Juan Bay, which has a wide, open connection to the sea (Fig. 3).
Boxplots of the dissolved inorganic nitrogen to dissolved inorganic phosphorus (e.g., phosphate) ratios for the seven sub-regions of the San Juan Bay Estuary. A line at 16:1 indicates the Redfield Ratio, below which a waterbody is considered to be nitrogen limited and above which a system is thought to be phosphorus limited.

The CMP regions almost always exceeded the 35 MPN 100 mL-1 acceptable limits for enterococci concentrations (Fig. 4, DRNA 2022). While all regions of the SJBE had discrete samples >35 MPN 100 mL-1 during the sampling period, the exceedance was rare to infrequent in the San Juan Bay, Torrecilla, and Piñones regions.
Timeseries of measured Enterococci concentrations in the regions of the San Juan Bay Estuary. A reference line at 35 MPN per 100 mL is included as it is the acceptable concentration limit defined by the Puerto Rico Department of Natural and Environmental Resources, San Juan, Puerto Rico (DRNA 2022).

The results of the generalised linear mixing model indicated that there were no significant differences in δ15N and δ13C values among stations in the sub-regions of the SJBE where there were >1 sampling station. The δ15N values in the suspended particulate matter were not significantly different from one another in San Juan Bay, Torrecilla Lagoon, Suárez Canal, and the San José Lagoon and generally had values of about 4-5‰. The CMP West, CMP East, and Piñones regions generally had lower δ15N values than the rest of the system, where most of the values were 2‰ or less (Figs. 5, S3). The regions with lowest δ15N values (CMP West, CMP East) also had the highest DIN concentrations and, even in other regions of the SJBE, like in Canal Suárez, San José, and Piñones, low δ15N values were associated with high DIN concentrations (Fig. 6). Overall, there was a strong negative correlation between δ15N values and DIN concentrations throughout the SJBE (F(1, 823) = 553.4, p < 0.0001) and there was no difference between rainy (May through November) and dry (December through April) seasons for either parameter (Fig. 7). Carbon isotopes in San Juan Bay ranged from −21.6 to −16.9‰ and had the highest mean values in the SJBE (Fig. 5). The δ13C values from Torrecilla suspended particulate matter were, on average, higher than those of other regions of the inner estuary, perhaps reflecting a mix of offshore, estuarine, and terrestrial sources of particulate matter.
Graphical results of a generalised linear mixing model that was used to look for differences in stable isotope values among regions of the San Juan Bay Estuary. The δ15N results are presented in panel A, and the δ13C results are presented in panel B.

Nitrogen stable isotope values (δ15N) of suspended particulate matter plotted over time. The size of the circles reflects the dissolved inorganic nitrogen (DIN) concentration (μM) of the surface water at the time of collection. The horizontal indicator line of 2‰ is given for each region.

The concurrently collected δ15N particulate data are plotted against surface water DIN concentrations for the entire San Juan Bay Estuary. The linear regression model, shown as a straight line, with its 95% confidence interval shown as grey shading, illustrates the negative relationship between δ15N and DIN.

The regional patterns of particulate δ15N in the water column were similar to those measured in surface sediments as part of an earlier study (Oczkowski et al. Reference Oczkowski, Santos, Martin, Gray, Hanson, Watson, Huertas and Wigand2020a). To compare more directly, we plotted the mean surface sediment δ15N value, collected in June 2015, from each region with the overall mean water column δ15N value presented in this study. There was a clear linear pattern, with both CMP regions having the lowest δ15N for both sediment and water, and San José Lagoon having the highest δ15N values (Fig. 5, Fig. 8).
The overall mean δ15N values of water column particulate matter, for each region of the San Juan Bay Estuary, averaged over the entire timeseries (26 April 2021 through 3 April 2024) from this study, are plotted against the average δ15N values of surface sediment grab samples collected in June 2015 and published in Oczkowski et al. (Reference Oczkowski, Santos, Martin, Gray, Hanson, Watson, Huertas and Wigand2020a). The error bars associated with each region represent the standard deviation around the means. The 1:1 line is also given.

Discussion
Inferring flushing from salinity and carbon isotopes
The hydrology of the urban SJBE, with its lagoons and canals, is complex and changing. Recently, the greatest hydrologic changes were driven by the infilling of the CMP, which occurred rapidly from about the 1950s to the early 2000s (Oczkowski et al. Reference Oczkowski, Santos, Gray, Miller, Huertas, Hanson, Martin, Watson and Wigand2020b), after which it remained ponded in stretches and episodically flushed during storms. Both salinity and the δ13C of the suspended particulate matter reflect the flushing patterns of the SJBE, where salinity values in both the most well-flushed and poorly flushed parts of the estuary were the least variable and δ13C values were typical of marine phytoplankton in the regions with open exchange with the ocean (∼−22‰, Fry Reference Fry2006). The San Juan Bay, which is open to the Atlantic Ocean, is marine with salinity values generally ranging from 33 to 38 (Table 1). Similarly, Torrecilla, which has an inlet to the ocean, is often fully marine, but also has variable freshwater inputs that cause salinity to range from 9 to 37 (median was 32) (Pérez Villalona Reference Pérez-Villalona2014), and the δ13C values also reflected this intermediary status, where median δ13C values were −23.7‰. Overall, CMP West salinities were the most variable in the SJBE, ranging widely from nearly fresh (4) to fully marine (36) and reflecting the influence of both freshwater inputs and San Juan Bay water. Similarly, δ13C values were wide ranging from −28.9 to −13.4‰. The most positive of these values may indicate periods of high productivity (e.g. Oczkowski et al. Reference Oczkowski, Taplin, Pruell, Pimenta, Johnson and Grear2018) or different sources of organic matter, while the lowest values could reflect terrestrial organic matter and mangrove inputs. While C3 plants, including mangroves, typically have δ13C values of around −28‰ (Bouillon et al. Reference Bouillon, Connolly and Lee2008; Fry Reference Fry2006), seagrasses have δ13C values around −11.5‰ and microphytobenthos is about −14‰ (Abrantes et al. Reference Abrantes, Johnston, Connolly and Sheaves2014; Bouillon et al. Reference Bouillon, Connolly and Lee2008). In Ecostat mesocosm experiments conducted using temperate estuarine water, nutrient additions removed N and P limitation and enhanced primary production (as chlorophyll) and δ13C from typical marine values (∼−22‰) to values akin to what was observed here (∼−15‰) (Oczkowski et al. Reference Oczkowski, Taplin, Pruell, Pimenta, Johnson and Grear2018). Cotovicz et al. (Reference Cotovicz, Knoppers, Deirmendjian and Abril2019) also observed a clear positive relationship between plankton blooms and δ13C values in dissolved inorganic carbon (DIC) in the tropical urban Guanabara Bay in Brazil, but a negative relationship between δ13C-DIC and direct sewage discharges. It is unclear how much, or the source, of the δ13C-DIC that is incorporated into the particulate matter that we measured. While we hesitate to assign specific carbon source contributions to the δ13C values of the particulate matter samples, taken together, spatial differences in salinity and δ13C values reflect regional connections to the sea, terrestrial and mangrove contributions, and possibly in situ production.
Possible nitrogen sources to a nitrogen-rich estuary
Despite abundant bioavailable DIN, the δ15N values of the suspended particulate matter were consistent with N2 fixation in some of the most poorly flushed regions. While the dissolved nutrients from some SJBE regions had N:P ratios that indicated N-limitation, there was enough bioavailable nitrogen (e.g., DIN) throughout that N was not limiting growth. The CMP West and CMP East sites and Piñones Lagoon had particulate δ15N values ≤2‰, which were much lower than the rest of the SJBE. Prior studies of δ15N in surface sediments and sediment cores have indicated that these low values likely indicate that benthic N2 fixation supplies a great deal of bioavailable N to the estuary (e.g., Oczkowski et al. Reference Oczkowski, Santos, Martin, Gray, Hanson, Watson, Huertas and Wigand2020a, Reference Oczkowski, Santos, Gray, Miller, Huertas, Hanson, Martin, Watson and Wigandb). Overall, across the entire SJBE, lower δ15N values in the suspended particulate matter are associated with higher DIN concentrations (Figs 6, 7). While sewage and urban runoff typically have higher δ15N values in both surface water and groundwater seepage (>5‰), the two known sources of low (≤2‰) δ15N to aquatic systems are synthetic fertiliser, which derives from synthetically fixed dinitrogen gas, and biologically mediated N2 fixation (Fry Reference Fry2006; Kroeger and Charette Reference Kroeger and Charette2008). The CMP East and CMP West receive an unquantified, but substantial, amount of sewage-contaminated urban runoff from point and nonpoint sources, including possibly from submarine groundwater discharges, which can be a source of ammonium (e.g., Murgulet et al. Reference Murgulet, Douglas, Tick and Spalt2024). Water samples collected in both regions rarely had Enterococci concentrations, an indicator of faecal contamination, below the accepted limit of 35 MPN 100 ml-1 (Fig. 4; DRNA 2022). The δ15N values were low in the water column particulates and surface sediments (e.g., Oczkowski et al. Reference Oczkowski, Santos, Martin, Gray, Hanson, Watson, Huertas and Wigand2020a) despite high faecal contamination and DIN concentrations.
Although we did not directly measure N2 fixation and denitrification in this study, the suite of parameters we did analyse makes a compelling case for direct measurements in the future. Pérez-Villalona (Reference Pérez-Villalona2014) measured fluxes of nitrogen gas (N2), oxygen, and nutrient concentrations in sediments from San José Lagoon in 2010–2011 (Pérez Villalona et al. Reference Pérez-Villalona, Cornwell, Ortiz-Zayas and Cuevas2015). They observed high fluxes of oxygen and DIN, mostly into the sediment. This is consistent with our δ15N measurements, where San José Lagoon had the highest δ15N values in the SJBE. DIN fluxes into the sediment, as well as N2 fluxes out of the sediment, indicate net denitrification (conversion of bioavailable N to inert N2 gas), and denitrification leaves the remaining δ15N values enriched (Montoya Reference Montoya, Michener and Lajtha2007). However, in their study, performed using sediment cores, Pérez Villalona et al. (Reference Pérez-Villalona, Cornwell, Ortiz-Zayas and Cuevas2015) also observed that 17% of the N2 gas flux measurements in San José Lagoon were into the sediment, indicating net fixation. These measurements were made in cores that were associated with observations of benthic algal mats and mussel beds, highlighting the heterogeneity of N cycling within a region, including patches of fixation (Pérez Villalona et al. Reference Pérez-Villalona, Cornwell, Ortiz-Zayas and Cuevas2015).
While denitrification drives the δ15N of the residual bioavailable N higher, an abundance of water column N can lead to preferential uptake of the light isotope (14N) by in situ primary producers, on the order of 5‰ (Pruell et al. Reference Pruell, Taplin, Oczkowski, Grear, Mendoza, Pimenta, Hanson and Miller2020). If preferential uptake were primarily responsible for the low δ15N values, we would expect to see a negative relationship between δ15N and δ13C as periods of high productivity would increase δ13C values and preferentially select for the 14N, driving δ15N values down (e.g., Oczkowski et al. Reference Oczkowski, Taplin, Pruell, Pimenta, Johnson and Grear2018; Pruell et al. Reference Pruell, Taplin, Oczkowski, Grear, Mendoza, Pimenta, Hanson and Miller2020). We do not observe a clear relationship between δ15N and δ13C in the SJBE. We do, however, observe a positive trend between DO and δ15N. High DO concentrations are associated with high in situ production. If preferential uptake were a dominant process, we would expect to observe δ15N decrease when in situ production (and DO) is high, and nitrogen is abundant, as there would be a greater amount of biomass reflecting the preferentially lower δ15N values. But, in the SJBE, the opposite is true, where increasing δ15N values are positively associated with increasing DO values.
The balance between N2 fixation and denitrification in tropical estuaries is still uncertain, but we do know that mangrove forests can fix well over half of their bioavailable nitrogen (60%–70%; Lønborg et al. Reference Lønborg, Müller, Butler, Jiang, Ooi, Trinh, Wong, Ali, Cui, Siong and Yando2021 and references therein; Zuberer and Silver Reference Zuberer and Silver1978) and that fixation and denitrification rates vary across the landscape and are highly influenced by factors such as moisture content, turbidity, and labile carbon supply (e.g., Holguin et al. Reference Holguin, Vázquez and Bashan2001; Lee and Joye Reference Lee and Joye2006; Shiau et al. Reference Shiau, Lin, Tan, Tian and Chiu2017). High fixation rates have been associated with the surfaces of litterfall, the bottoms of mangroves (roots, pneumatophores, bark), cyanobacterial mats, the peat itself, and even the microbial biofilm on the carapaces of fiddler crabs (France Reference France1998; Holguin et al. Reference Holguin, Vázquez and Bashan2001 and references therein; Zilius et al. Reference Zilius, Bonaglia, Broman, Chiozzini, Samuiloviene, Nascimento, Cardini and Bartoli2020). Higher rates of general production may also mean higher rates of fixation. This is likely also true for estuaries. For example, Woodland and Cook (Reference Woodland and Cook2014) found that fixed N accounted for up to 75% of the suspended particulate N during a diazotrophic cyanobacteria bloom in a southern Australian estuary. Low δ15N values have also been correlated with proportionally high counts of nitrogen-fixing cyanobacteria in tropical systems (e.g., Jennerjahn et al. Reference Jennerjahn, Ittekkot, Klöpper, Adi, Nugroho, Sudiana, Yusmal and Gaye-Haake2004). In mangrove substrates, N fixation is positively correlated with the availability of organic matter and carbon (Holguin et al. Reference Holguin, Vázquez and Bashan2001; Romero et al. Reference Romero, Jacobson-Meyers, Fuhrman and Capone2015; Shiau et al. Reference Shiau, Lin, Tan, Tian and Chiu2017). This is also true in tropical subtidal sediments and further verified in an experimental study where ammonium additions did not inhibit N fixation rates while glucose additions, used as a labile carbon source, enhanced the fixation rates (O’Neil & Capone Reference O’Neil and Capone1989). Mudflats also appear to be regions of high fixation, with rates similarly driven by carbon availability. Both benthic microbial production and N2 fixation rates can be twice as high in mudflats when compared to adjacent mangrove forests (Kristensen et al. Reference Kristensen, Holmer, Banta, Jensen and Hansen1995). In a study of Darwin Harbour, in Northern Australia, the only portion of the estuary that had net fixation was the mudflats (Fortune et al. Reference Fortune, Kaestli, Butler and Gibb2022). Much of our understanding of tropical water column fixation comes largely from studies from monsoonal estuaries, where turbidity affects N-fixing Trichodesmium blooms and N2 fixation in the water column may also be a significant source of ‘new’ N (see Lønborg et al. Reference Lønborg, Müller, Butler, Jiang, Ooi, Trinh, Wong, Ali, Cui, Siong and Yando2021 for review). As an example, Yousuf et al. (Reference Yousuf, Thajudeen, Vipindas, Varghese and AA2020) measured surface water N2 fixation rates about four times higher than what was measured in the sediments of an estuary in India that is subject to monsoons. The flushing of the system (movement of the water) may also play a role in N fixation. In this study, the regions with the lowest tidal ranges, on the order of a few centimetres, also had the lowest δ15N values, while the well-flushed regions had the highest δ15N values. Not all tropical estuaries are hotspots of N2 fixation (e.g., Fortune et al. Reference Fortune, Kaestli, Butler and Gibb2022), and while we do not know the causes and drivers of fixation, flushing could play a role.
In our study, we measured the stable isotope values of suspended particulate matter over about three years, but we do not know how much of that particulate matter was plankton, bacteria, resuspended sediment, or plant materials, all of which may be contributing different δ15N values to the pool of particulates. The water column δ15N data from this study look similar to the values measured in surface sediments collected throughout the SJBE, over the course of a few days, in 2015 (Oczkowski et al. Reference Oczkowski, Santos, Martin, Gray, Hanson, Watson, Huertas and Wigand2020a). There is a clear linear relationship between the mean δ15N of the 2015 surface sediments (Oczkowski et al. Reference Oczkowski, Santos, Martin, Gray, Hanson, Watson, Huertas and Wigand2020a) and the mean water column data collected between April 2021 and April 2024 (this study) (Fig. 8). The robustness of this pattern defies seasonality and spatial, temporal, and ecological variability. While the specific processes driving these spatial patterns among the regions of the SJBE are still unknown, they dominate both the benthic and pelagic systems in this estuary and strongly reflect regional differences.
The research community’s appreciation of the role that N2 fixation plays in coastal N cycling and, even more broadly, in its contributions to global N budgets, is changing. A recent meta-analysis of global aquatic N2 fixation has underscored two main points associated with this work: first, N2 fixation is a much more significant biogeochemical process than was previously appreciated, and, second, fixation measurements from low latitudes and the southern hemisphere are extremely scarce (Fulweiler et al. Reference Fulweiler, Rinehart, Taylor, Kelly, Berberich, Ray, Oczkowski, Balint, Benavides, Church, Loeks, Newell, Olofsson, Oppong, Roley, Vizza, Wilson, Chowdhury, Groffman, Scott and Marcarelli2025). There was an earlier paradigm that, because N2 fixation is such an energetically intensive process, it is inhibited when bioavailable nitrogen is abundant. While the former point is certainly true, not all N fixation is influenced by N availability. There are an increasing number of studies illustrating this, including evidence from tropical systems, including from tropical forests and coastal mangroves (e.g. O’Neil & Capone Reference O’Neil and Capone1989; Mukherjee et al. Reference Mukherjee, Kumar and Muduli2019; Reis et al. Reference Reis, Reed, Oliveira and Nardoto2019). But the balance between nitrogen additions and removal in urban estuaries is unclear, and we cannot do more than speculate about the role that urban runoff and hydrodynamic alterations have on the estuary in general and in biogeochemical cycling, more specifically.
How will a restored CMP function?
As a direct result of advocacy and collective community action, the SJBE is undergoing a major ecological experiment, where the CMP East is in the process of being excavated (see https://martinpena.org/). The purpose of this project is to reduce flooding to adjacent communities and to restore flow between the San Juan Bay and San José Lagoon. While this restoration project is expected to take a decade to complete, preliminary dredging of the channel began in one region in June 2021, and a concerted effort to remove debris from the entire stretch was undertaken in January 2023. While mangrove-dominated lagoonal and canal-type estuaries may naturally be turbid systems with low DO (Webber et al. Reference Webber, Webber and Ford2018), the infilling and urbanisation of the CMP region of the SJBE reduced flushing that drove reduced conditions to the point that H2S was degassing off the canal at high enough concentrations to affect the health of the nearby residents (US ACE 2016). As we continue to track ecosystem response to the dredging and restoration project, we hypothesise that restoring the flushing in the CMP East will reduce urban flooding and soil saturation, which could, in turn, reduce overall N fixation (loosely following the findings of Lee and Joye Reference Lee and Joye2006, where desiccation and rehydration of microbial mats reduced fixation and enhanced denitrification). The reduced residence time associated with better flushing of both the CMP and San José Lagoon may alleviate some of the negative effects associated with ponded water in an organic-rich, highly reducing environment. However, as first pointed out by Webber et al. (Reference Webber, Webber and Ford2018), it is critical to recognise that the metrics of a ‘restored’ CMP will likely look very different from restoration examples from higher latitudes. The system may always be turbid, with abundant nutrients, low DO, and ample fixation. The results of this study offer the opportunity to establish baseline conditions from which to test this hypothesis in the SJBE.
Determining human effects on tropical estuaries
While tropical marine waters are generally oligotrophic, this characterisation doesn’t necessarily extend to estuarine water. Nutrient cycling and uptake in interior tidal creeks and lagoons may be inhibited by the natural turbidity of the system. Thus, traditional indicators of poor ecosystem health used in temperate regions, like high concentrations of dissolved nutrients, chlorophyll, turbidity, and even low DO, may not accurately reflect enhanced anthropogenic nutrient loads in tropical estuaries. Instead, direct measurements like faecal indicator bacteria, human-generated contaminants like sucralose and caffeine, and microbial source tracking may be necessary tools to understand human influences. For example, in the CMP stretch of the SJBE, faecal indicator bacteria were thousands of times greater than acceptable limits. In the absence of this information, the very low δ15N values that we observed might have been interpreted as being indicative of a minimally impacted system, leading to a mischaracterisation of the health of this estuary. As described by Webber et al. (Reference Webber, Webber and Ford2018), Veillard et al. (Reference Vieillard, Newell and Thrush2020), and Oczkowski et al. (Reference Oczkowski, Santos, Martin, Gray, Hanson, Watson, Huertas and Wigand2020a, Reference Oczkowski, Santos, Gray, Miller, Huertas, Hanson, Martin, Watson and Wigandb), research biases towards temperate regions have left the characterisation of tropical coastal ecosystems at a disadvantage, and the need to fill these knowledge gaps is particularly critical in the face of restoration efforts and climate change effects.
Supplementary material
The supplementary material for this article can be found at https://doi.org/10.1017/S0266467425100394
Acknowledgements
Thank you to the San Juan Bay Estuary Partnership, the Corporación del Proyecto ENLACE del Caño Martín Peña, and the G-8 communities for their assistance and guidance. James Hagy developed the code and helped inform the statistical analyses. The manuscript was improved by feedback from Suzy Ayvazian, Nia Bartolucci, and Cathy Wigand as well as two anonymous reviewers. The views expressed in this article are those of the authors and do not necessarily represent the views or policies of the Environmental Protection Agency. This contribution is identified by the EPA Sub-Product ID SHC.412.2.1.7 of the Atlantic Coastal Environmental Sciences Division, Center for Environmental Measurement and Modeling, Office of Research and Development, Environmental Protection Agency. The EPA does not endorse any commercial products, services, or enterprises.
Competing interests
No funding was received for conducting this study. All authors certify that they have no affiliations with or involvement in any organisation or entity with any financial interest or non-financial interest in the subject matter or materials discussed in this manuscript. The authors declare that they have no competing interests. AO, AH, MM, ICC, DK, and EH designed the study. They, along with MS, NSN, and EV participated in the execution of the study. AO led the writing of the manuscript, but all authors contributed to the editing and provided feedback. The dataset generated and analysed during the current study is available at https://zenodo.org/records/15181650.