1 Introduction
It has been recently shown that turbulent wakes of three-dimensional bluff bodies in a uniform flow exhibit dominant stochastic long-time global dynamics due to the permanent presence of intense symmetry-breaking modes. They have first been evidenced for the flows over several complex geometries having a reflexional symmetry and a blunt base. These include bluff bodies with an axisymmetric base (Grandemange et al.
Reference Grandemange, Parezanović, Gohlke and Cadot2012b
) or with a rectangular base being either a special configuration of the Ahmed body (Grandemange, Gohlke & Cadot Reference Grandemange, Gohlke and Cadot2012a
, Reference Grandemange, Gohlke and Cadot2013a
,Reference Grandemange, Gohlke and Cadot
b
; Volpe, Devinant & Kourta Reference Volpe, Devinant and Kourta2015) or of the Windsor model (Perry, Pavia & Passmore Reference Perry, Pavia and Passmore2016). Both the Ahmed and the Windsor models are simplified academic models devoted to the study of ground vehicle aerodynamics. These bodies are tested in close proximity to a wall to simulate the ground effect present for ground vehicles. The symmetry-breaking modes are stabilized when the distance to the wall (ground clearance) is reduced, leading to a pitchfork bifurcation (Grandemange et al.
Reference Grandemange, Gohlke and Cadot2013a
). Cadot, Evrard & Pastur (Reference Cadot, Evrard and Pastur2015) measured the critical value of the ground clearance which varies from
 $10$
to
 $7\,\%$
of the base height when the Reynolds number is increased from
 $1.5\times 10^{4}$
to
 $1.5\times 10^{5}$
. The permanent symmetry-breaking modes have also been found later in the wake of even simpler geometries such as the sphere and the disk (Grandemange Reference Grandemange2013; Grandemange, Gohlke & Cadot Reference Grandemange, Gohlke and Cadot2014a
), bullet shape bodies (Rigas et al.
Reference Rigas, Oxlade, Morgans and Morrison2014, Reference Rigas, Morgans, Brackston and Morrison2015a
; Rigas, Morgans & Morrison Reference Rigas, Morgans and Morrison2015b
; Gentile et al.
Reference Gentile, Schrijer, Van Oudheusden and Scarano2016, Reference Gentile, Van Oudheusden, Schrijer and Scarano2017) and rectangular flat plates (Cadot Reference Cadot2016).
Whatever the geometries, these modes are assumed to be reminiscent of the first steady bifurcation leading to an asymmetric steady flow in the laminar regime as reported numerically and/or experimentally for axisymmetric bodies (Thompson, Leweke & Provansal Reference Thompson, Leweke and Provansal2001; Pier Reference Pier2008; Fabre, Auguste & Magnaudet Reference Fabre, Auguste and Magnaudet2008; Meliga, Chomaz & Sipp Reference Meliga, Chomaz and Sipp2009; Bohorquez et al. Reference Bohorquez, Sanmiguel-Rojas, Sevilla, Jiménez-González and Martínez-Bazán2011), the squareback Ahmed body (Grandemange et al. Reference Grandemange, Gohlke and Cadot2012a ; Evstafyeva, Morgans & Dalla Longa Reference Evstafyeva, Morgans and Dalla Longa2017) and rectangular flat plates (Marquet & Larsson Reference Marquet and Larsson2014).
Axisymmetric bluff bodies are probably the most generic and studied cases, among which is the sphere, for which the first symmetry breaking leads to a steady planar symmetry with a selection of a fixed azimuthal phase or wake orientation (Thompson et al.
Reference Thompson, Leweke and Provansal2001; Pier Reference Pier2008). Turbulent scales appear in the wake for
 $Re>800$
in addition to the periodic dynamics of vortex loops shedding. The wake gradually loses its preference toward the pre-selected azimuthal phase by the first steady bifurcation (Mittal, Wilson & Najjar Reference Mittal, Wilson and Najjar2002) and the axisymmetry of the flow is restored from
 $Re\simeq 10^{3}$
. However, the symmetry breaking introduced by the first bifurcation still remains in terms of fluid forces, since a non-null instantaneous side force persists permanently on the geometry (Mittal et al.
Reference Mittal, Wilson and Najjar2002; Yun, Kim & Choi Reference Yun, Kim and Choi2006). As proposed by Rigas et al. (Reference Rigas, Morgans, Brackston and Morrison2015a
), the large-scale dynamics of the wake relies mainly on the stochastic azimuthal phase dynamics of the asymmetric mode.
For non-axisymmetric bodies such as the Ahmed body or the rectangular plate, the first steady bifurcation leads to only a few possible wake orientations imposed by the symmetry properties of the bodies (Grandemange et al.
Reference Grandemange, Gohlke and Cadot2012a
; Marquet & Larsson Reference Marquet and Larsson2014). In the turbulent regime, these few wake orientations are explored during the dynamics, sometimes leading to multi-stable behaviours (Grandemange et al.
Reference Grandemange, Gohlke and Cadot2013a
) in cases of competitions between the most probable wake orientations which, from that study, are equivalent to either top/bottom (called the
 $z$
-instability), left/right (called the
 $y$
-instability) orientated wakes. The selection of orientations depends on the ground clearance and the base aspect ratio of the body. An important point of the parametric study of Grandemange et al. (Reference Grandemange, Gohlke and Cadot2013a
) is that only the left/right orientations correspond to a proper symmetry breaking of the forcing geometry since the ground and the body supports break the top/bottom reflectional symmetry of the main body.
Although these asymmetric modes are of major importance for the wake dynamics and the fluid force exerted on the body, they have not been extensively studied because of their fairly recent investigation. For instance, the few experimental characterizations of the turbulent asymmetric modes of a rectangular flat backed body (Grandemange et al. Reference Grandemange, Gohlke and Cadot2013b ; Volpe et al. Reference Volpe, Devinant and Kourta2015; Perry et al. Reference Perry, Pavia and Passmore2016) lead to some different speculative three-dimensional mean wake structure scenarios (Evrard et al. Reference Evrard, Cadot, Herbert, Ricot, Vigneron and Délery2016; Perry et al. Reference Perry, Pavia and Passmore2016) with possible connections between the toroidal motion inside the recirculating bubble and longitudinal vortices observed further downstream.
The passive flow control using a control cylinder (Grandemange, Gohlke & Cadot Reference Grandemange, Gohlke and Cadot2014b
), a base cavity (Evrard et al.
Reference Evrard, Cadot, Herbert, Ricot, Vigneron and Délery2016) or active flow control with flaps (Brackston et al.
Reference Brackston, Garci De La Cruz, Wynn, Rigas and Morrison2016), pulsed jets (Li et al.
Reference Li, Barros, Borée, Cadot, Noack and Cordier2016) are efficient strategies to suppress these modes resulting in a symmetrized wake and base drag reduction. The most remarkable technique is the passive base cavity that can achieve approximately
 $18\,\%$
base suction reduction (Evrard et al.
Reference Evrard, Cadot, Herbert, Ricot, Vigneron and Délery2016). However, whatever the technique, the physical mechanism producing the symmetrization and the drag reduction are not yet well understood.
To our knowledge, there are even less numerical simulations in the literature investigating the asymmetric modes of the Ahmed body strictly speaking. With the exception of the recent simulation of Evstafyeva et al. (Reference Evstafyeva, Morgans and Dalla Longa2017) confirming the bifurcation scenario of the laminar regime evidenced by Grandemange et al. (Reference Grandemange, Gohlke and Cadot2012a
), we are only aware of the computation of Pasquetti & Peres (Reference Pasquetti and Peres2015) who obtained the asymmetric mode in the turbulent regime, and the work of Wassen, Eichinger & Thiele (Reference Wassen, Eichinger and Thiele2010) who incidentally triggered the asymmetric modes using symmetric steady blowing. One may wonder why other previous numerical simulations (Bayraktar, Landman & Baysal Reference Bayraktar, Landman and Baysal2001; Krajnović & Davidson Reference Krajnović and Davidson2003; Rouméas, Gilliéron & Kourta Reference Rouméas, Gilliéron and Kourta2009; Östh et al.
Reference Östh, Noack, Krajnović, Barros and Borée2014) or experimental works (Duell & George Reference Duell and George1999; Barros et al.
Reference Barros, Ruiz, Borée and Noack2014) with similar flat backed geometries never reported the presence of asymmetric modes. A possible explanation given by Li et al. (Reference Li, Barros, Borée, Cadot, Noack and Cordier2016) is that the primary steady instability can also select permanently either the top or bottom orientated wake (Grandemange et al.
Reference Grandemange, Gohlke and Cadot2013a
), without any apparent symmetry breaking because of the absence of a, strictly speaking, top to bottom reflectional symmetry due to the presence of a horizontal ground. The experiment of Li et al. (Reference Li, Barros, Borée, Cadot, Noack and Cordier2016) that reports the left–right bistability is exactly the same experiment as that of Barros et al. (Reference Barros, Ruiz, Borée and Noack2014) but with an additional small disturbance in the ground clearance that is necessary to trigger the left and right symmetry-breaking modes. The disturbance produces an effect that only rotates by an angle of
 $\pm \unicode[STIX]{x03C0}/2$
the permanently orientated top wake of the Barros et al. (Reference Barros, Ruiz, Borée and Noack2014) flow, thus leading to the bistable wake. Similarly the flow control computation by Wassen et al. (Reference Wassen, Eichinger and Thiele2010) also provides indications of the presence of a non-trivial static symmetry-breaking mode associated with either top or bottom wake orientation.
The purpose of the present numerical investigations is to obtain some information in the wake that is not obtainable experimentally, in order to characterize the asymmetric mode of a squareback Ahmed body as well as to better understand the mechanisms of symmetrization and drag reduction induced by a base cavity as recently reported by Evrard et al. (Reference Evrard, Cadot, Herbert, Ricot, Vigneron and Délery2016). This latter work associated the drag reduction with the wake symmetrization. Despite the lack of velocity data in the cavity, it speculates that less interaction between the body base and the recirculating flow may be a plausible explanation for the drag reduction.
The geometry we consider is inspired by the work of Evrard et al. (Reference Evrard, Cadot, Herbert, Ricot, Vigneron and Délery2016). The questions we address are firstly, can our turbulence model capture the asymmetric mode and the cavity effect? Secondly, from the fully accessible data resulting from the computation, can we elucidate the drag reduction mechanism using a base cavity?
The paper is organized as follows. Section 2 describes the numerical framework and set-up for the simulations. Results in § 3 are split into five parts. Section 3.1 is a brief presentation of the main characteristics of the reference flow with no cavity (the baseline). Fluid forces and mean flow topologies produced by the different cavity depths are exposed respectively in §§ 3.2 and 3.3. The mean pressure field in the recirculating flow is studied simultaneously with the mean velocity field in § 3.4, then the developments of the mixing layer bounding the recirculating flow are investigated in § 3.5. Results lead to four discussions, a first devoted to the comparison with the experiment of Evrard et al. (Reference Evrard, Cadot, Herbert, Ricot, Vigneron and Délery2016) in § 4.1, a second about the turbulent asymmetric global mode structure in § 4.2, a third about the drag reduction using a base cavity in § 4.3 and a fourth about the wake symmetrization in § 4.4. Section 5 concludes and offers perspective to the paper.
2 Numerical method and flow geometry
2.1 General framework of the lattice Boltzmann solver
The simulations presented in this paper have been performed using the lattice Boltzmann solver LaBS (2014). This solver has been developed within a consortium of industrial companies (Renault, Airbus, CS), academic laboratories (UPMC, ENS Lyon) and strong partnerships with others entities (Onera, Alstom, Paris Sud University, Gantha, Matelys). The lattice Boltzmann method (LBM) considers the advection and collision of fluid particles at the mesoscopic level. The method is briefly reviewed in the following.
In kinetic theory, the evolution of a monoatomic gas follows Boltzmann’s equation (Cercignani Reference Cercignani1988):
 $$\begin{eqnarray}\frac{\unicode[STIX]{x2202}f}{\unicode[STIX]{x2202}t}+c_{i}\frac{\unicode[STIX]{x2202}f}{\unicode[STIX]{x2202}x_{i}}+\frac{F_{i}}{m}\frac{\unicode[STIX]{x2202}f}{\unicode[STIX]{x2202}c_{i}}=\left(\frac{\unicode[STIX]{x2202}f}{\unicode[STIX]{x2202}t}\right)_{coll},\end{eqnarray}$$
where the distribution function
 $f(x,c,t)$
represents the number of fluid particles with position
 $x$
and velocity
 $c$
at time
 $t$
. The exterior forces are represented by
 $F$
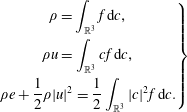
and are neglected in the remaining of this paper. Macroscopic quantities such as density
 $\unicode[STIX]{x1D70C}$
, velocity
 $u$
and energy
 $e$
can be recovered by calculating the moments of the distribution function over all possible velocities:
 $$\begin{eqnarray}\displaystyle \left.\begin{array}{@{}c@{}}\displaystyle \unicode[STIX]{x1D70C}=\int _{\mathbb{R}^{3}}f\,\text{d}c,\\ \displaystyle \unicode[STIX]{x1D70C}u=\int _{\mathbb{R}^{3}}cf\,\text{d}c,\\ \displaystyle \unicode[STIX]{x1D70C}e+\frac{1}{2}\unicode[STIX]{x1D70C}|u|^{2}=\frac{1}{2}\int _{\mathbb{R}^{3}}|c|^{2}f\,\text{d}c.\end{array}\right\} & & \displaystyle\end{eqnarray}$$
The right-hand operator in (2.1) describes the collisions between fluid particles. The so-called BGK operator (Bhatnagar, Gross & Krook Reference Bhatnagar, Gross and Krook1954) considers the effect of collisions as a relaxation towards an equilibrium distribution function
 $f^{eq}$
with a relaxation time
 $\unicode[STIX]{x1D70F}$
. Velocities can then be restricted to a discrete and finite set
 $c_{\unicode[STIX]{x1D6FC}}$
(He & Luo Reference He and Luo1997). LaBS uses the standard D3Q19 model with 19 discrete velocities. The discrete velocity Boltzmann equation coupled to the BGK operator thus reads:
 $$\begin{eqnarray}\frac{\unicode[STIX]{x2202}f_{\unicode[STIX]{x1D6FC}}(x,t)}{\unicode[STIX]{x2202}t}+c_{\unicode[STIX]{x1D6FC},i}\frac{\unicode[STIX]{x2202}f_{\unicode[STIX]{x1D6FC}}(x,t)}{\unicode[STIX]{x2202}x_{i}}=-\frac{1}{\unicode[STIX]{x1D70F}}(f_{\unicode[STIX]{x1D6FC}}(x,t)-f_{\unicode[STIX]{x1D6FC}}^{eq}(x,t)).\end{eqnarray}$$
The restricted set of velocities and the equilibrium distribution function are prescribed so as to recover the Navier–Stokes equations up to a given order. Through the Chapman–Enskog multi-scale expansion, with the Knudsen number as the expansion parameter (Chen & Doolen Reference Chen and Doolen1998), the nonlinear compressible Navier–Stokes equations can thus be recovered from (2.3) under the assumption that the Mach number remains small (
 $M<0.4$
). The fluid viscosity
 $\unicode[STIX]{x1D708}$
is related to the relaxation time
 $\unicode[STIX]{x1D70F}$
through the relation
 $\unicode[STIX]{x1D708}=c_{s}^{2}(\unicode[STIX]{x1D70F}-1/2)$
, where
 $c_{s}$
denotes the speed of sound. Finally, the macroscopic quantities can be recovered with finite sums over the discrete velocities. Equation (2.3) can be integrated along the characteristic
 $c_{\unicode[STIX]{x1D6FC}}$
for a time interval
 $\unicode[STIX]{x0394}t$
. The integral of the collision operator can be approximated using a trapezoidal rule with second-order accuracy:
 $$\begin{eqnarray}\displaystyle f_{\unicode[STIX]{x1D6FC}}(x+c_{\unicode[STIX]{x1D6FC}}\unicode[STIX]{x0394}t,t+\unicode[STIX]{x0394}t)-f_{\unicode[STIX]{x1D6FC}}(x,t) & = & \displaystyle -\frac{\unicode[STIX]{x0394}t}{2\unicode[STIX]{x1D70F}} (f_{\unicode[STIX]{x1D6FC}}(x+c_{\unicode[STIX]{x1D6FC}}\unicode[STIX]{x0394}t,t+\unicode[STIX]{x0394}t)-f_{\unicode[STIX]{x1D6FC}}^{eq}(x+c_{\unicode[STIX]{x1D6FC}}\unicode[STIX]{x0394}t,t+\unicode[STIX]{x0394}t)\nonumber\\ \displaystyle & & \displaystyle +\,f_{\unicode[STIX]{x1D6FC}}(x,t)-f_{\unicode[STIX]{x1D6FC}}^{eq}(x,t))+O(\unicode[STIX]{x0394}t^{3}).\end{eqnarray}$$
Introducing
 $g_{\unicode[STIX]{x1D6FC}}=f_{\unicode[STIX]{x1D6FC}}(x,t)+\unicode[STIX]{x0394}t/2\unicode[STIX]{x1D70F}(f_{\unicode[STIX]{x1D6FC}}(x,t)-f_{\unicode[STIX]{x1D6FC}}^{eq}(x,t))$
leads to the explicit relation:
 $$\begin{eqnarray}g_{\unicode[STIX]{x1D6FC}}(x+c_{\unicode[STIX]{x1D6FC}}\unicode[STIX]{x0394}t,t+\unicode[STIX]{x0394}t)=\left(1-\frac{\unicode[STIX]{x0394}t}{\unicode[STIX]{x1D70F}_{g}}\right)g_{\unicode[STIX]{x1D6FC}}(x,t)+\frac{\unicode[STIX]{x0394}t}{\unicode[STIX]{x1D70F}_{g}}g_{\unicode[STIX]{x1D6FC}}^{eq}(x,t),\end{eqnarray}$$
with
 $\unicode[STIX]{x1D70F}_{g}=\unicode[STIX]{x1D70F}+\unicode[STIX]{x0394}t/2$
and
 $g_{\unicode[STIX]{x1D6FC}}^{eq}=f_{\unicode[STIX]{x1D6FC}}^{eq}$
. The numerical scheme (2.5) is solved on the nodes of a grid of cubic elements of size
 $\unicode[STIX]{x0394}x=|c_{s}|\unicode[STIX]{x0394}t$
. It can be viewed as a two-step algorithm in which the fluid particles are first redistributed through the collision step and then transported to the neighbouring lattice nodes during the streaming step. The local computational nature of this explicit scheme allows for an efficient parallelization of the solver.
Complex geometries are handled in LaBS through the use of an immersed solid boundary method similar to the model described in Verschaeve & Müller (Reference Verschaeve and Müller2010). The mesh is generated by a parallel octree mesher, where the inside of meshed surfaces is excluded. A hierarchical grid-refinement method (Filippova & Hänel Reference Filippova and Hänel1998) allows for a finer mesh close to the surfaces and in regions of interest.
Turbulence modelling in LaBS is achieved using a large eddy simulation (LES) method. This is done either by adding dissipation through high-order selective spatial filtering, called the approximate deconvolution model (ADM) (Stolz, Adams & Kleiser Reference Stolz, Adams and Kleiser2001; Ricot et al. Reference Ricot, Marié, Sagaut and Bailly2009; Malaspinas & Sagaut Reference Malaspinas and Sagaut2011) or by using a dedicated subgrid-scale model, called the shear improved Smagorinsky model (SISM) (Lévêque et al. Reference Lévêque, Toschi, Shao and Bertoglio2007; Touil, Ricot & Lévêque Reference Touil, Ricot and Lévêque2014) as employed in this work. Both the ADM and the SISM approach can be coupled with a wall-law model to describe near-wall turbulence. LaBS uses a wall law accounting for adverse pressure gradient (Afzal Reference Afzal and Gersten1996), curvature and roughness effects (Patel & Sotiropoulos Reference Patel and Sotiropoulos1997).
2.2 Numerical set-up
The geometry and the Reynolds number are copied from the experiment of Evrard et al. (Reference Evrard, Cadot, Herbert, Ricot, Vigneron and Délery2016) that is relevant to Ahmed bodies in the unstable regime, i.e. with a ground clearance larger than the critical ground clearance (Grandemange et al.
Reference Grandemange, Gohlke and Cadot2013a
; Cadot et al.
Reference Cadot, Evrard and Pastur2015). The body dimensions are
 $W\times H\times L=350~\text{mm}\times 297~\text{mm}\times 1124~\text{mm}$
with a ground clearance of
 $C=30~\text{mm}$
. The original cylindrical supports are replaced by NACA
 $0025$
profiles with a chord of 80 mm. The extent of the computation domain is
 $44.8~\text{m}\times 13.6~\text{m}\times 7.15~\text{m}$
. The inlet velocity is set to
 $U_{0}=20~\text{m}~\text{s}^{-1}$
, leading to a Reynolds number
 $Re=U_{0}H/\unicode[STIX]{x1D708}\simeq 396\,000$
. The inflow is uniform without any turbulence injection. The outlet pressure condition is fixed to
 $p_{0}=101\,325~\text{Pa}$
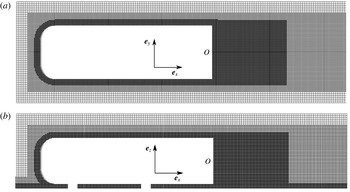
. Multi-resolution domains are employed to refine the mesh in the vicinity of the walls using boxes and geometry offsets, as can be seen in figure 1. The smallest mesh size employed is 1.5 mm, close to the Ahmed body model, which led to a time step
 $dt=6.9282\times 10^{-6}~\text{s}$
for the simulations. We mention that while the setting is fully symmetric with respect to the reflectional symmetry of the geometry, the generated mesh is not as can be seen in figure 1(a). To correctly reproduce the boundary layer that impacts the Ahmed body that was used in the experiments of Evrard et al. (Reference Evrard, Cadot, Herbert, Ricot, Vigneron and Délery2016), a no-slip condition is placed upstream of the model. The length of this section has been determined beforehand by computing the flow without the model. The boundary layer height is equal to 15 mm when the flow impacts the model. The mesh is refined up to 3 mm on the no-slip region of the floor and in the wake of the model. A total of
 $16$
million nodes was used in the mesh. A refined mesh was also considered, with a mesh size of 1 mm close to the body for a total of 40 million nodes. The resulting drag coefficient was found to vary by
 $2.8\,\%$
and the mesh was thus considered converged.
Mesh around the body, the no-slip floor and the wake. Cross-sectional views at half the body height (a) and width (b).

The coordinate system
 $Oxyz$
is defined in figure 1, its origin
 $O$
is taken at the centre of the body base. For the remainder of the paper,
 $a^{\ast }$
denotes the non-dimensional value of any quantity
 $a(x,y,z,t)$
made dimensionless by a combination of the height
 $H=0.297~\text{m}$
of the body and the inlet velocity
 $U_{0}=20~\text{m}~\text{s}^{-1}$
. Time in non-dimensional units is thus defined as
 $t^{\ast }=tU_{0}/H$
. The effect of a base cavity of dimensions (
 $W-24~\text{mm}$
)
 $\times$
(
 $H-24~\text{mm}$
) is studied in this paper. Two cavity depths
 $d^{\ast }=0.047$
and
 $d^{\ast }=0.337$
are investigated that correspond to
 $4.7\,\%$
and
 $33.7\,\%$
of the body height
 $H$
respectively.
Computations are performed over a total time
 $T^{\ast }=98$
for the configurations with a cavity and up to
 $T^{\ast }=793$
for the longest run of the reference case. Integrated efforts over the whole geometry are recorded over time and used to monitor the convergence of the simulations. The flow is averaged from iteration
 $100\,000$
to allow for convergence. Simulations were carried out on a cluster of Intel(R) Xeon(R) E5-2680 v2 cores, with 3.2 Gb of RAM per core. The average computational time needed on
 $200$
cores was 9 h for the simulations over
 $T^{\ast }=98$
, and up to 61 h for the long run over
 $T^{\ast }=793$
.
In the following, the base pressure effect on the drag is quantified using the base suction coefficient defined as
 $C_{b}=-C_{p_{b}}$
, where the base pressure coefficient
 $C_{p_{b}}=\int ((p-p_{0})/(\unicode[STIX]{x1D70C}U_{0}^{2})/2)\,\text{d}S$
is the base pressure averaged over the surface
 $S=W\times H$
of the blunt base. The drag, side force and lift coefficients are denoted
 $C_{x}$
,
 $C_{y}$
and
 $C_{z}$
respectively and defined as:
 $$\begin{eqnarray}\displaystyle C_{i}=\frac{F_{i}}{\frac{1}{2}\unicode[STIX]{x1D70C}SU_{0}^{2}};\quad i=x,y,z, & & \displaystyle\end{eqnarray}$$
where
 $F_{i}$
is the corresponding force component exerted of the body.
3 Results
3.1 Baseline
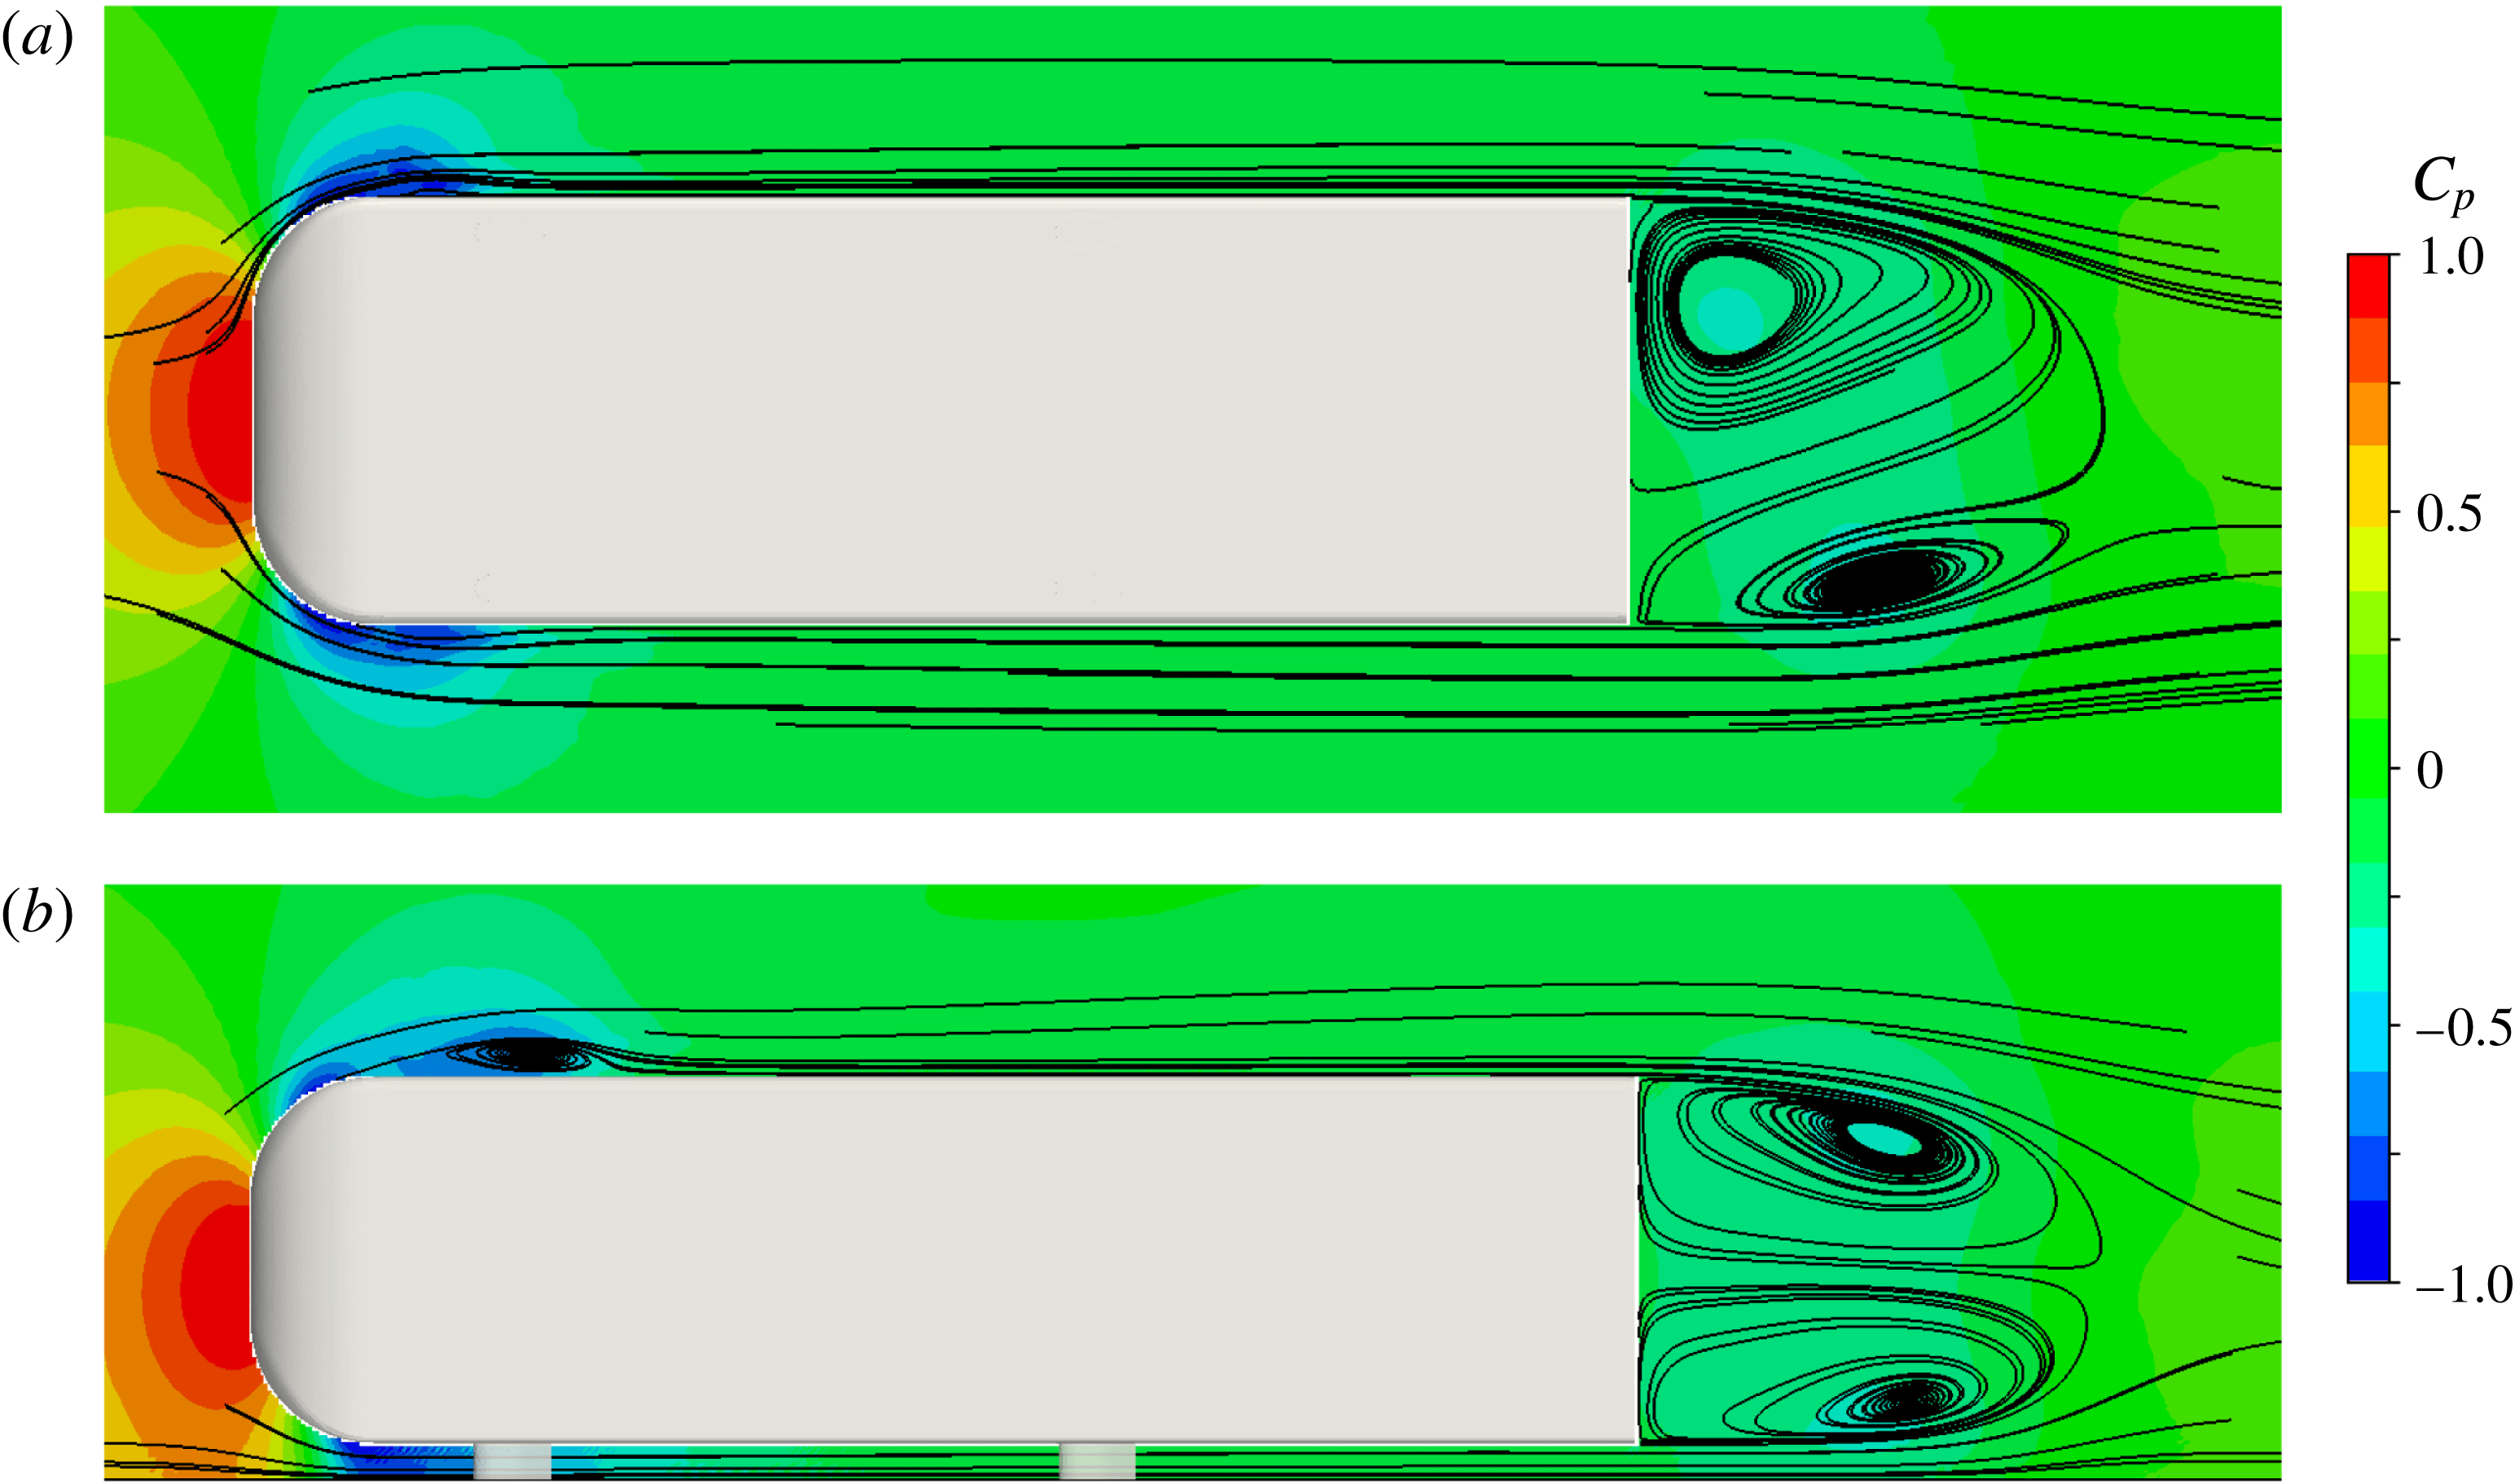
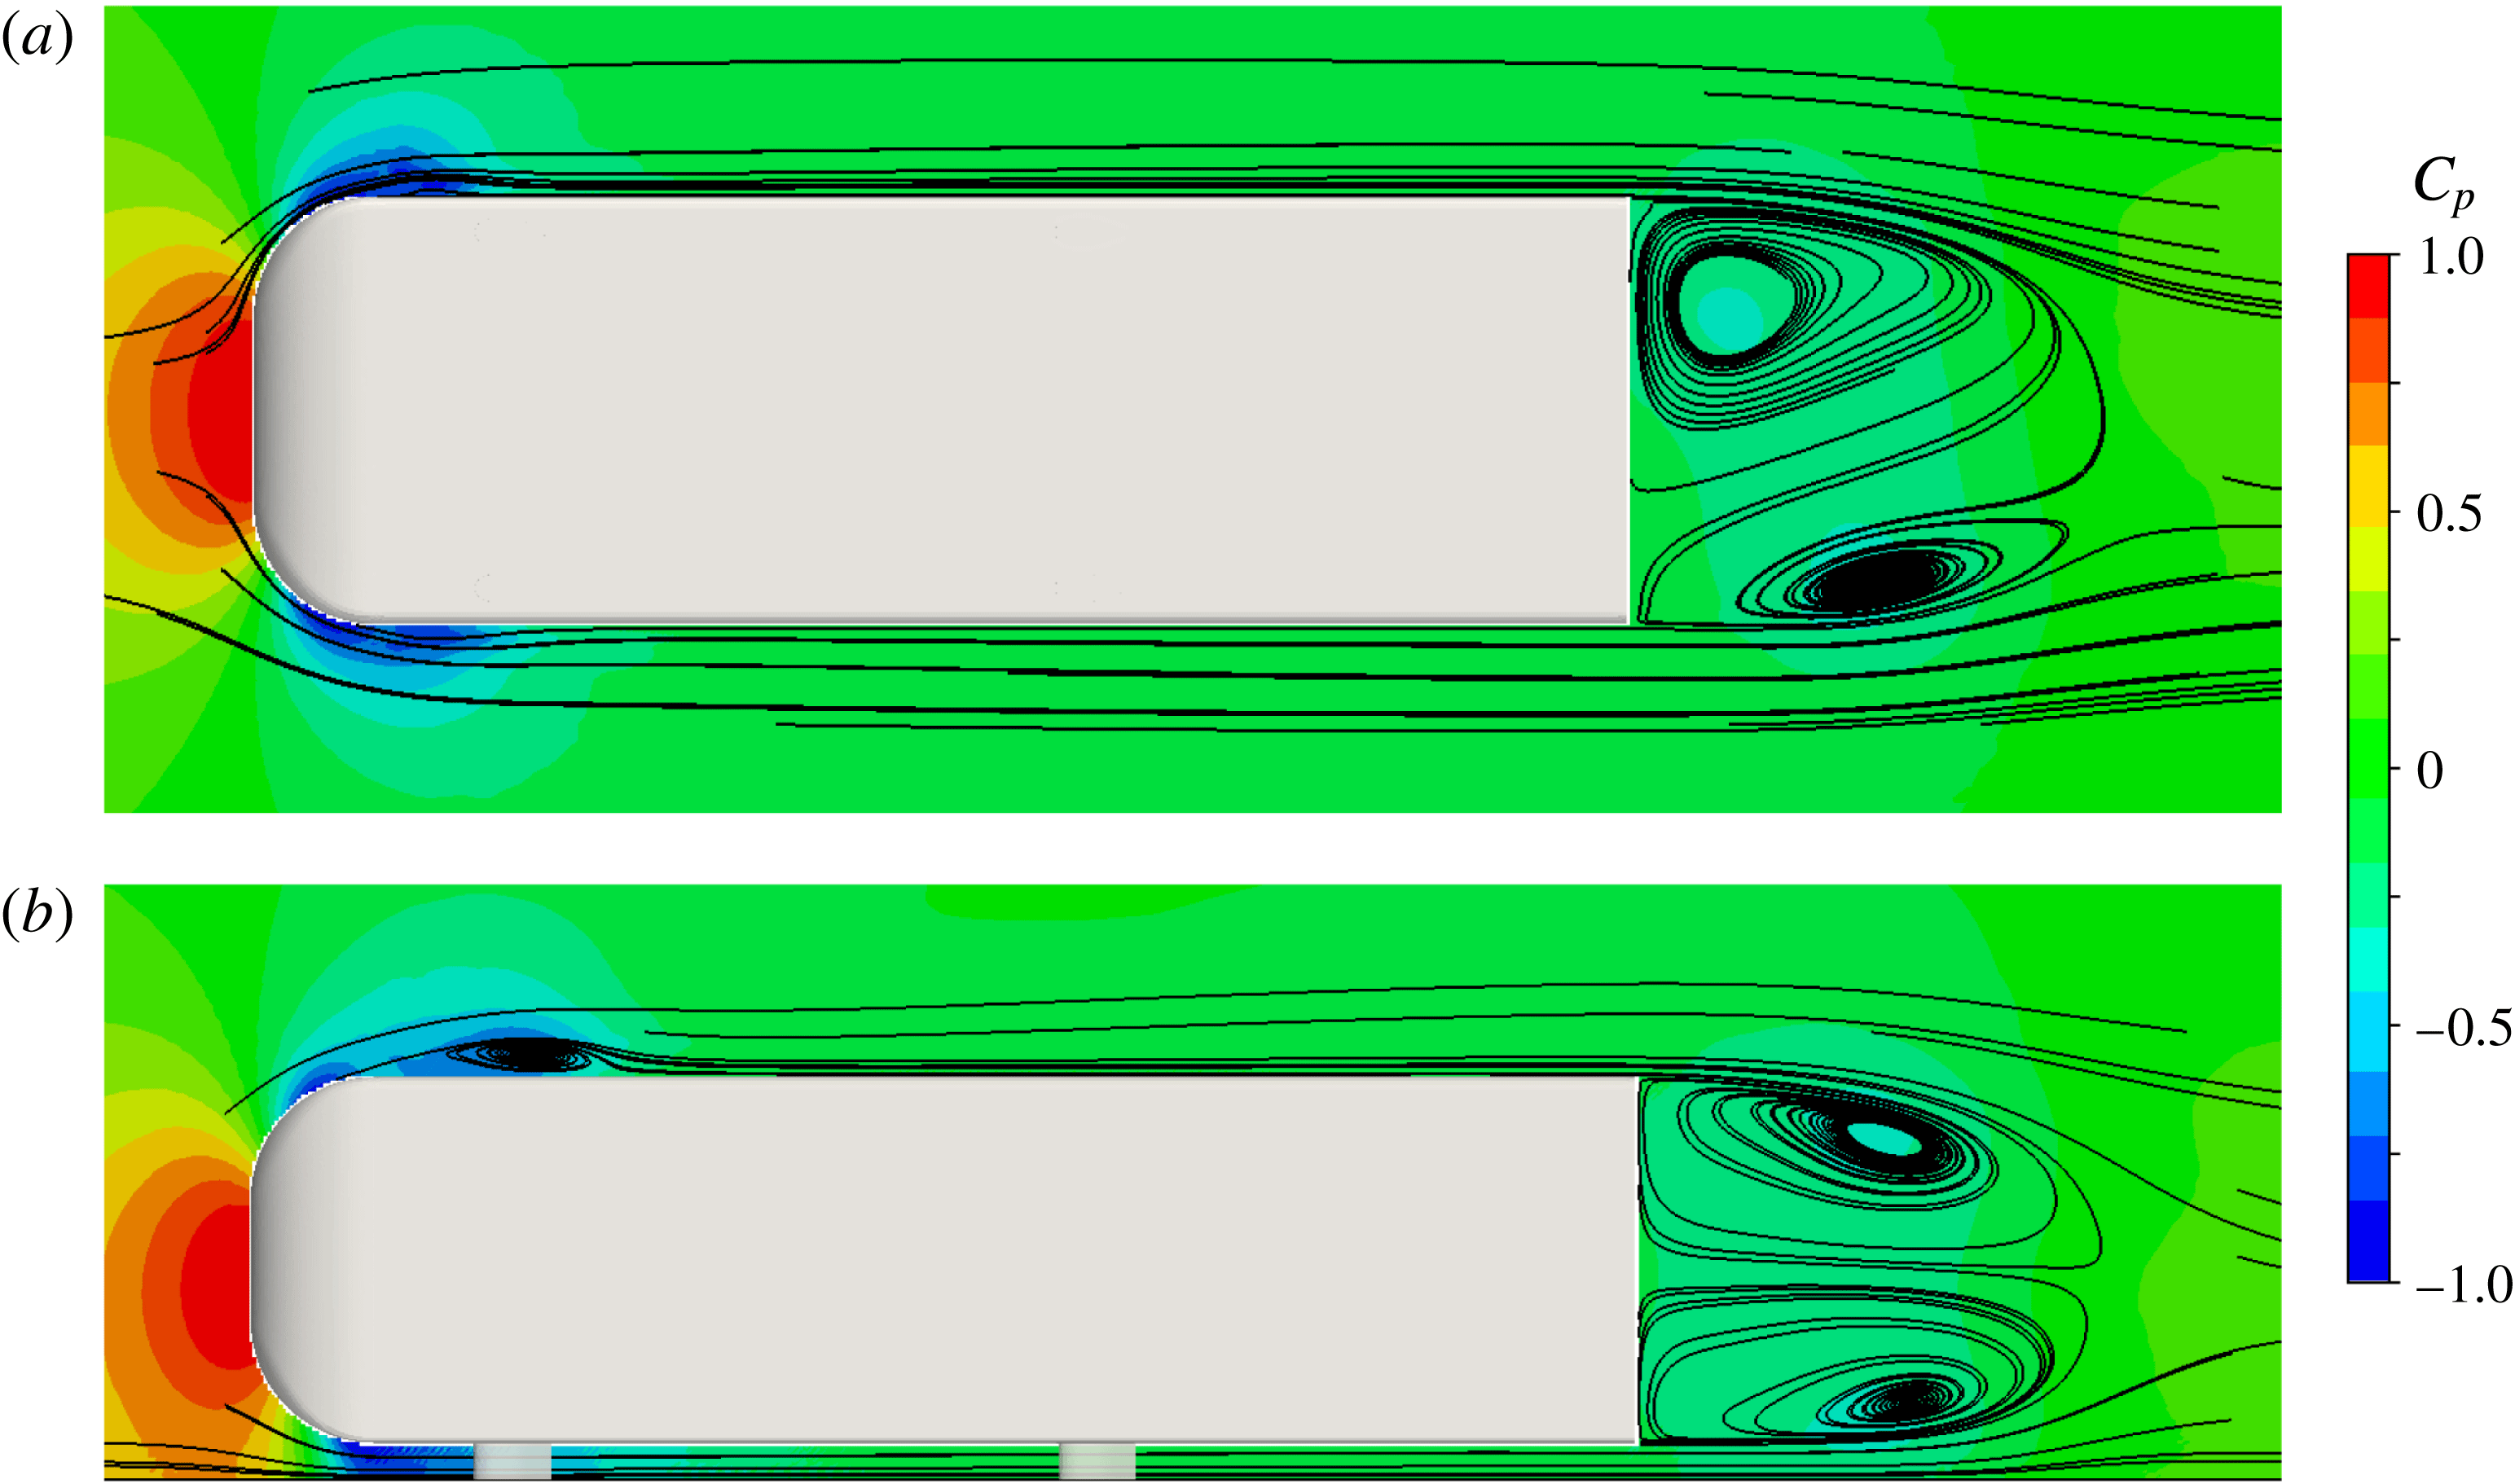
Global views of the flow around the Ahmed body are shown in figure 2 with no cavity. They are obtained by averaging the flow over the duration of the run after convergence. The colour represents the pressure coefficient on which streamlines are superimposed for the two basic planes,
 $z^{\ast }=0$
in figure 2(a) and
 $y^{\ast }=0$
in figure 2(b). These global views indicate boundary layer separations and reattachments around the fore body where the curvatures are large, producing recirculating bubbles symmetrically situated on both the lateral sides in figure 2(a), and on the top of the body in figure 2(b). The flow acceleration between the fore body and the ground that is associated with a favourable pressure gradient prevents the flow separating at the bottom. The fore body flow satisfactorily respects the reflectional symmetry of the geometry with respect to the plane
 $y^{\ast }=0$
while the wake clearly exhibits a breaking of this reflectional symmetry in figure 2(a). This is the symmetry-breaking mode evidenced by Grandemange et al. (Reference Grandemange, Gohlke and Cadot2013b
).
Mean pressure coefficient
 $C_{p}$
and streamlines around the Ahmed body; horizontal plane
 $z^{\ast }=0$
in (a), and vertical plane
 $y^{\ast }=0$
in (b).
3.2 Fluid force
The fluid force coefficients are displayed in table 1 for the three investigated cavity depths. The base suction coefficient and the drag coefficient are significantly larger than the values of
 $C_{b}=0.149$
and
 $C_{x}=0.288$
measured experimentally in Evrard et al. (Reference Evrard, Cadot, Herbert, Ricot, Vigneron and Délery2016) for a similar flow condition. Despite the discrepancy, the base suction to drag ratio is conserved, indicating that
 $52\,\%$
of the drag is ascribed to the base drag as commonly reported for this flow geometry. As for the experiment where
 $C_{z}=-0.117$
, a negative lift is computed but again with a larger magnitude. While the flow symmetry would suggest a zero mean side force coefficient, a significant positive value of
 $C_{y}=0.016$
is found. This apparent contradiction is due to the presence of a static symmetry-breaking mode evidenced in figure 2(a). The cavity has the effect to reduce the base drag, and hence the drag. The drag reductions of
 $2.97\,\%$
for the shallow cavity
 $d^{\ast }=0.047$
and
 $9.46\,\%$
for the deep cavity
 $d^{\ast }=0.337$
are in very good agreements with the experimental observations of Evrard et al. (Reference Evrard, Cadot, Herbert, Ricot, Vigneron and Délery2016). As for the experiment, the negative lift coefficient is not affected by the presence of the cavity, indicating that the lift is dominated by a global larger velocity along the bottom side than the top side of the body. The numerical simulation then recovers the main characteristic of the cavity effect, with similar magnitudes in relative comparison to the case with no cavity. However the experimental discrepancy deserves comments that are discussed in § 4.1. Next, we investigate the flow data for the three cases; no cavity, shallow and deep cavity to get a better insight into the flow modifications.
Global properties of the flow; base suction coefficient
 $C_{b}$
, force coefficients
 $C_{i}$
for
 $d^{\ast }=0$
(no cavity) and the two cavity depths
 $d^{\ast }=0.047$
and
 $d^{\ast }=0.337$
.

3.3 Mean flow topology
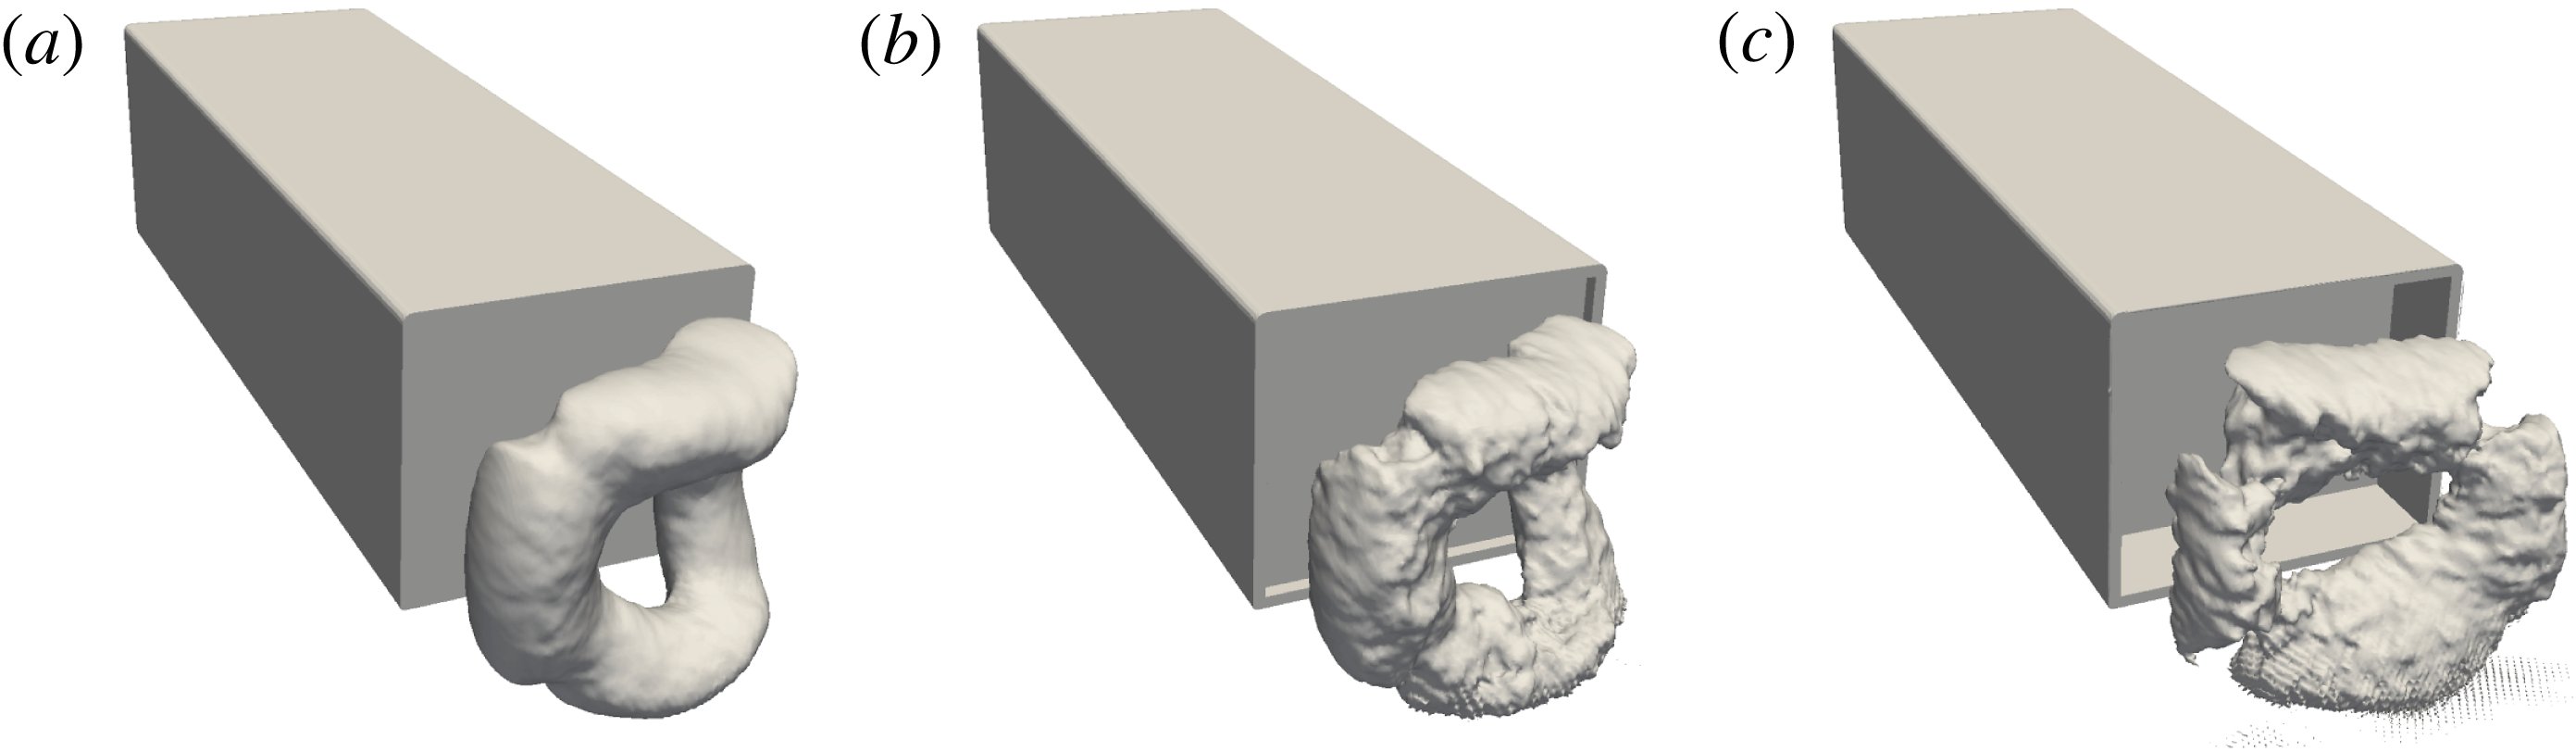
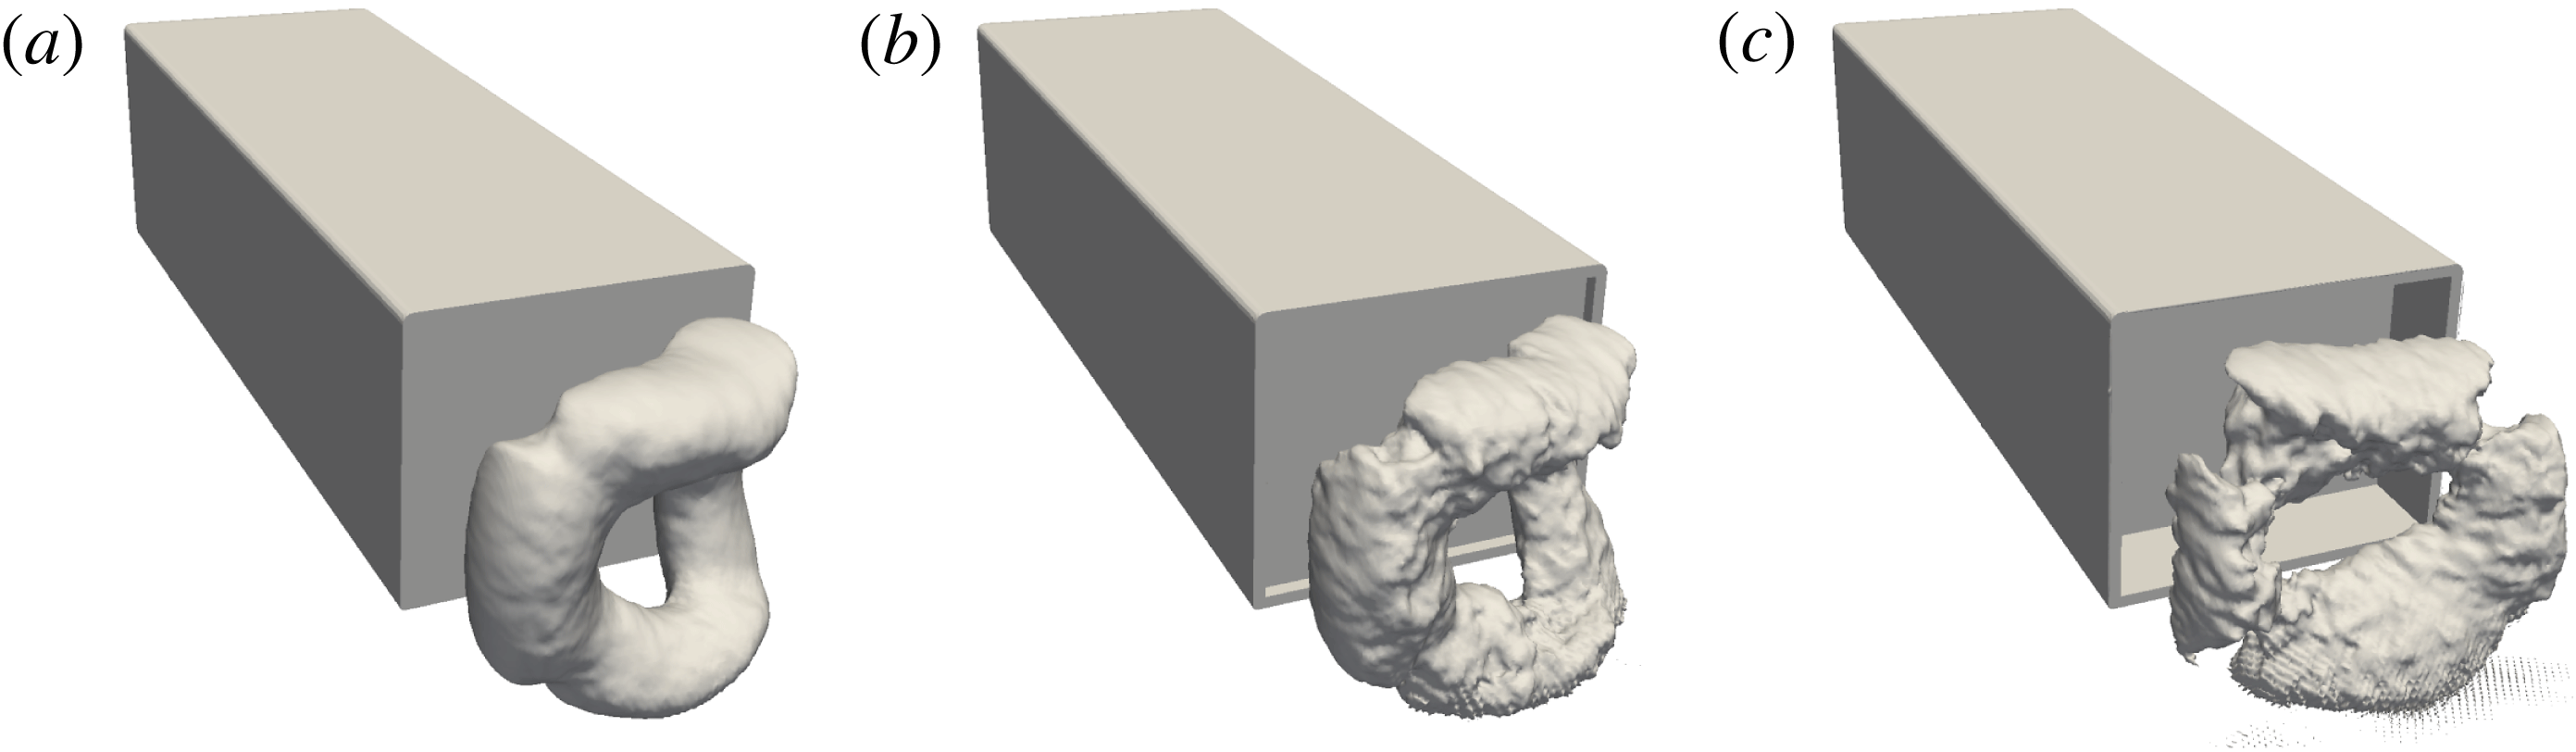
Figure 3 shows the iso-surface of the mean pressure coefficient at a value
 $C_{p}=-0.320$
for the baseline and the shallow cavity, and at a larger value of
 $C_{p}=-0.270$
for the deep cavity. This visualization allows to identify the mean low pressure structure which has been reported to have a torus shape in previous numerical simulations (Krajnović & Davidson Reference Krajnović and Davidson2003; Rouméas et al.
Reference Rouméas, Gilliéron and Kourta2009). In the present simulation, the torus is clearly observable but its shape does not respect the reflectional symmetry of the geometry for the baseline and the shallow cavity as shown in figure 3(a,b). For these two simulations the turbulent wake is permanently locked on a static symmetry-breaking mode, while in experiments that are not limited in the duration of observation, the dynamics explores the two static mirror modes (Grandemange et al.
Reference Grandemange, Gohlke and Cadot2013b
). Actually, the longer run (
 $d^{\ast }=0$
) with a total time duration of
 $T^{\ast }=793$
was not long enough to observe a switch which is not surprising due to the long-time dynamics associated with the random switches. For instance, in the experiment of Evrard et al. (Reference Evrard, Cadot, Herbert, Ricot, Vigneron and Délery2016), only 8 switches were observed during an observation of
 $T^{\ast }=4000$
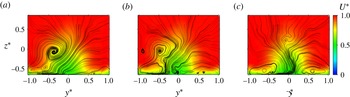
. When the deep cavity is present, the reflectional symmetry of the torus is restored exactly as found experimentally in Evrard et al. (Reference Evrard, Cadot, Herbert, Ricot, Vigneron and Délery2016). The symmetrization is also clearly observable in the far wake, at
 $x^{\ast }=4.5$
downstream of the body base as shown in figure 4. The clockwise motion observed in both figures 4(a) and 4(b) is the consequence of the symmetry breaking, associated with a large positive side force coefficient (see table 1) while a symmetric far wake is present in figure 4(c) for the deep cavity associated with a reduced side force coefficient.
Iso-surface of the mean pressure coefficient
 $C_{p}=-0.320$
for
 $d^{\ast }=0$
(a) and
 $d^{\ast }=0.047$
(b), and
 $C_{p}=-0.270$
for
 $d^{\ast }=0.337$
(c). Only the iso-surface in the near wake is shown.
Mean velocity field in the plane
 $x^{\ast }=4.5$
; for
 $d^{\ast }=0$
(a),
 $d^{\ast }=0.047$
(b) and
 $d^{\ast }=0.337$
(c). The colour represents the mean streamwise velocity
 $U$
, while the continuous lines are the streamlines computed from both the mean transversal components
 $V$
and
 $W$
.

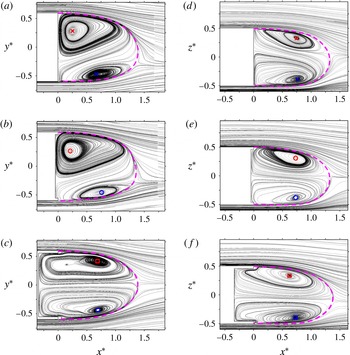
The mean recirculating bubble topology is better quantified in figure 5 by looking at the streamlines in the two planes
 $y^{\ast }=0$
and
 $z^{\ast }=0$
, corresponding to two perpendicular cuts of the low pressure torus evidenced previously in figure 3. The low pressure torus is evidently induced by a toroidal recirculating motion. Observations are very similar in the plane
 $z^{\ast }=0$
either without the cavity (figure 5
a) or with the shallow cavity (figure 5
b). On the other hand, in the plane
 $y^{\ast }=0$
, the shallow cavity in figure 5(e) is associated with a more horizontal back flow than without the cavity (figure 5
d) improving the top/bottom symmetry of the bubble. For both the baseline and the shallow cavity, the recirculation the closest to the base, observed in figure 5(a,b) at the right edge (
 $y^{\ast }>0$
) is quite circular and will be referred to as the circular recirculation. All the other recirculations located at the left (
 $y^{\ast }<0$
), top (
 $z^{\ast }>0$
) and bottom (
 $z^{\ast }<0$
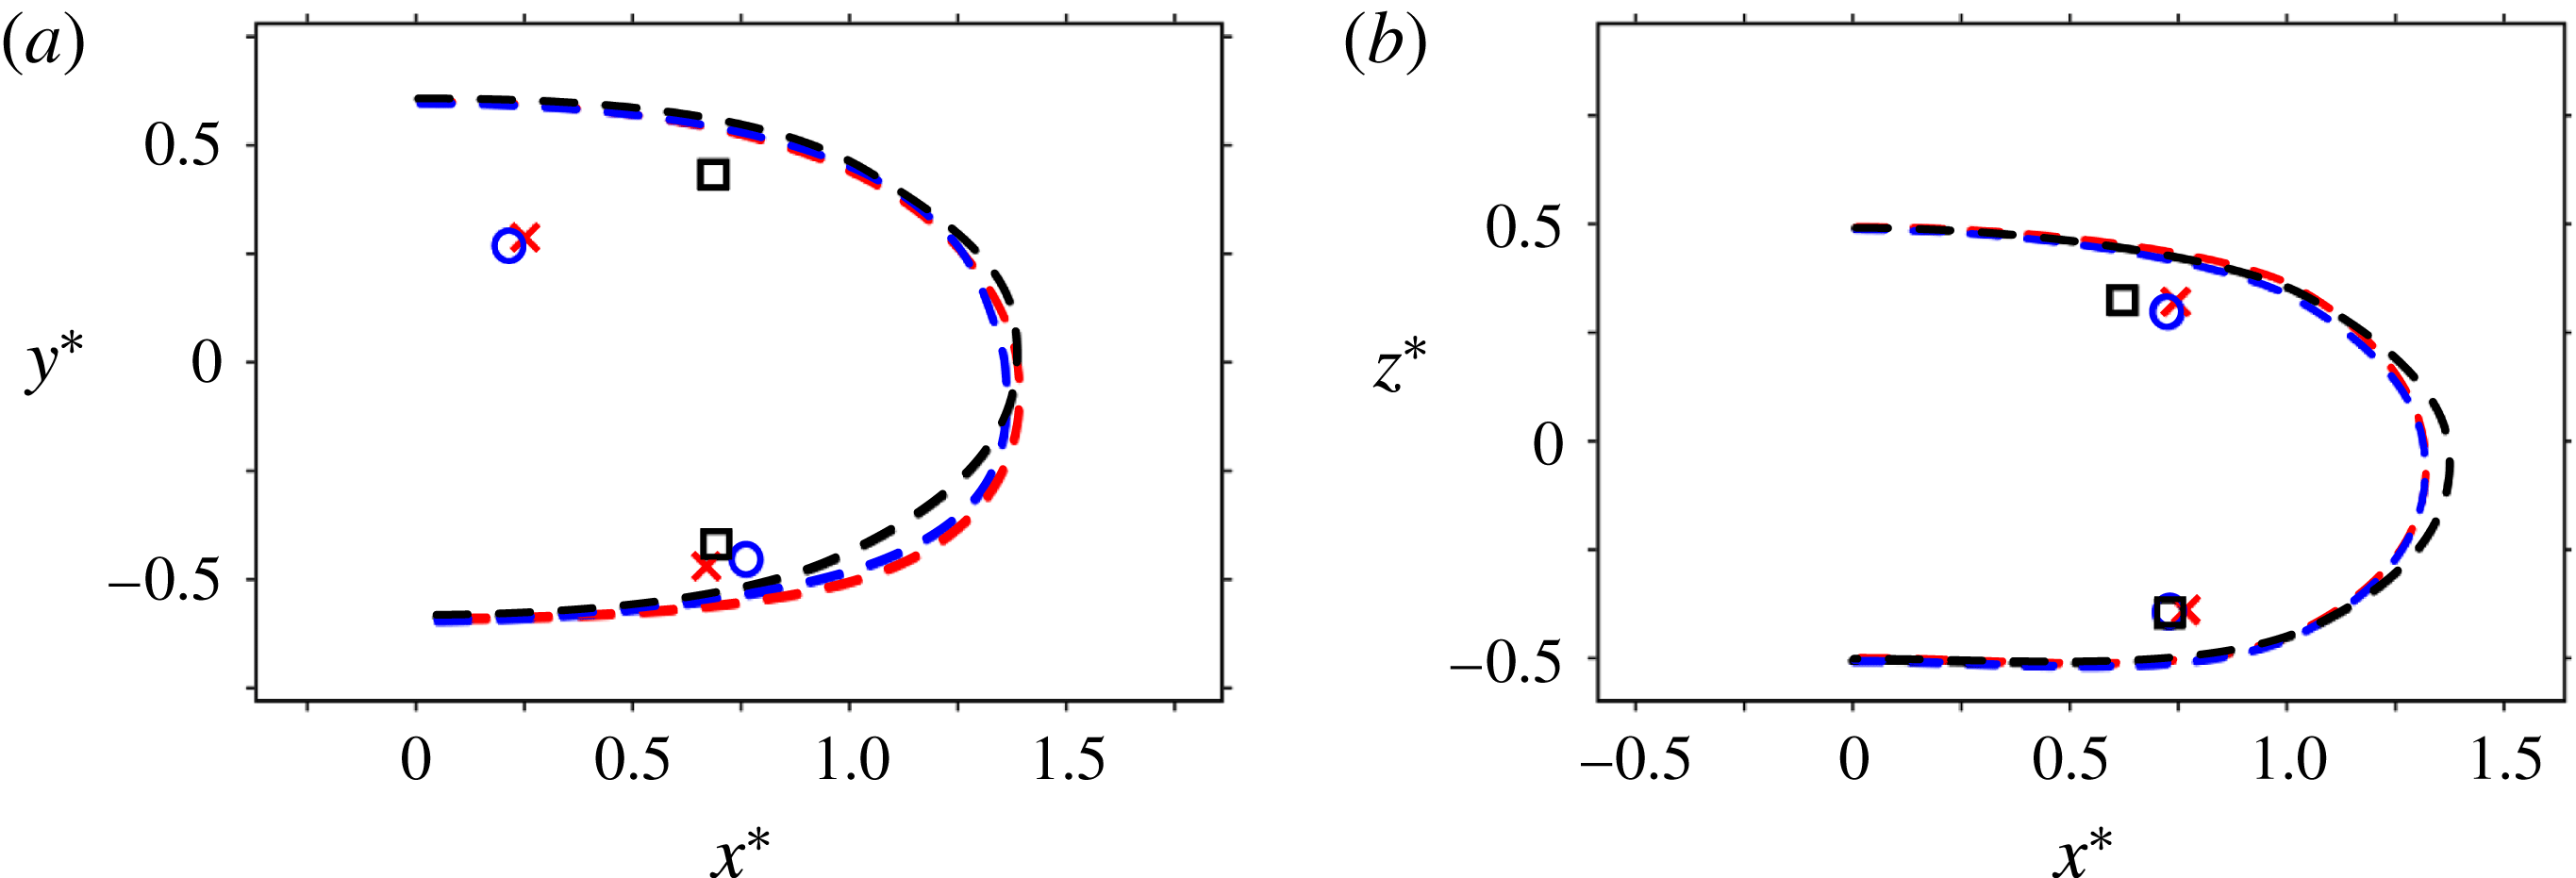
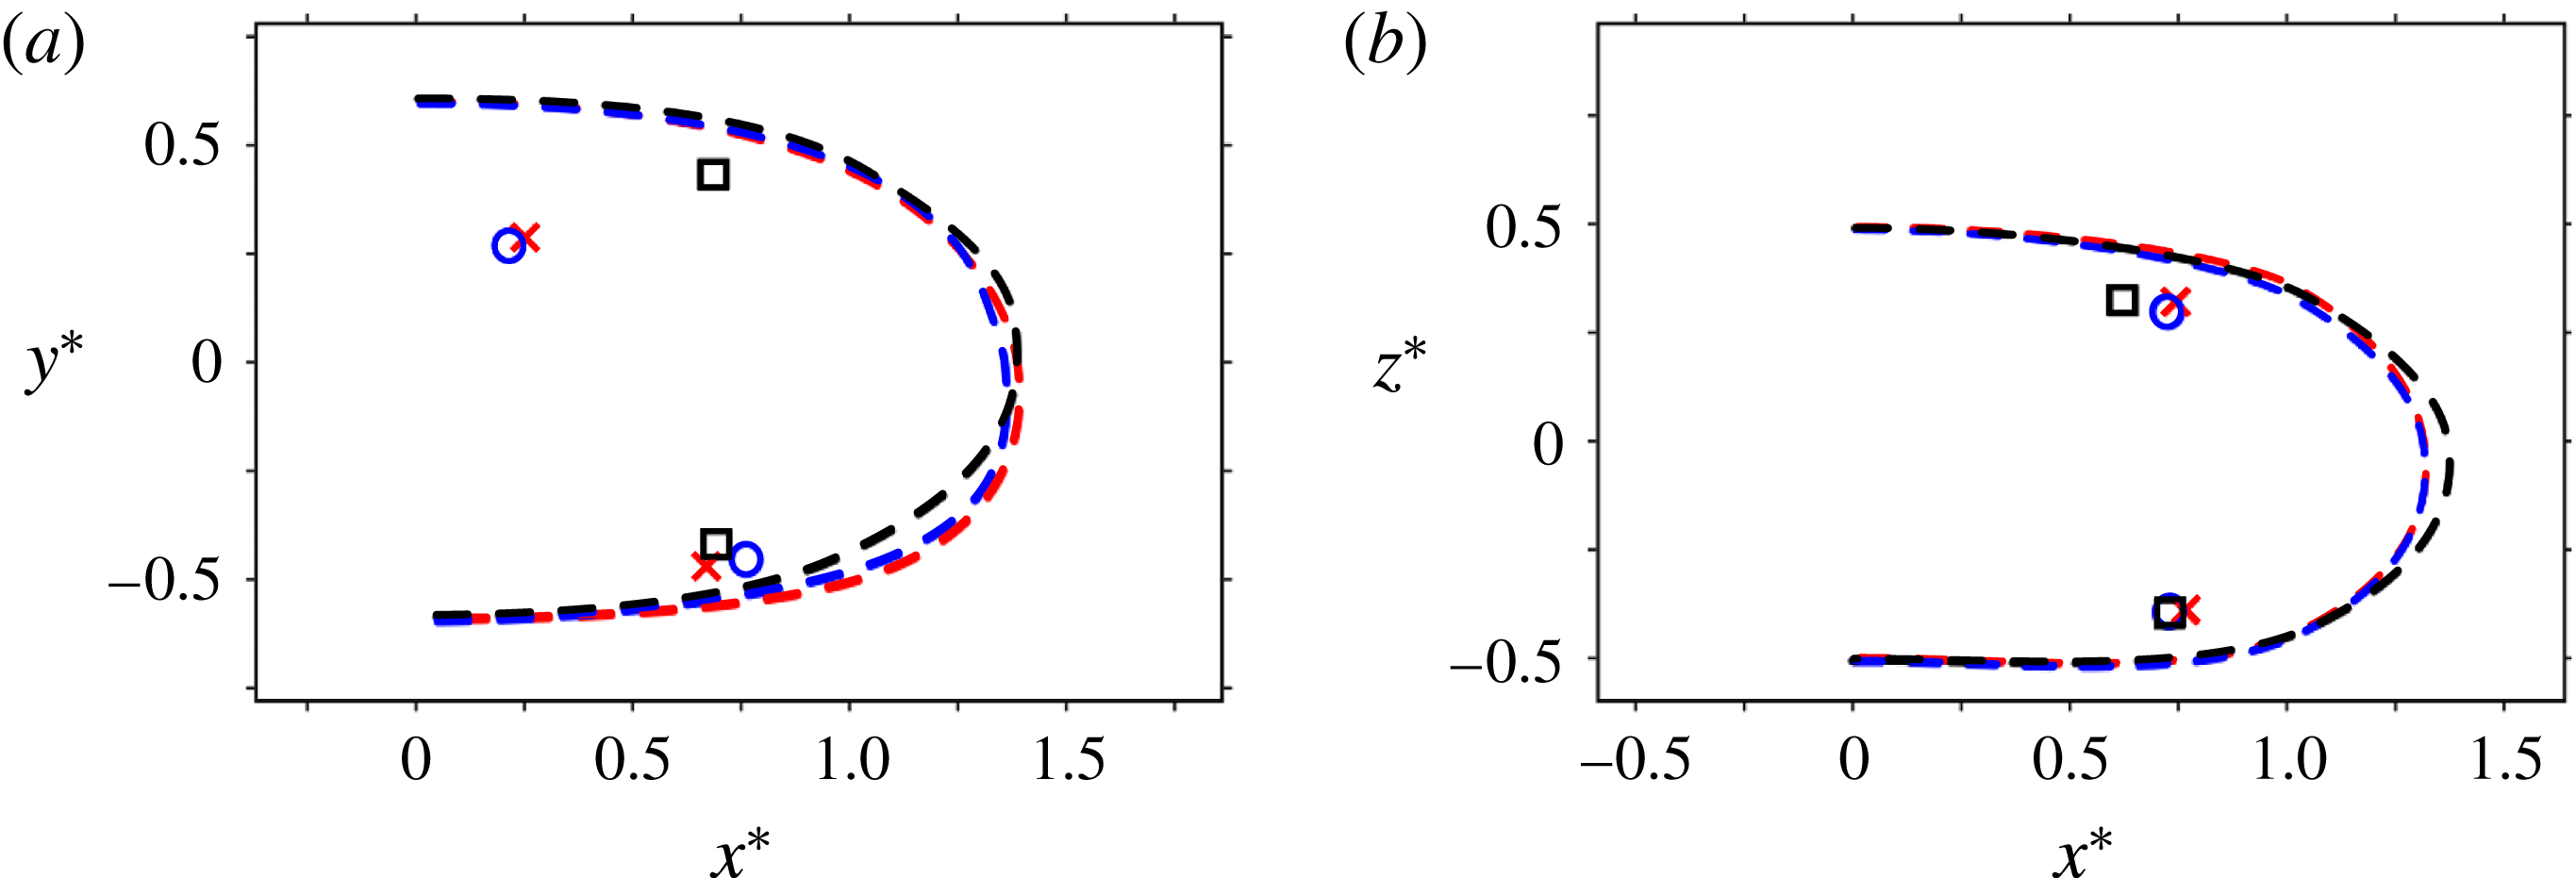
) edge are much further apart from the base and present elliptical shapes. When the cavity is deepened in figure 5(c,f), the remarkable modification summarized in figure 6 is that the circular recirculation close to the right edge whose centre is located by the red cross (no cavity) or the blue circle (shallow cavity), is replaced by an elliptical recirculation whose centre is located by a black square similarly to the recirculations observed at the three other edges. Although the curve limiting the recirculating bubble shown in figure 6 changes shape as the cavity is produced, its size is only significantly lengthened in the plane
 $y^{\ast }=0$
by a small amount of
 $4.4\,\%$
in figure 6(b) for the deepest cavity compared to that of the other cases.
Streamlines of the mean flow in the plane
 $z^{\ast }=0$
(a–c) and in the plane
 $y^{\ast }=0$
(d–f); for
 $d^{\ast }=0$
(a,d),
 $d^{\ast }=0.047$
(b,e) and
 $d^{\ast }=0.337$
(c,f). The limit of the recirculating bubble is represented by dashed curve, symbols locate centres of recirculations.

Limit of the recirculating bubble (dashed lines) and locations of recirculation centres with identical symbols as in figure 5, in the plane
 $z^{\ast }=0$
(a) and in the plane
 $y^{\ast }=0$
(b) for
 $d^{\ast }=0$
(red cross symbols),
 $d^{\ast }=0.047$
(blue circle symbols) and
 $d^{\ast }=0.337$
(black square symbols).
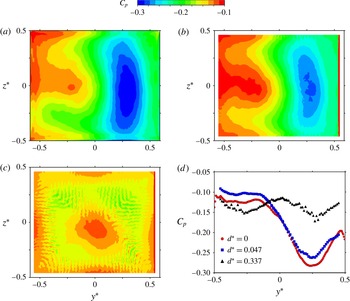
Mean pressure coefficient
 $C_{p}$
distribution at the base of the body; for
 $d^{\ast }=0$
(a),
 $d^{\ast }=0.047$
(b) and
 $d^{\ast }=0.337$
(c). (d) Mean pressure coefficient along the horizontal line
 $z=0$
for the three cases (a–c).

3.4 Mean pressure and velocity fields
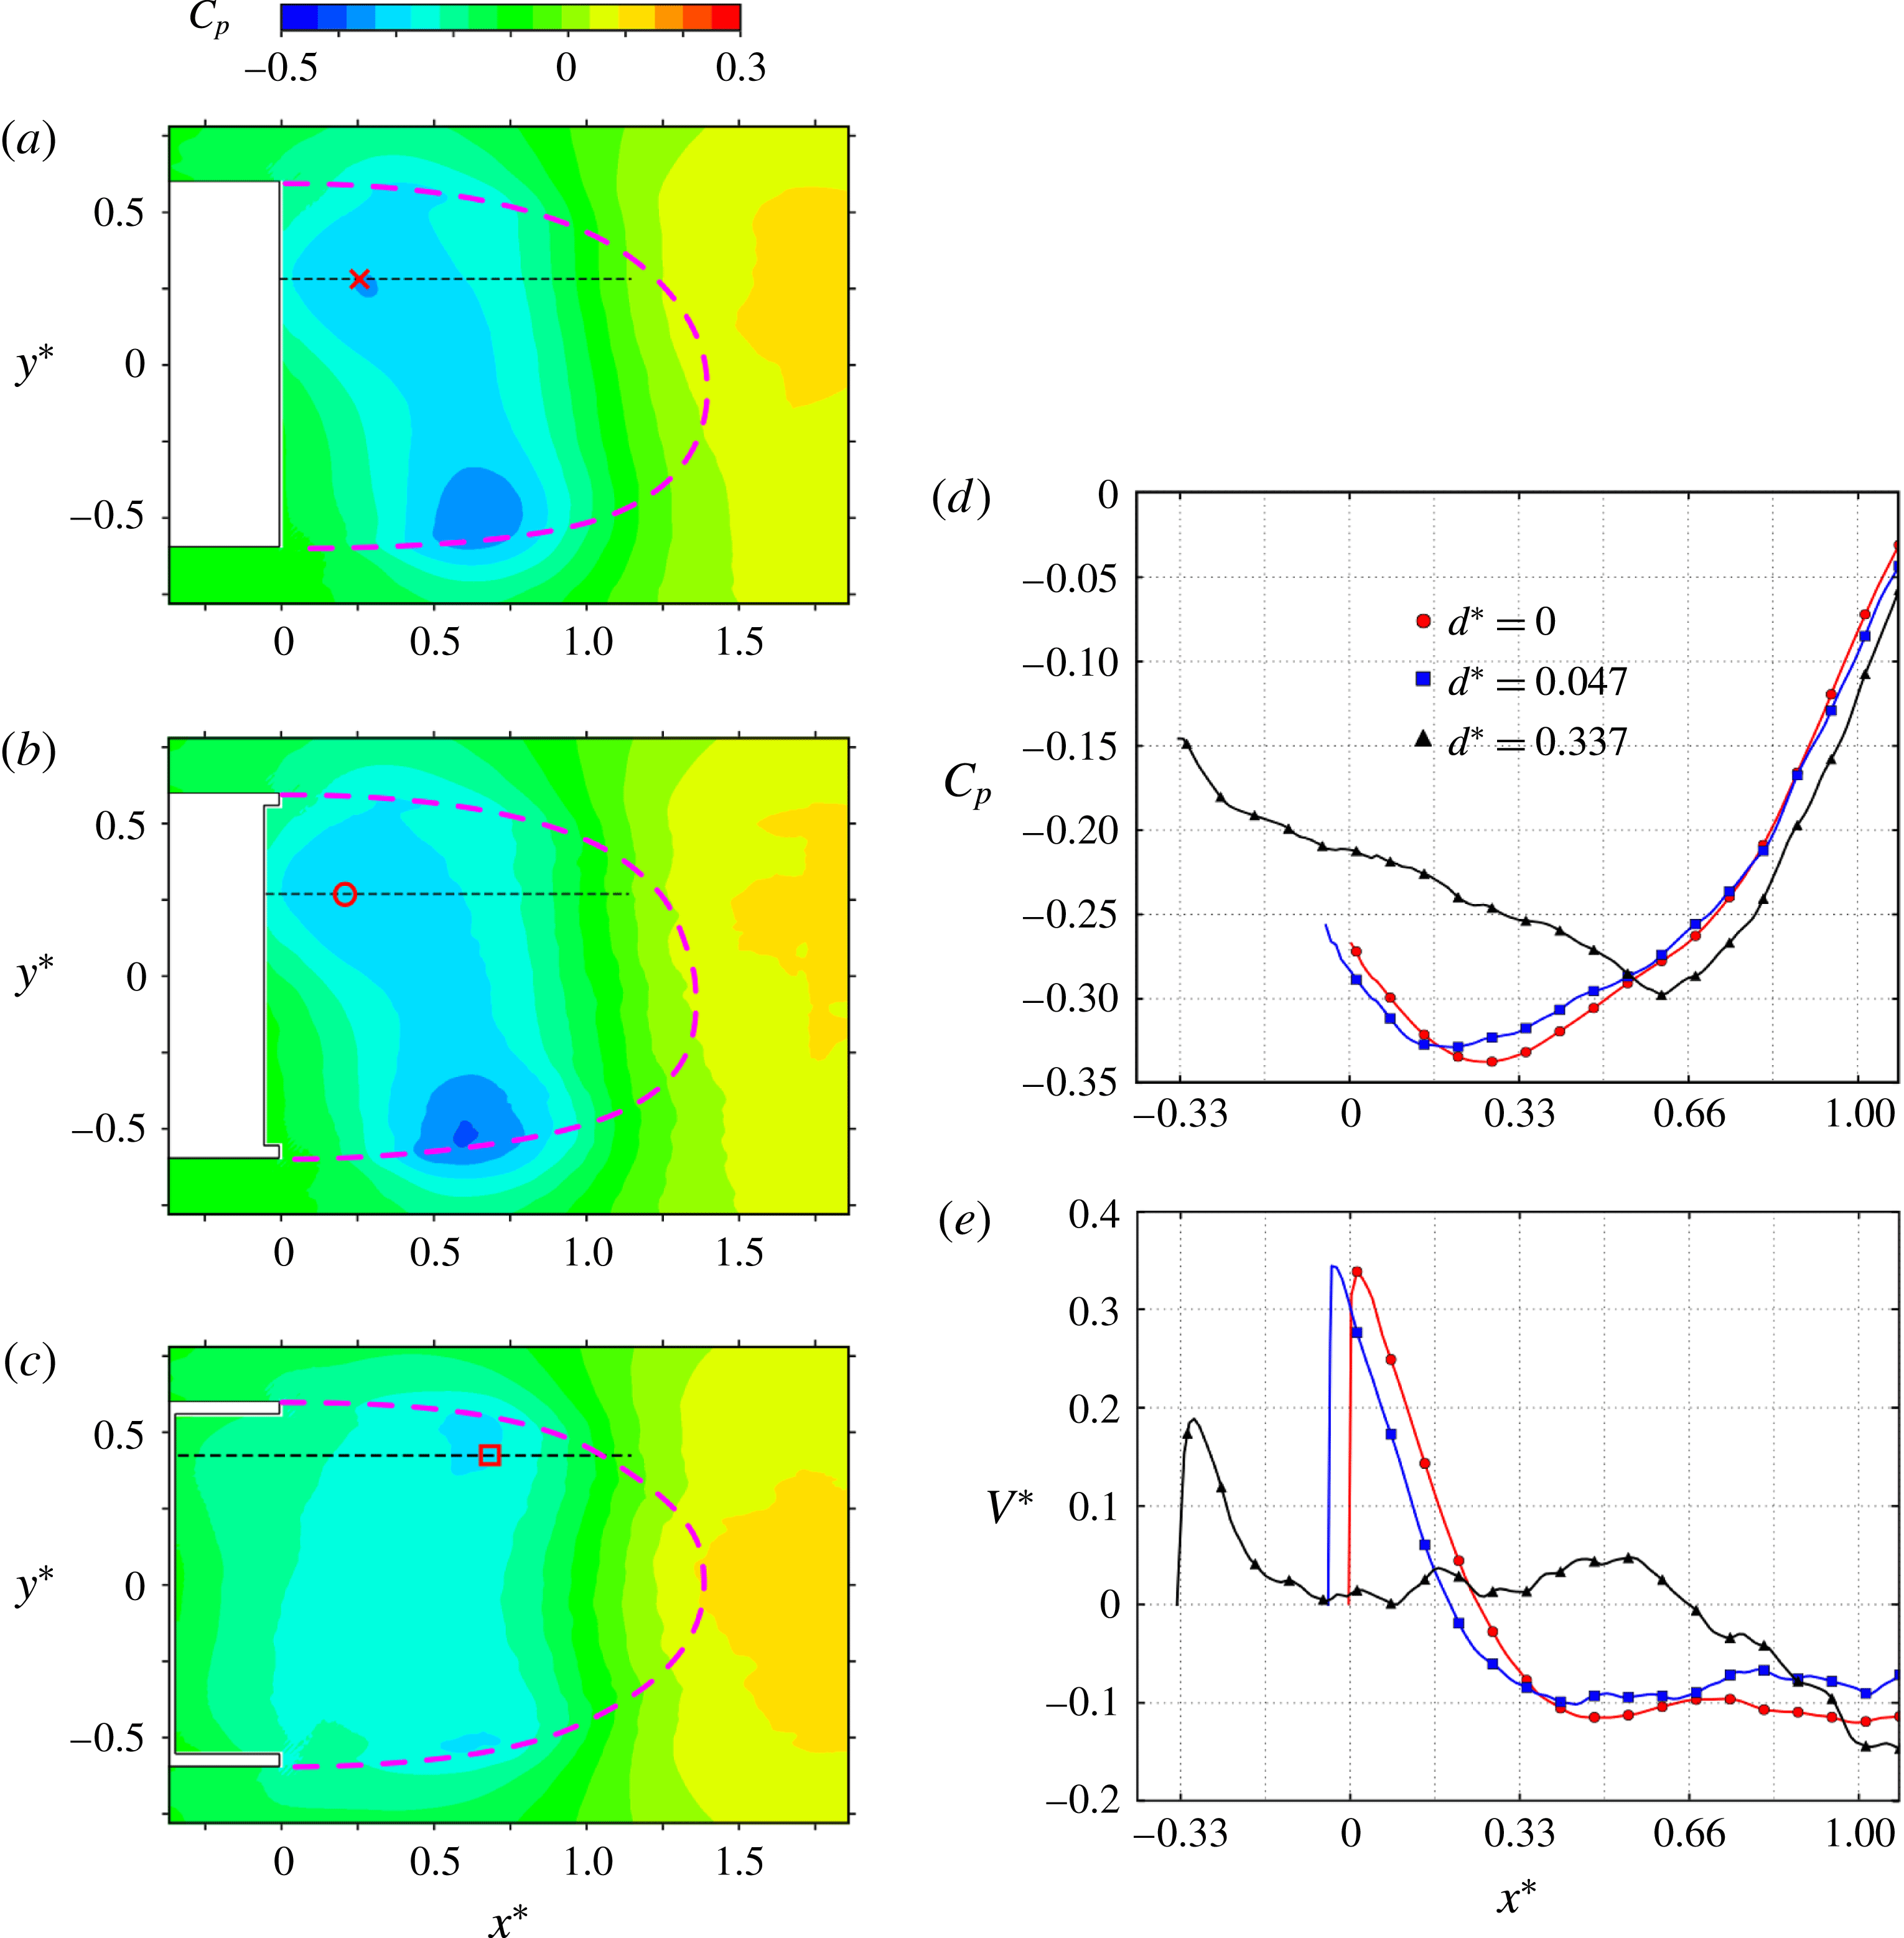
As the drag reduction induced by the cavity is directly related to an increase of the base pressure (table 1), we now investigate the mean pressure distribution at the base of the body. These distributions are shown for the three cases in figure 7(a–c). For
 $d^{\ast }=0$
and
 $d^{\ast }=0.047$
(figure 7
a,b), the low pressure area on the right hand side of the base (
 $y^{\ast }>0$
) is facing the circular part of the toroidal recirculation denoted by the red symbols in both figures 5(a) and 5(b). The pressure distribution at the base of the deep cavity in figure 7(c) respects satisfactorily the symmetry of the geometry. The simulation reports the same observation as in Evrard et al. (Reference Evrard, Cadot, Herbert, Ricot, Vigneron and Délery2016), the low pressure region disappears leading to pressure levels comparable to the highest pressure levels of the baseline in figure 7(a). This is even better quantified in figure 7(d) by plotting the mean pressure coefficient at the base along the horizontal line
 $z^{\ast }=0$
. A more subtle effect can be observed with the shallow cavity case. Actually, it displays almost the same pressure variations as for the baseline except that the distribution in figure 7(b) is slightly shifted towards larger values of pressure coefficients. This global pressure increment that can be seen in figure 7(d) is very close to the base suction difference of
 $0.022$
observed between the two configurations in table 1, thus suggesting that the drag reduction is solely attributed to this global increment.
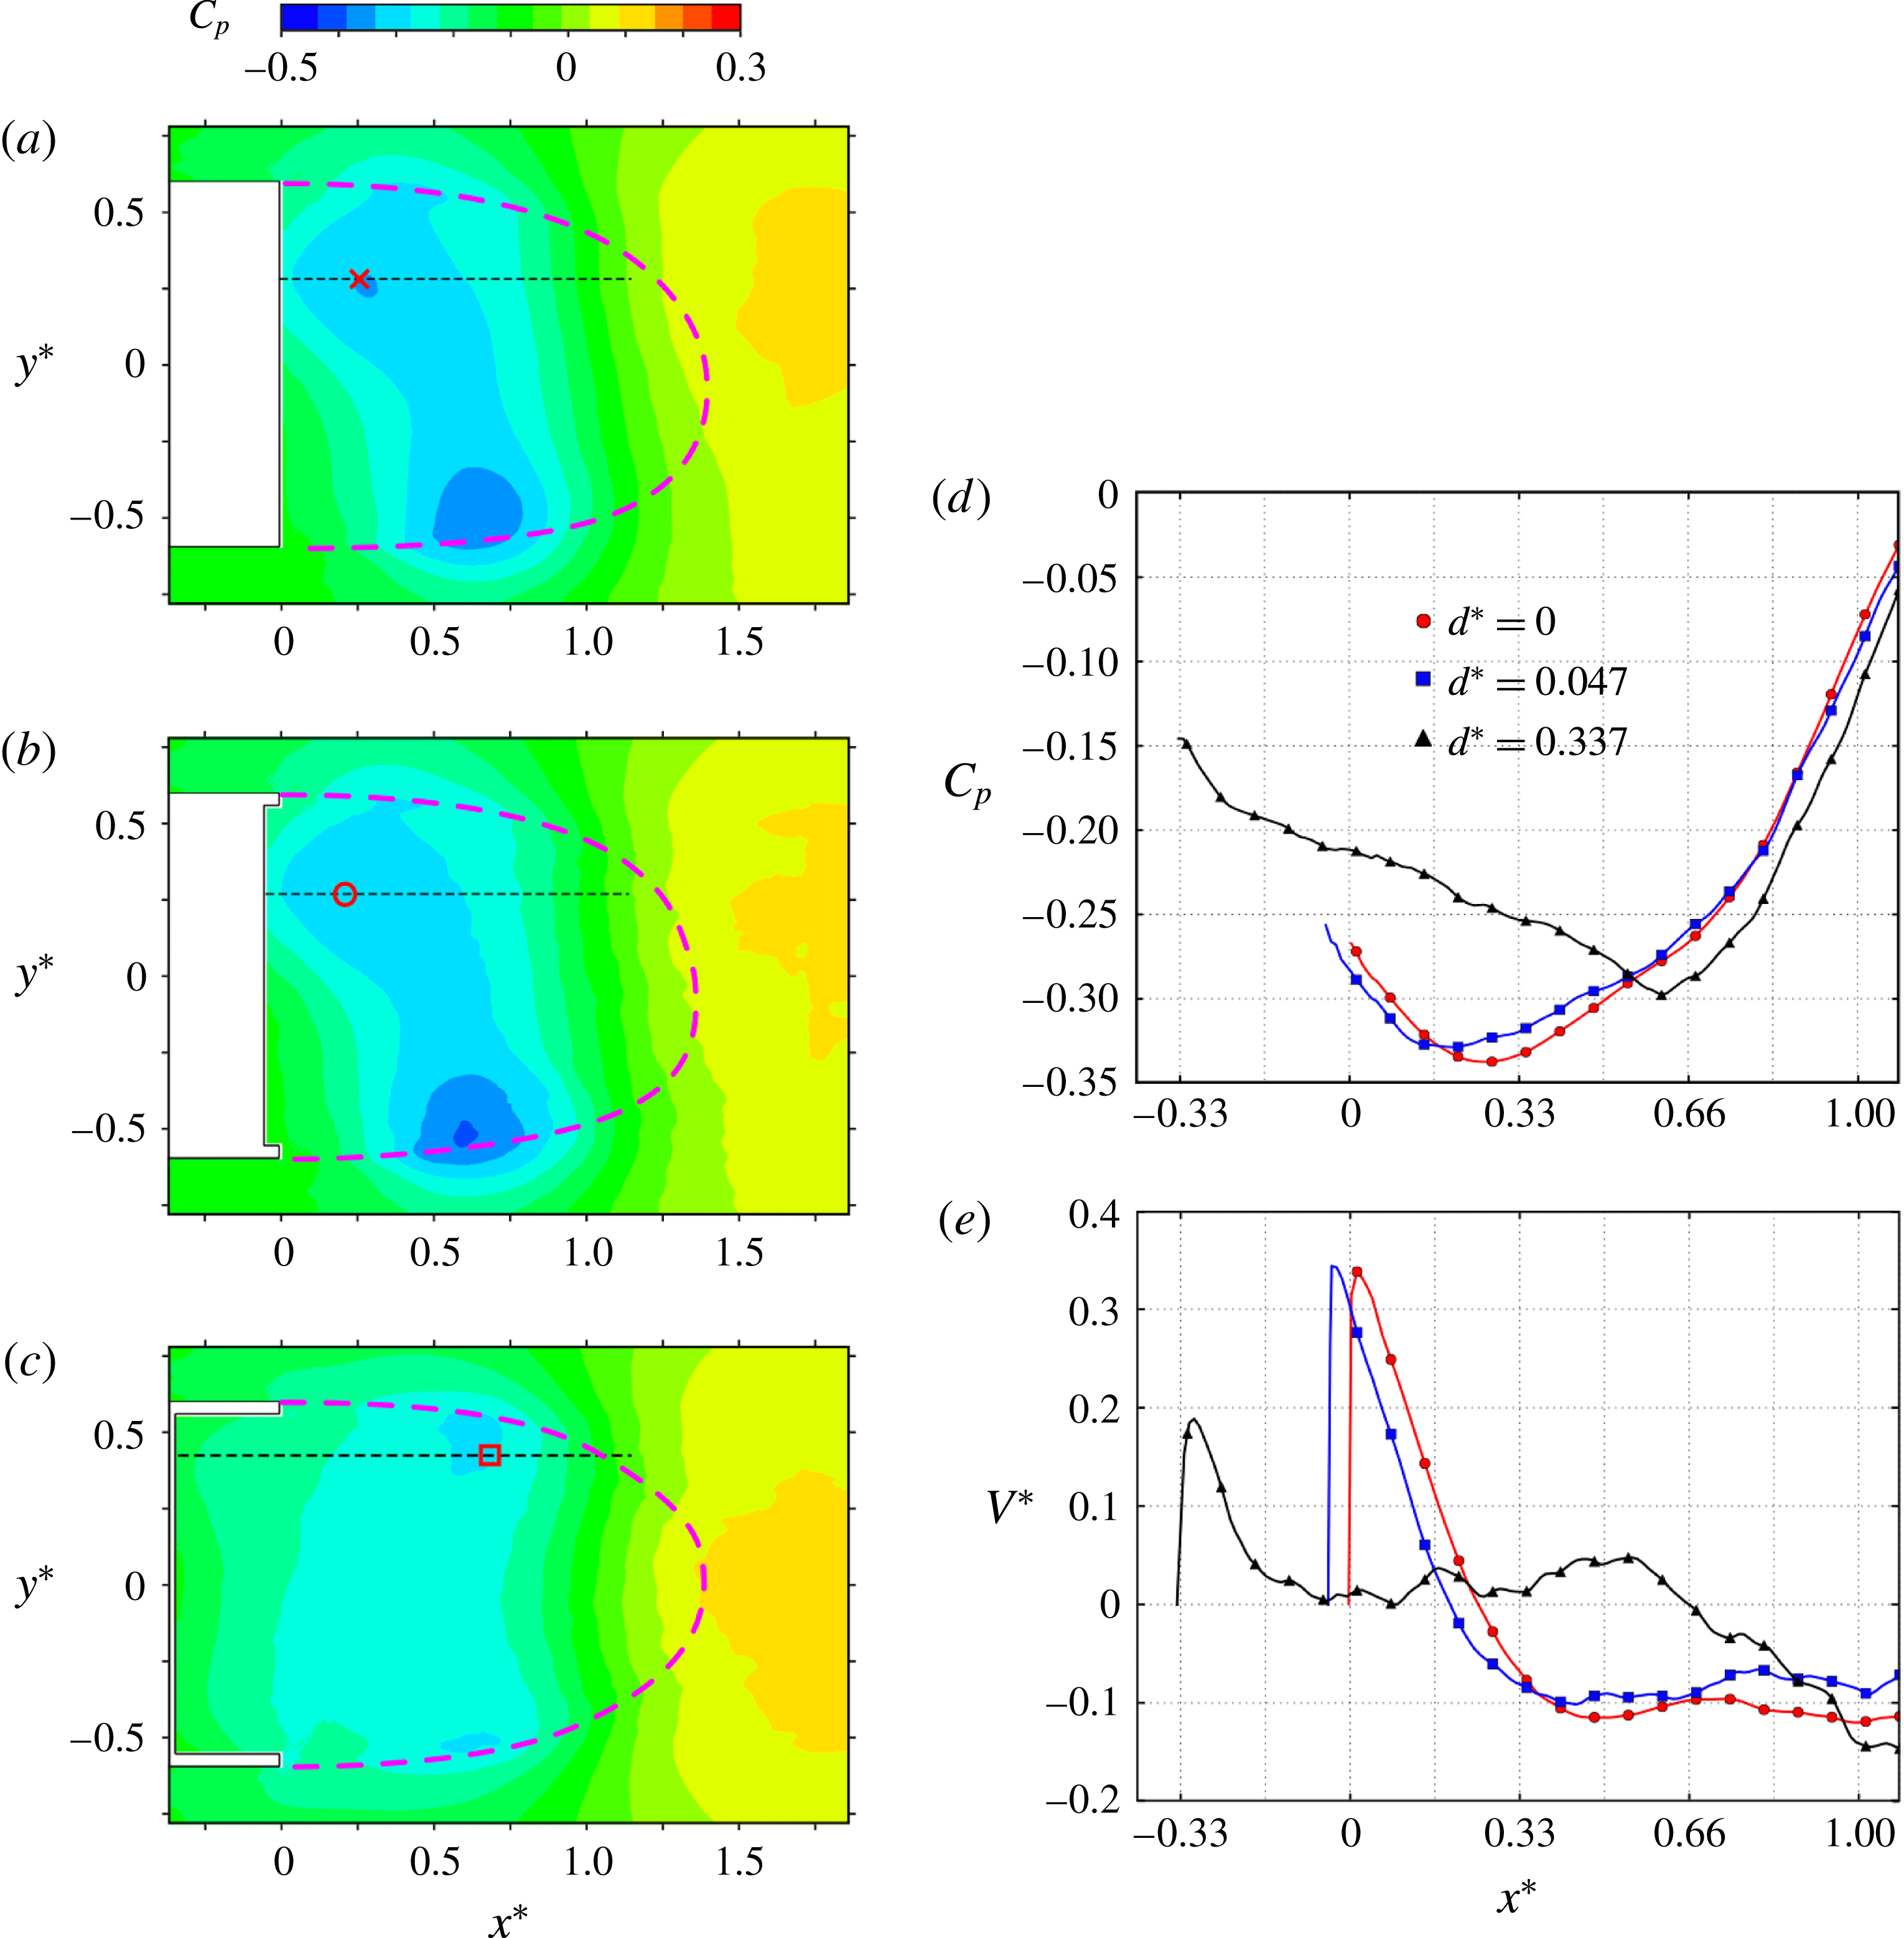
The modification of the pressure distribution downstream the base can be seen in the set of figure 8. To better quantify the flow facing the low pressure imprint on the body base, the pressure distribution along a line
 $y^{\ast }=\text{const.}$
that passes through the centre of the circular recirculation is then displayed in figure 8(d). Both distributions, for the baseline and shallow cavity, indicate an almost identical pressure field for
 $x^{\ast }>0.5$
, while they are horizontally and vertically shifted from each other for
 $x^{\ast }<0.5$
. They both present a local minimum, with a well shape indicating the presence of a viscous vortex flow (i.e. the circular recirculation) source of a low pressure. The horizontal shift appears to be introduced by the cavity depth of
 $d^{\ast }=0.047$
, indicating that the centre of the circular recirculation remains at the same distance from the base of the body. The vertical shift is introduced in the region
 $0.33<x^{\ast }<0.5$
where the pressure gradient with the cavity is reduced compared to that of the baseline. The corresponding mean vertical velocity component
 $V^{\ast }$
along the same horizontal lines are displayed in figure 8(e). Again a clear horizontal shift corresponding to the cavity depth is observable between the baseline and the shallow cavity. The interaction of the viscous vortex with the base leads to the same maximum of velocity close to the base and the velocity gradients are very similar for
 $x^{\ast }<0.33$
. The mechanism suggested by Evrard et al. (Reference Evrard, Cadot, Herbert, Ricot, Vigneron and Délery2016) based on a weakened interaction of the circular recirculation with the body base is not observed for the shallow cavity. Instead, the present study shows for the shallow cavity that the mean flow has not changed in the vicinity of the base due to an effect of translation of the toroidal recirculation inside the cavity over a distance corresponding to the cavity depth. With the deep cavity, the back flow enters the cavity up to the body base resulting in hugely elongated recirculations (figure 5
c,f) which considerably reduces the velocity gradients around the recirculation centre at
 $x^{\ast }\simeq 0.66$
in figure 8(e) as well as the maximum velocity at the base proximity.
So far, the effect of the cavity has been studied inside the recirculating region, we now turn to the external boundaries of the recirculation, by focusing on the development of the vortex layers initiated by the separation at the periphery of the body base.
Mean pressure coefficient
 $C_{p}$
distribution of the recirculating bubble in the plane
 $z^{\ast }=0$
; for
 $d^{\ast }=0$
(a),
 $d^{\ast }=0.047$
(b) and
 $d^{\ast }=0.337$
(c). Mean pressure coefficient
 $C_{p}$
distribution (d) and velocity component
 $V^{\ast }$
(e) along the iso-
 $y$
-line passing through the centre of the intense recirculation close to the base as depicted in (a–c).
3.5 Mixing layers, velocity fluctuations and vortex dynamics
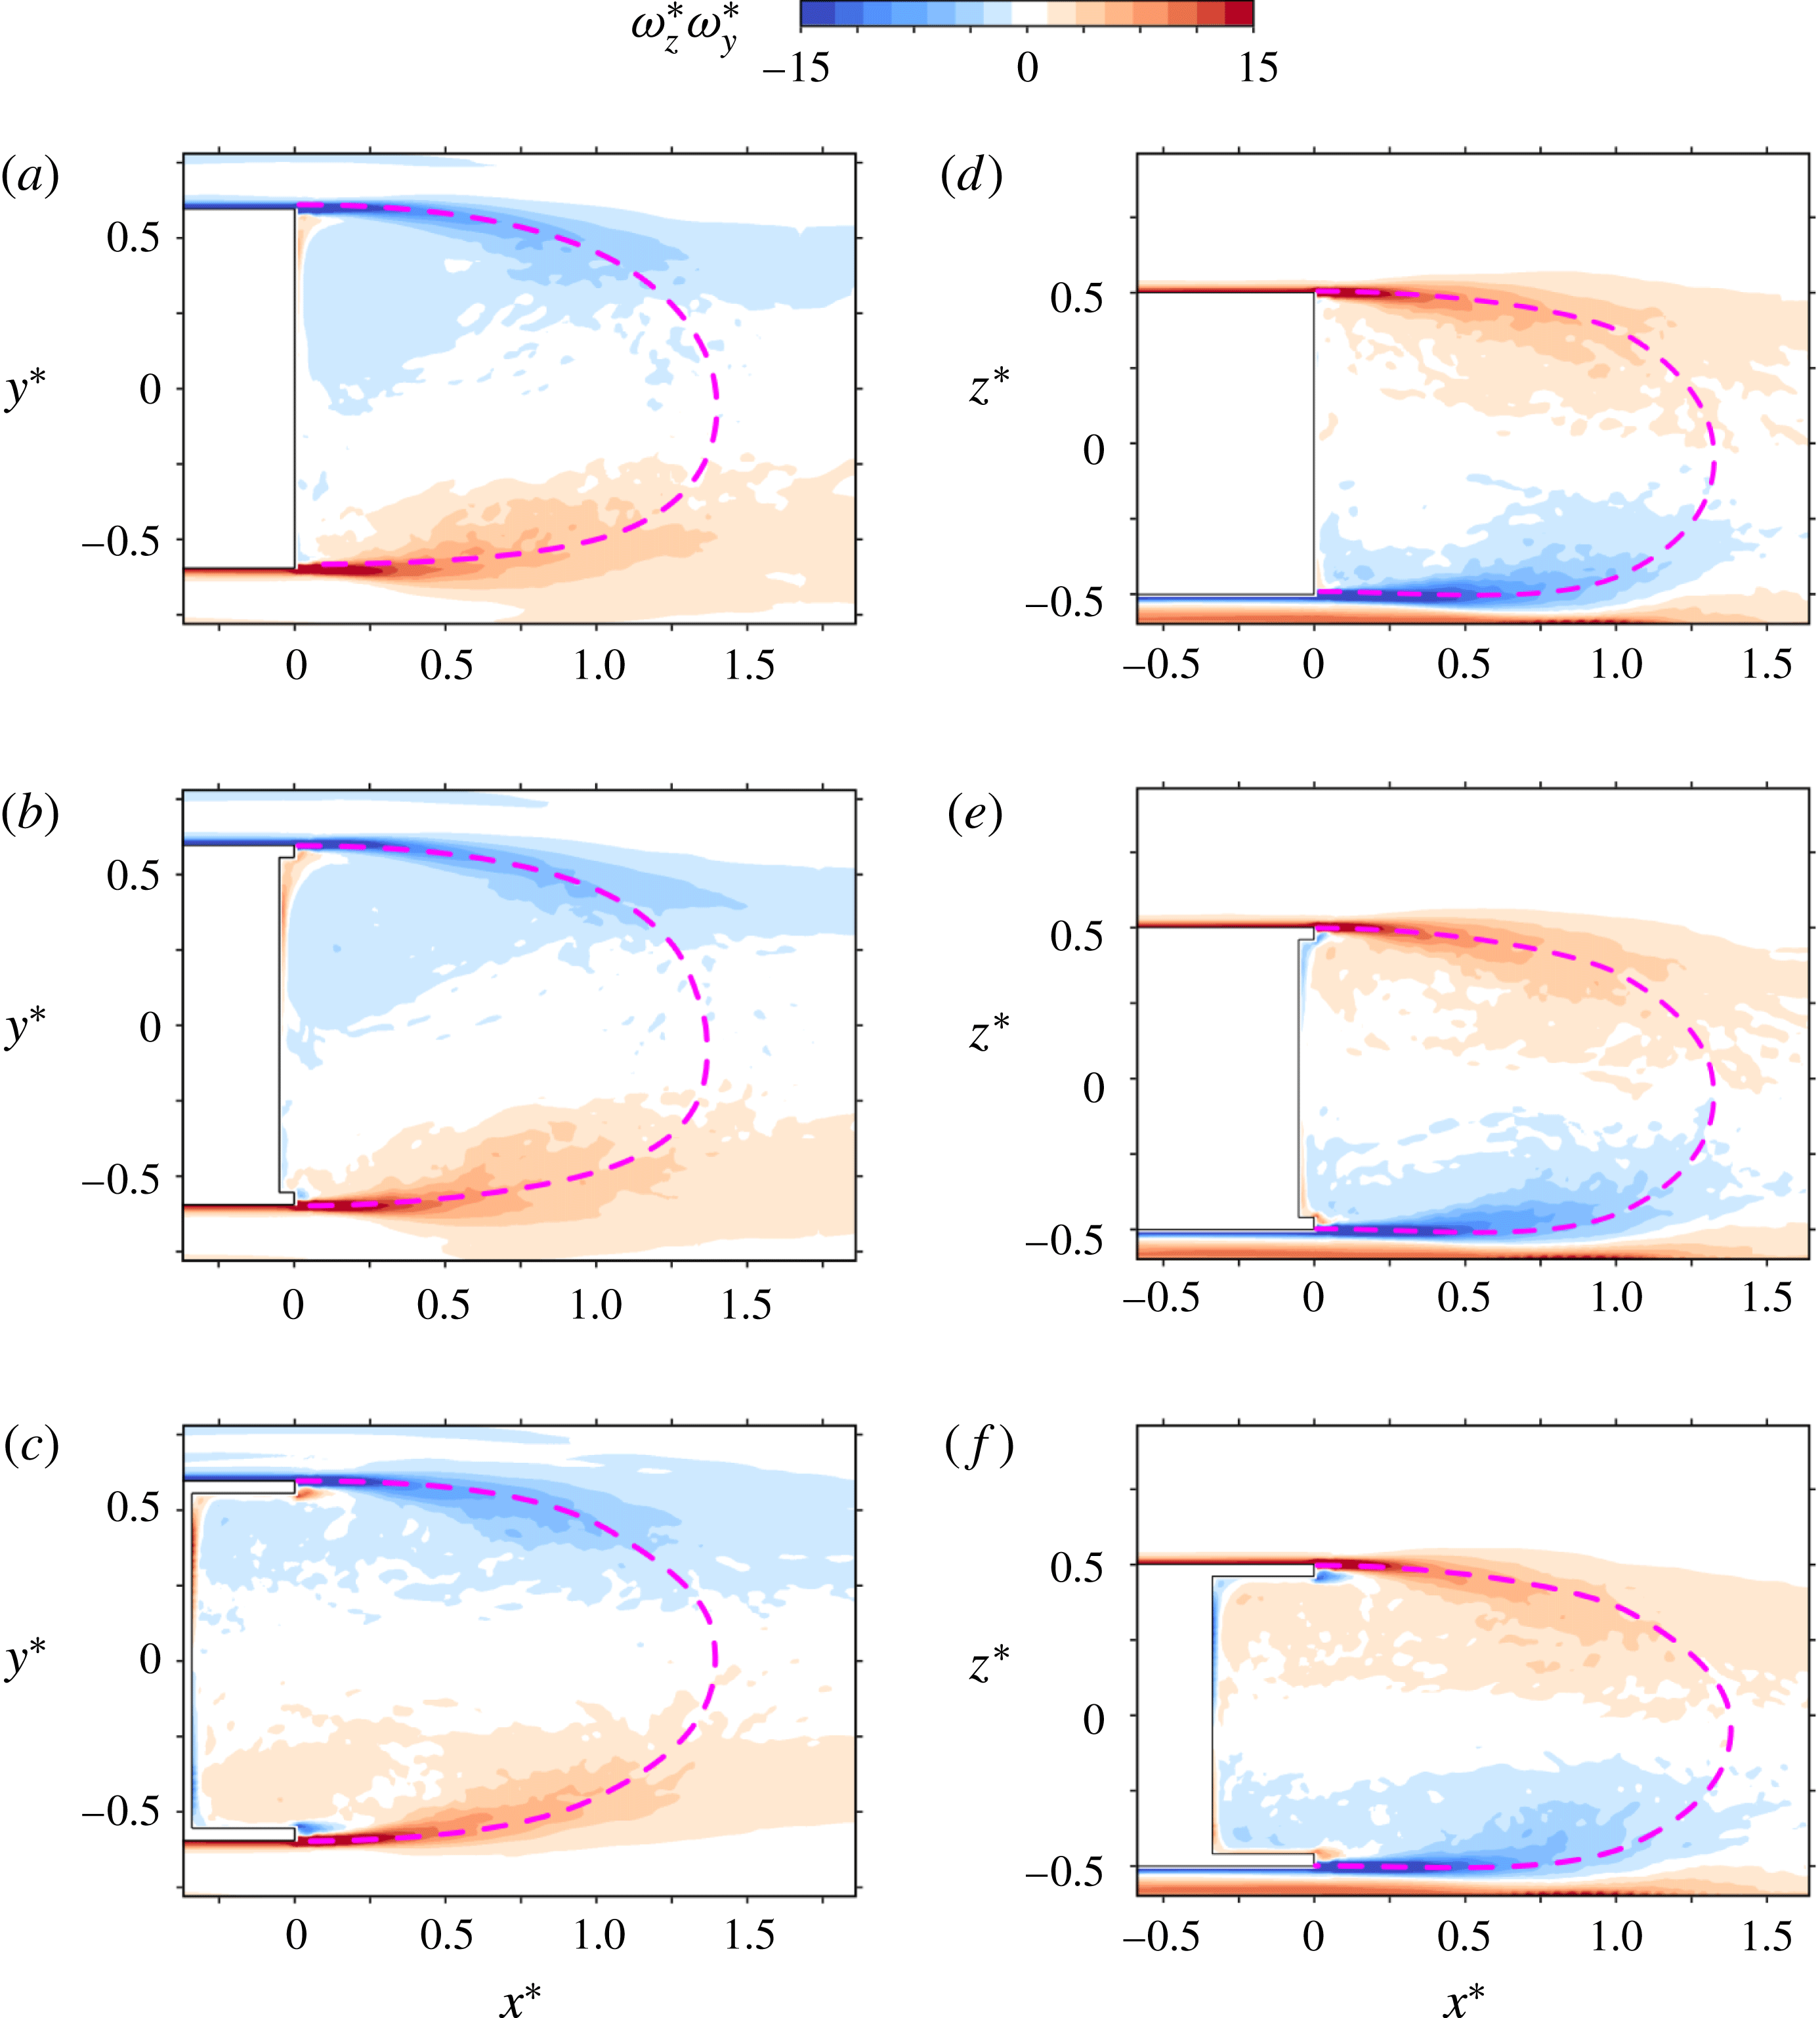
We are interested in the development of the vortex layers created on the body prior detachments. The vorticity vectors contained in these layers are mainly perpendicular to the main flow and parallel to the wall from which the vortex layer detaches.
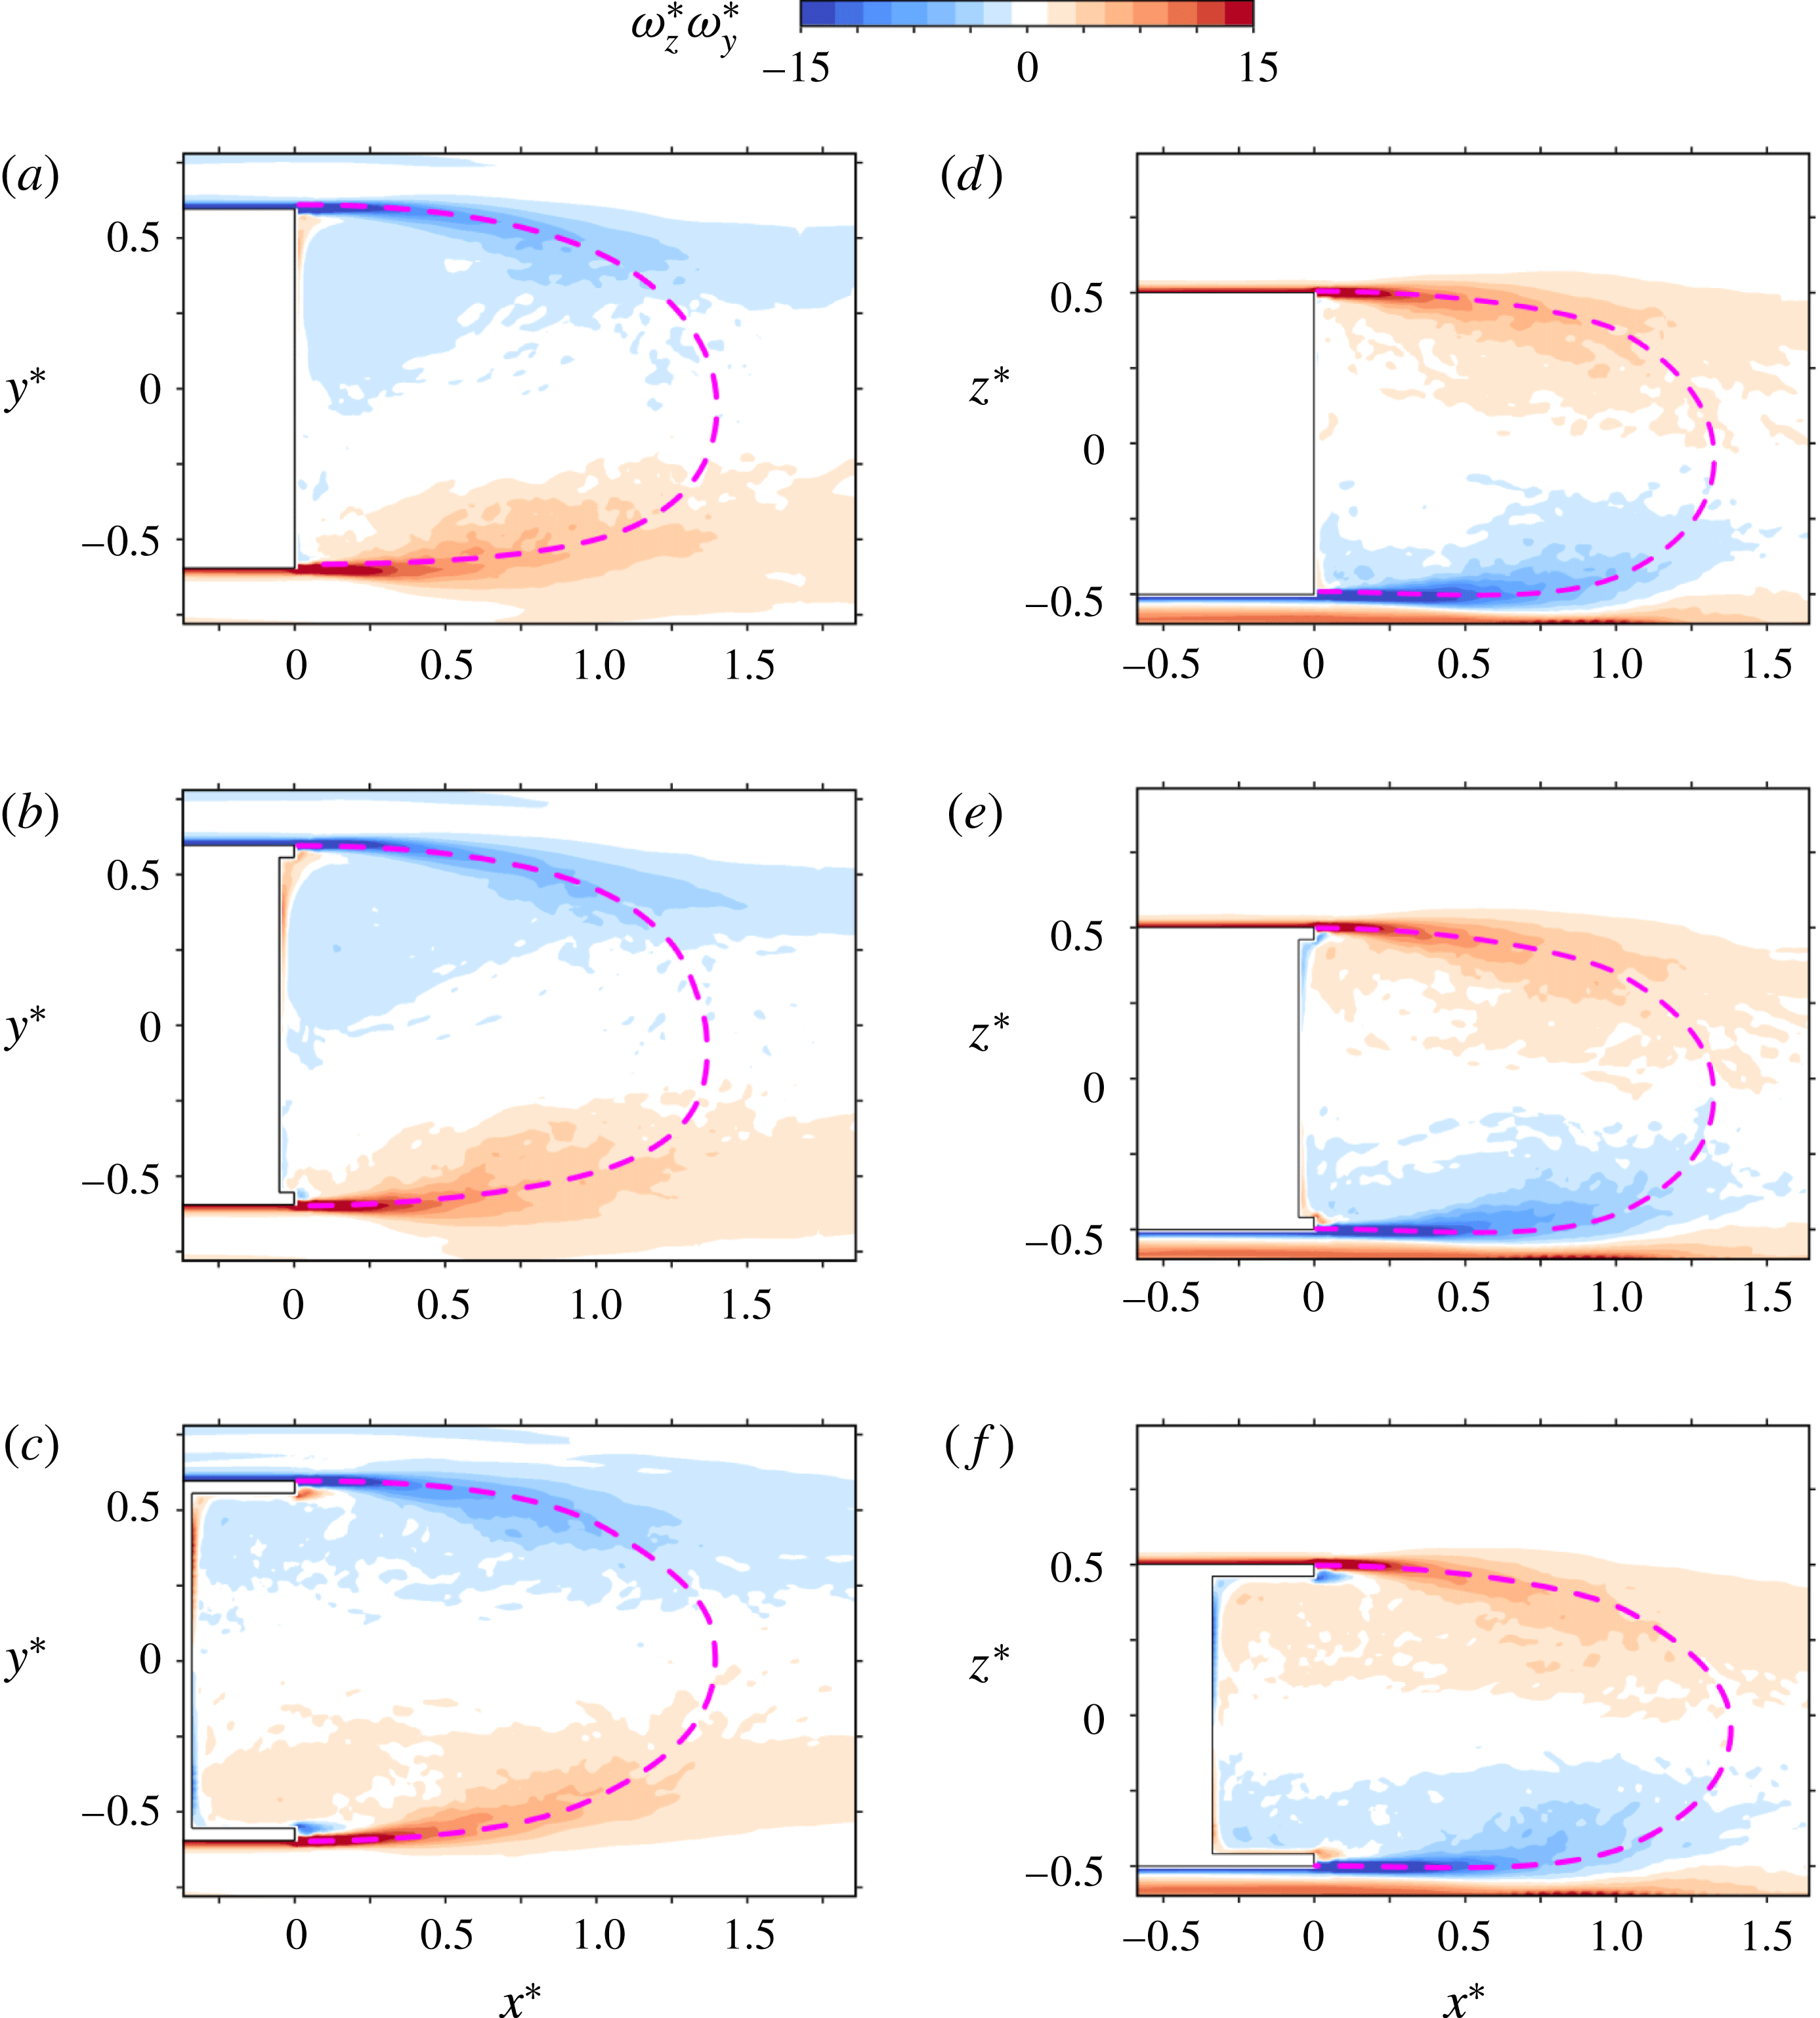
The mean development of this spanwise vorticity component is shown in figure 9 in the two planes
 $z^{\ast }=0$
and
 $y^{\ast }=0$
. No significant differences in the development of the mixing layer are detectable between the shallow cavity (figure 9
a,d) and no cavity (figure 9
b,e). Both present a uniform negative vorticity distribution inside the recirculation region in figures 9(a) and 9(b) due to the viscous vortex associated with the symmetry breaking as described in the previous section.
For the deep cavity in figure 9(c,f), the observed vorticity distribution confirms the symmetrization inside the recirculation with the disappearance of the viscous vortex. We can notice small but significant modifications in the mixing layer developments. In figure 9(c), the spreading rate of the right side mixing layer (
 $y^{\ast }>0$
) is larger than without the cavity while for the left side mixing layer (
 $y^{\ast }<0$
) it is smaller, in consistency with the wake symmetrization. For the mixing layers of the top and bottom sides shown in figure 9(f), it appears that only the top side mixing layer is affected with a smaller spreading rate than without a cavity.
Mixing layer development visualized with the
 $y$
-component of the vorticity in the plane
 $z^{\ast }=0$
(a–c) and with the
 $z$
-component of the vorticity in the plane
 $y^{\ast }=0$
(d–f); for
 $d^{\ast }=0$
(a,d),
 $d^{\ast }=0.047$
(b,e) and
 $d^{\ast }=0.337$
(c,f).
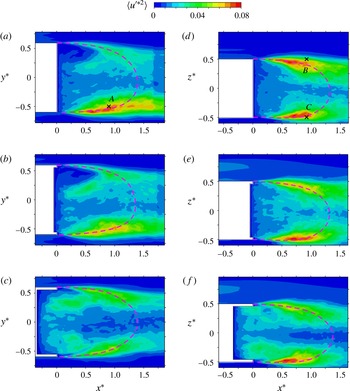
Mean turbulent kinetic energy distribution of the recirculating bubble in the plane
 $z^{\ast }=0$
(a–c) and in the plane
 $y^{\ast }=0$
(d–f); for
 $d^{\ast }=0$
(a,d),
 $d^{\ast }=0.047$
(b,e) and
 $d^{\ast }=0.337$
(c,f). Cross symbols in (a) and (d) locate the single point velocity signals
 $w_{A}(t)$
,
 $w_{B}(t)$
and
 $w_{C}(t)$
used for spectra analysis in figure 11.

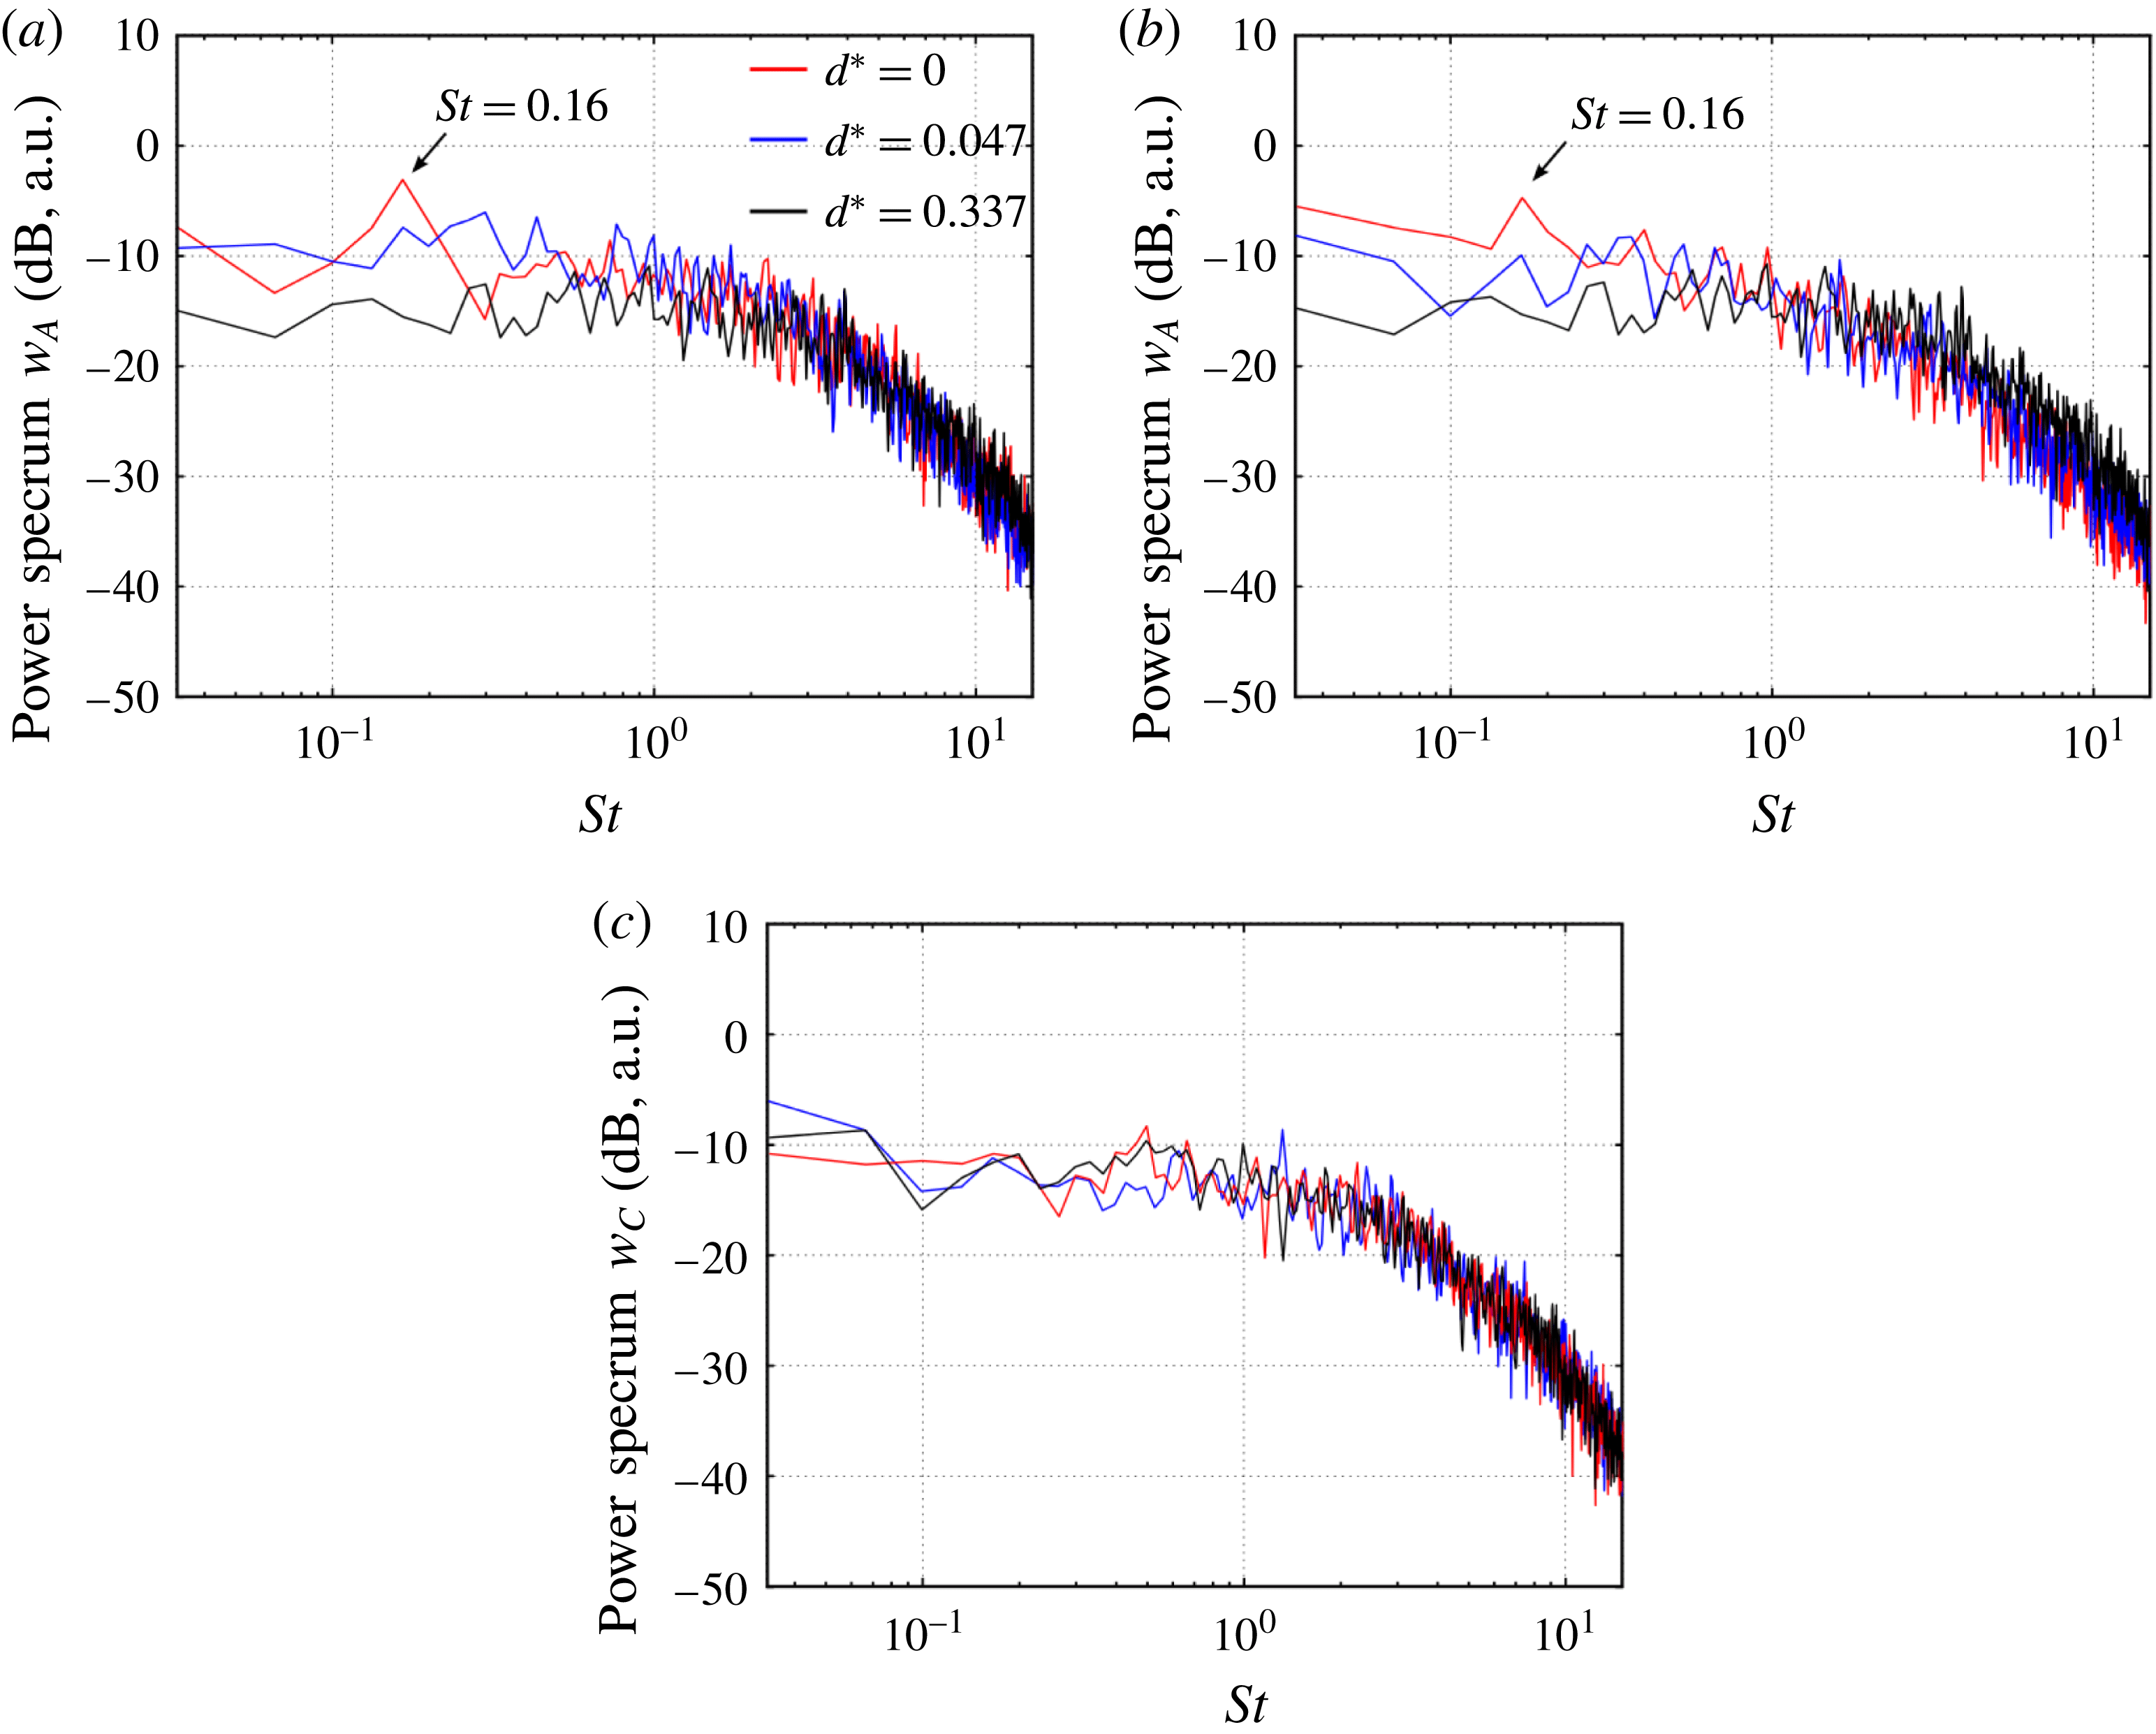
Log–log plot of the power spectrum of the vertical velocity component
 $w$
located at
 $A$
(a),
 $B$
(b) and
 $C$
(c) in figure 10 for the three cavity depths.

The fact that the facing mixing layer (
 $y>0$
) has comparatively almost no fluctuations can be explained by the work of Liou (Reference Liou1994) on the stability analysis of curved mixing layers. According to this study, a stabilization mechanism due to the large curvature imposed by the circular recirculation might be implied.
We show the statistics of the longitudinal component of the velocity fluctuations, defined from the classical Reynolds decomposition. With no cavity, the fluctuations in figure 10(a) are mainly concentrated in only one mixing layer, on the left side(
 $y^{\ast }<0$
). The fact that the facing mixing layer (
 $y^{\ast }>0$
) has comparatively almost no fluctuations can be explained by the work of Liou (Reference Liou1994) on the stability analysis of curved mixing layers. According to this study, a stabilization mechanism due to the large curvature imposed by the circular recirculation might be implied. These large asymmetry in the fluctuations was previously reported in the experimental work of Grandemange et al. (Reference Grandemange, Gohlke and Cadot2013b
) as well as in the simulation of Pasquetti & Peres (Reference Pasquetti and Peres2015). They were assumed in Grandemange et al. (Reference Grandemange, Gohlke and Cadot2013b
) from hot-wire measurements to be at the origin of the vortex shedding loops with a corresponding Strouhal number of order
 $0.2$
(or equivalently 13.5 Hz for the present work). Velocity time series have been recorded at a few different locations in the wake during 1.5 s with a sampling frequency of 144 kHz. The small recording duration gives a resolution of
 $\unicode[STIX]{x1D6FF}f=2.2~\text{Hz}$
which seems barely enough to identify the periodic mode in the power spectra. The spectra are shown for the lateral component
 $w$
of the velocity for three locations
 $A$
,
 $B$
and
 $C$
in order to probe respectively the left, top and bottom mixing layers. These locations are displayed with cross symbols in figure 10(a,b). Despite the poor frequency resolution of the spectra presented in figure 11(a,b), a periodic mode could be present in the range
 $St=0.16\pm 0.03$
with no cavity and at both locations
 $A$
and
 $B$
. As can be directly seen at these locations, the cavity effect corresponds to a high pass filtering, attenuating this mode. Concerning the bottom mixing layer probed at the
 $C$
location in figure 11(c), it is found that the power spectrum is not sensitive to the cavity depth.
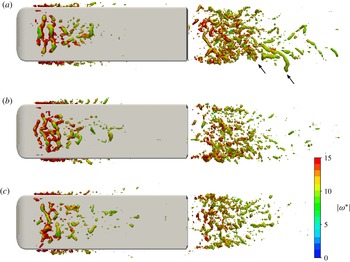
The instantaneous snapshot of the wake in figure 12(a) confirms the presence of vortex loops (indicated by arrows). These loops appear formed and shed from the side of large velocity fluctuations evidenced in figure 10(a). The shallow cavity produces an attenuation of these fluctuations by approximately
 $12\,\%$
in figure 10(b) while the deep cavity reduces them drastically by approximately
 $40\,\%$
in figure 10(c) together with a slight increase of the fluctuations of the opposite mixing layer. As a result, the velocity fluctuation statistics are symmetrized in a manner consistent with the mean flow either displayed as mean streamlines, mean vorticity or mean pressure earlier in the paper. An identical snapshot to that shown in figure 12(a) but with the deep cavity (figure 12
c) does not show vortex loops anymore, suggesting a suppression of the antisymmetric quasi-periodic fluctuations in accordance with the high pass filtering effect shown by the velocity spectra in figure 11.
The reduction of the fluctuations observed in the perpendicular plane in figure 10(d–f) can also be ascribed to this low frequency filtering associated with a reduction of the shedding activity as the cavity depth is increased. However, the bottom mixing layer (corresponding to
 $z^{\ast }<0$
) keeps an almost constant level of fluctuations with a velocity spectrum insensitive to the presence of the cavity, and no indication of the mode at
 $St=0.16$
(figure 11
c). The acceleration in the underbody flow due to the floor proximity intensifies local shear instabilities after separation that are likely dominating the dynamics of the bottom mixing layer.
Wake visualization of the iso-surface of the Q-criterion, with
 $Q=100\,000$
(
 $Q^{\ast }=22$
) coloured by the vorticity modulus; for
 $d^{\ast }=0$
(a),
 $d^{\ast }=0.047$
(b) and
 $d^{\ast }=0.337$
(c).

4 Discussion
4.1 Numerical simulation versus experiment
The numerical simulation is designed to reproduce the experimental geometry of Evrard et al. (Reference Evrard, Cadot, Herbert, Ricot, Vigneron and Délery2016) with an identical flow Reynolds number. Some unexpected discrepancies are observed and need comments. Actually, base suction and force coefficients in table 1 are approximately
 $20\,\%$
larger than those measured in the experiment. To refine the comparison, it is necessary to compare the conditional average on one mirror mode only obtained by Evrard et al. (Reference Evrard, Cadot, Herbert, Ricot, Vigneron and Délery2016) to the computed wake that is permanently locked on one mode. Doing so, we estimated a correction of
 $1\,\%$
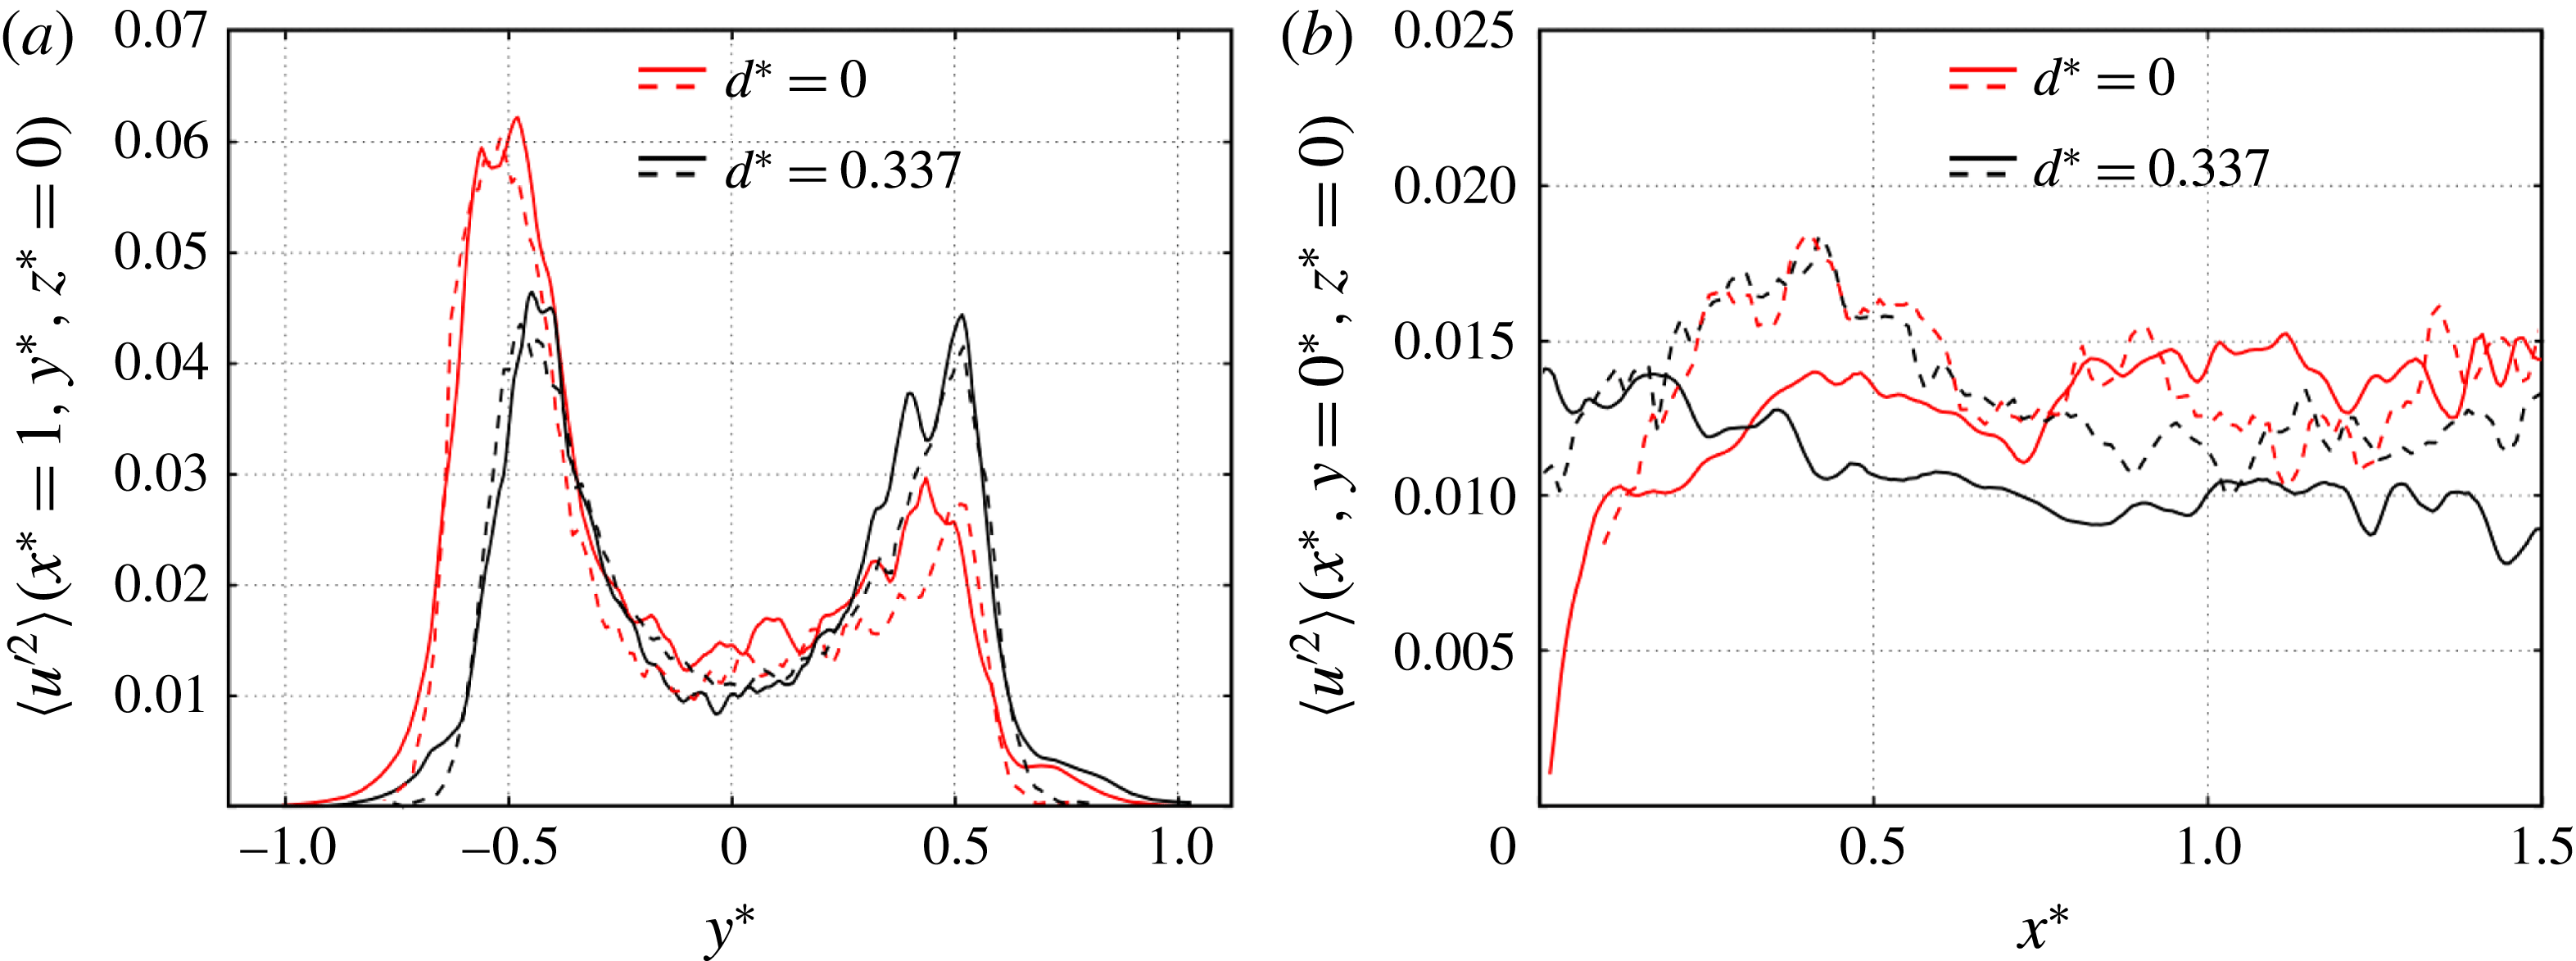
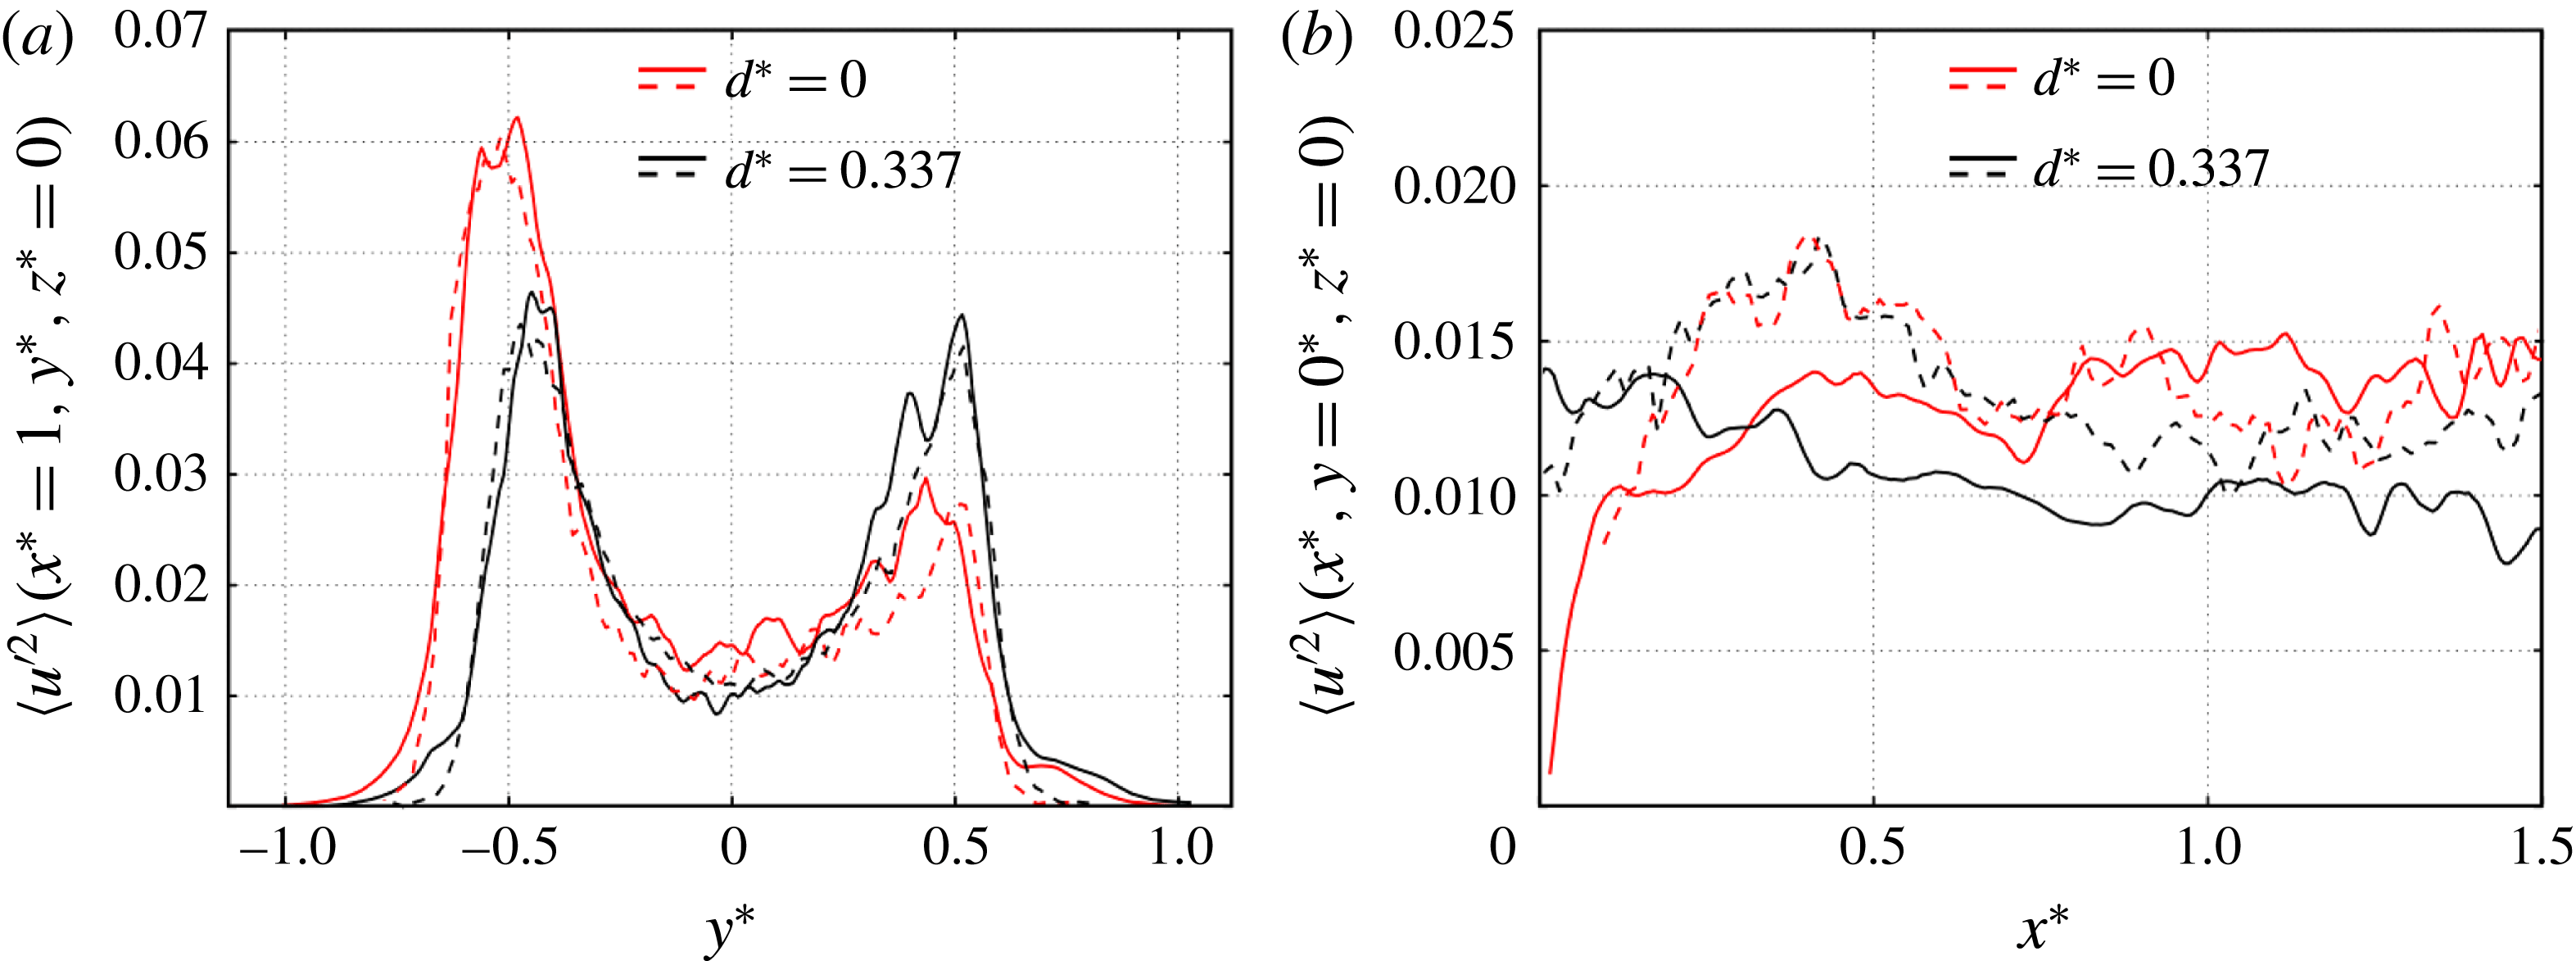
maximum for the base suction, thus the switching dynamics is not the cause for the discrepancy. On the other hand, the simulation gives an accurate estimation of the Reynolds stress magnitude
 $\langle {u^{\prime }}^{2}\rangle$
in the left and right mixing layers as shown in figure 13(a). Nevertheless, fluctuations inside the recirculating region around
 $x^{\ast }=0.4$
displayed in figure 13(b) are underestimated by the computation, and to a greater instance for the deeper cavity case. This lower fluctuating near wake might explain the difference in the mean base pressure distribution, which for the deep cavity case has a well defined high pressure region at the base centre (figure 7
c) while no organization is observable in the experimental distribution of Evrard et al. (Reference Evrard, Cadot, Herbert, Ricot, Vigneron and Délery2016). Another noticeable difference in the flow is the recirculating bubble length that, estimated from streamlines in the plane
 $y=0$
, measures
 $L^{n}/D=1.34\pm 0.03$
in the present computation against the experimental value of
 $L^{e}/D=1.49\pm 0.03$
. The bubble length reduction increases flow curvatures around the separation that is consistent with larger base suction and force coefficients. We have no definitive explanation yet to explain the discrepancies and can only evade the issue evoking the accuracy of the turbulence model to reproduce the smooth separation and reattachment around the forebody for which no experimental data are available. Indeed, the position of the primary detachment at the leading edge and the boundary layer properties after the turbulent reattachment on the lateral sides of the body might control a large part of the forebody drag as well as the afterbody flow properties. This interesting issue deserves to be investigated in the future.
Comparison of two fluctuations profiles in the wake obtained with the numerical simulation (dashed lines) and the experiment of Evrard et al. (Reference Evrard, Cadot, Herbert, Ricot, Vigneron and Délery2016) for the baseline (red) and the deep cavity (black). (a) Vertical profile taken at
 $x^{\ast }=1$
,
 $z^{\ast }=0$
; (b) horizontal profile taken at
 $y^{\ast }=0$
,
 $z^{\ast }=0$
.
4.2 Symmetry-breaking mode structure
An asymmetric turbulent mode of the Ahmed body is found in this numerical work using LES modelling at
 $Re\simeq 4\times 10^{5}$
. It is in conformity with those obtained by conditional averaging in the experiments of Grandemange et al. (Reference Grandemange, Gohlke and Cadot2013b
), Volpe et al. (Reference Volpe, Devinant and Kourta2015), Brackston et al. (Reference Brackston, Garci De La Cruz, Wynn, Rigas and Morrison2016), Evrard et al. (Reference Evrard, Cadot, Herbert, Ricot, Vigneron and Délery2016), Li et al. (Reference Li, Barros, Borée, Cadot, Noack and Cordier2016), Perry et al. (Reference Perry, Pavia and Passmore2016) and in the numerical simulation of Pasquetti & Peres (Reference Pasquetti and Peres2015). For all of these cases, the reflectional symmetry of the geometry is broken for durations much longer than the natural convective time of the flow.
One of the main characteristics of the asymmetric mode is the deformed shape of the recirculation torus evidenced using an iso-surface of pressure in figure 3(a). Its existence then excludes the possibility of a mean vortex structure connecting the interior of the recirculation and its exterior, with a part close to the base, and an open part corresponding to longitudinal vortices in the wake, as speculated by Evrard et al. (Reference Evrard, Cadot, Herbert, Ricot, Vigneron and Délery2016) or Perry et al. (Reference Perry, Pavia and Passmore2016) from partial velocity fields measurements in the wake.
The deformed torus in figure 3(a) gives insight into the origin of the base pressure distributions obtained in the experiments, the part that is the closest to the body is responsible for the region of the lowest pressure at the base (figure 7 a), while the feedback flow inside the recirculating bubble directed toward the body (figure 5 a) is responsible for the high pressure part of the base (figure 7 a).
The most steady part of the torus is that which is the closest to the base since the fluctuations therein have the lowest level (figure 10 a,d). It is quite comparable to a solid rotation (viscous eddy) since the streamlines are circular (figure 5 a) and the vorticity constant (figure 9 a). However the lowest pressure is not obtained in this coherent part (figure 8), but in the opposite part having an elliptical recirculation shape (figure 5 a).
The structure in figure 3(a) is very similar to what is observed for the axisymmetric body after the first steady bifurcation (Bury & Jardin Reference Bury and Jardin2014) and is also consistent with the laminar transition investigation of the Ahmed body by Grandemange et al. (Reference Grandemange, Gohlke and Cadot2012a ) suggesting that the turbulent asymmetric mode originates from the primary steady bifurcation of the flow.
In the near wake, unsteadiness is localized in all mixing layers around the body base and delimiting the recirculating region, but with a strong attenuation in the one at proximity to the solid rotation (figure 9
a,b). The instantaneous flow structure visualization in figure 12(a) reveals the presence of Kelvin–Helmholtz-type instabilities as well as one-sided vortex shedding loops consistent with the quasi-periodic fluctuations observed at a Strouhal number around
 $0.2$
by Grandemange et al. (Reference Grandemange, Gohlke and Cadot2013b
), Volpe et al. (Reference Volpe, Devinant and Kourta2015). This quasi-periodic dynamics is reminiscent of the second unsteady and periodic bifurcation evidenced by Grandemange et al. (Reference Grandemange, Gohlke and Cadot2012a
). The present numerical characterization is in total agreement with the speculative drawing of Grandemange et al. (Reference Grandemange, Gohlke and Cadot2013b
) aiming at describing the turbulent global modes of the Ahmed body.
4.3 On the drag reduction induced by a base cavity
A small cavity of only
 $4.7\,\%$
of the body height is able to reduce the base suction by
 $11.7\,\%$
with a consequence of
 $2.97\,\%$
in drag reduction while only little changes in the wake properties are observed. We will first discuss this case.
With the shallow cavity, the circular part of the toroidal recirculation remains unchanged, with similar velocity gradient around its centre (figure 8 e) and with an identical distance apart from the body. The only noticeable difference is consequently that the torus has entered inside the cavity on a distance equal to the cavity depth. On the other hand, if we assume that the boundaries of the recirculating bubble (figure 6) are not affected, which seems to be the case, then the recirculation sizes have increased, mainly by being elongated by entering the cavity. This effect is global if most of the torus penetrates inside the cavity which might be the reason why the base pressure distribution with the small cavity is simply uniformly increased relative to that of the base pressure distribution with no cavity (figure 7 a,b).
With the deep cavity, the toroidal recirculation has completely filled the space offered by the base cavity, resulting in wide elliptical recirculations (figure 5 c,f). Meanwhile the local pressure minima are strongly attenuated (figure 8 c), indicating that the role of the recirculations to act as sources of low pressure is considerably reduced. In addition, the large distance between the centres of the recirculation and the body base is beneficial for a low base suction because in this region the pressure rises almost linearly as indicated in figure 8(d).
In conclusion, the base suction reduction produced by a deep base cavity is intimately related to the low pressure sources created by the toroidal recirculation. A first effect of the cavity is to modify the geometrical properties of the recirculation by a significant enlargement because, (i) the back flow enters the cavity, and (ii) the recirculating bubble closure is slightly shifted further downstream. It results in a significant elongation of the recirculating flow resulting in a weakening of the flow curvature associated with a pressure increase. A second effect is the symmetrization of the toroidal recirculation indicating that the static asymmetric mode becomes unstable with a deep cavity. While the asymmetry might create additional drag compared to that of a symmetric wake, its suppression using a cavity is not the cause for the large drag reduction.
4.4 On the stabilization toward a symmetric turbulent wake with a deep base cavity
The numerical simulation reproduces the effect of symmetrization of the turbulent wake observed experimentally in Evrard et al. (Reference Evrard, Cadot, Herbert, Ricot, Vigneron and Délery2016) with a deep base cavity. This robust result might give some indications about the instability origin for the static asymmetric mode of the wake. The presence of a base cavity does not affect the separation locations nor the vortex sheets after separation. For two-dimensional bluff-body flows, it is known that base cavities (Kruiswyk & Dutton Reference Kruiswyk and Dutton1990; Molezzi & Dutton Reference Molezzi and Dutton1995; Martin-Alcantara et al. Reference Martin-Alcantara, Sanmiguel-Rojas, Gutierrez-Montes and Martinez-Bazan2014) are not associated with a strong alteration of the global Bénard von Kármán global dynamics. This specific wake feature is actually fully governed by the vortex sheets interaction (Gerrard Reference Gerrard1966) which is poorly sensitive to the presence of the body itself (Abernathy & Kronauer Reference Abernathy and Kronauer1962) and then also to an eventual base cavity. It appears that the three-dimensional bluff-body flow behaves very differently because the static symmetry-breaking mode is suppressed with the deep cavity. This suggests that the vortex sheets produced by separations might not be the only origin of the instability but also the toroidal recirculation whose characteristics are very sensitive to a base manipulation.
5 Conclusions
The computation of the flow of the flat backed Ahmed body at
 $Re\simeq 396\,000$
using an LES method confirms the presence of static asymmetric modes in the turbulent wake. Switching between the two mirror asymmetric modes as reported by experiments are not observed during the finite time of the simulation. The lack of switching can be simply explained by a too short simulation duration unless a non-trivial triggering effect induced by the experimental imperfections is implied as discussed by Sanmiguel-Rojas & Mullin (Reference Sanmiguel-Rojas and Mullin2012). The permanent lock-in on one of these mode allows a full characterization. The static turbulent global mode exhibits in the near wake a toroidal recirculation associated with a skewed low pressure torus. The global dynamics of one-sided vortex shedding loops is also observed. The base cavity effect obtained experimentally is satisfactorily retrieved and the drag reduction mechanism interpreted by the attenuation of the low pressure sources inside the toroidal recirculation. The stabilization of the static asymmetric wake with a deep cavity suggests higher sensitivity of this mode to disturbances inside the recirculating bubble than in the outer vortex layers coming from the separations at the base periphery. This last result should be tested to improve the efficiency of actuator design targeting a symmetric wake for the squareback Ahmed body (Brackston et al.
Reference Brackston, Garci De La Cruz, Wynn, Rigas and Morrison2016; Li et al.
Reference Li, Barros, Borée, Cadot, Noack and Cordier2016; Evstafyeva et al.
Reference Evstafyeva, Morgans and Dalla Longa2017).
Acknowledgements
The authors would like to thank R. D. Brackston for the critical reading of the manuscript, D. Ricot for his inputs on the numerical set-up in LaBS and G. Bonnavion for discussions about the cavity effect. This work was funded by the CNRT-R2A (National Centre for Technologic Research on Aerodynamics and Aeroacoustics of ground vehicles) organization. Computations have been performed on the supercomputer facilities SPIN Calcul of Poitiers.