Implantable medical devices (IMDs) encompass a wide range of products used for very varied purposes in health care, and expansion of new technologies in recent decades has contributed to their development. However, despite this increasing use, high-quality clinical information on IMDs remains scanty. Less stringent approval system is cited as the main explanation for the limited number of clinical trials conducted on IMDs compared with drugs (Reference Cohen and Billingsley1;Reference Curfman and Redberg2). Nevertheless, to improve IMD assessment, specific issues regarding their evaluation have to be considered (Reference Sedrakyan, Marinac-Dabic, Normand, Mushlin and Gross3). One of the most challenging is related to their process of development. Indeed, unlike new drugs, most IMDs are frequently updated by successive introductions of technical changes. Decision makers are thus often faced with a series of clinical trials based on successive IMD versions. Moreover, each trial is usually based on small samples. The question that may arise for the decision maker, whether working at the bedside or at the policy level, is how to use these data when evaluating the latest version of an IMD. Thus, one may wish to combine all of this information into an internally consistent set of estimates while respecting the sequential process in the evidence on improving the quality of IMD assessments.
To explicitly combine all of the trial results, a meta-analysis could be proposed. Because the Bayesian framework provides a flexible approach toward evidence aggregation and can considerably alleviate the interpretation of its statistical conclusions, Bayesian meta-analysis approaches appeared well-suited to analyze IMD trial data. Indeed, they allow explicit incorporation of all of the pertinent information that is available on a medical technology outside of a trial which would otherwise be excluded (Reference Sutton and Abrams4). However, they are still underused in the assessment of IMDs, with only five Bayesian meta-analyses published before 2010; none of them took into account the IMD version (Reference Pibouleau and ChevretFootnote 5).
Actually, several statistical issues arise when performing a meta-analysis of IMD trials based on different IMD versions. Although random-effects models account for variability to some extent, they do not distinguish between the distinct sources of heterogeneity. In this setting, Bayesian hierarchical models (Reference Sutton and Abrams4;Reference McCarron, Pullenayegum, Thabane, Goeree and Tarride6;Reference Prevost, Abrams and Jones7) appear useful. They allow modeling explicitly the heterogeneity between IMD versions, in addition to the heterogeneity between individual studies of similar versions. Moreover, they allow assessing the performance of the latest version of the IMD, whereas most of the available information comes from studies conducted on previous versions of the device. Thus, in case of a version effect, these models seem especially appropriate.
The aim of this study was to propose a Bayesian three-level hierarchical meta-analysis model for IMD evaluation. A simulation study was performed to assess and compare the performance of this model with a standard random-effects model. Practical use of these methods was illustrated in the evaluation of an intracranial stent used in the treatment of wide-necked aneurysms.
METHODS
Illustrative Example
Intracranial stents are used in the treatment of wide-necked aneurysms in association with embolic coil implants. These devices share most of the characteristics that make IMD evaluation difficult. There is notably a small population to be treated and innovation proceeds by incremental steps. Among the intracranial stents that are currently available, the NEUROFORM stent was chosen as the working example because most of the published clinical data concern this stent with 3 versions developed in 5 years.
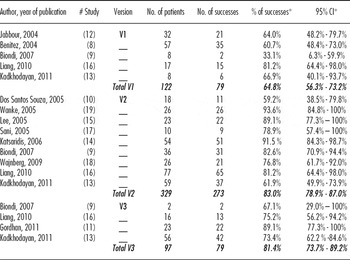
A systematic literature search of PubMed on March 27, 2012, using the search term “NEUROFORM” and limited to clinical trials, generated 137 articles. Twenty-three of them (17 percent) were found to be relevant based on the title, abstract, and final complete retrieval of the article. The main outcome measure was the success of the stenting procedure, defined as the placement of the stent in the target artery and an aneurysm occlusion ≥ 95 percent on the immediate post-procedural angiography. Only trials with information on IMD version were finally selected. Authors were asked for this information if not mentioned in the publication. Final selection included twelve trials (Reference Benitez, Silva, Klem, Veznedaroglu and Rosenwasser8–Reference Wanke, Doerfler and Goericke19) reporting eighteen independent evaluations of the success rates of three different NEUROFORM versions: five trials on version 1, nine trials on version 2, and four trials on version 3. Observed prevalences of clinical success in these trials are summarized in Table 1. For trials with sample sizes less than 100, point estimates and 95 percent confidence intervals were calculated using the adjusted Wald method (Reference Agresti and Coull20). Heterogeneity in success rates across trials was assessed using the I2 index (Reference Higgins and Thompson21) that was found equal to 69, that is, that 69 percent of the total variability among success rates may be explained by true heterogeneity between trials. To assess the potential version effect of the IMD in this setting, we decided to use and compare two Bayesian meta-analysis models.
NEUROFORM Data: Estimated Prevalence of Success for Each Study According to Each IMD Version

*For sample sizes less than 100, point estimates and 95% confidence intervals were calculated using the adjusted Wald method.
IMD, implantable medical device; CI, confidence interval.
Meta-analysis Model Specification
As illustrated in the example of intracranial stents, data on IMDs often come from non-comparative studies, and the parameter of interest is the probability of a dichotomous outcome. Thus, we considered a set of single-group trials that aim at assessing some IMDs; these trials involved K different versions, using a binary outcome measure.
The models were specified in BUGS code as reported in the Supplementary Table 1, which can be viewed online at www.journals.cambridge.org/thc2013081.
Random-Effects Meta-analysis
Let pj, denote the proportion of success in the jth single-group study, j = 1, . . ., J.
The random-effects meta-analysis involves inferences on the distribution of the study-specific effects pj across studies on the logit scale. A standard assumption is that this distribution is a parsimonious parametric distribution with mean μ that represents the underlying mean effect of the IMD, and variance σ2, the between-study variability, that is, the heterogeneity of IMD effects across trials:
 $
\begin{equation}
\begin{array}{lr}
{\rm y}_{\rm j} \sim Binomial\,({\rm p}_{\rm j} ,{\rm n}_{\rm j} ) & \\
{\rm logit}({\rm p}_{\rm j} ) = \mu + \sigma \,{\rm z}_{\rm j} & {\rm z}_{\rm j} \sim N(0,1) \\
\sigma \sim logN(0,1) & \mu \sim N(0,10^6 ) \\
\end{array}
\end{equation}
$
Hierarchical Meta-analysis
Given the technical differences between the IMD versions, the underlying assumption of a common mean effect may be violated, and should be evaluated. A three-level hierarchical model was thus proposed to fit usual data on IMDs, with the trials’ results nested within the IMD version. The three levels allow for inferences to be made at the study, study version, and population levels.
Let k ( = 1, . . ., K) denote the IMD version, and nkj be the number of patients in the jth study of version k. Each study's success probability pkj is considered to have been selected from a population specific to the IMD version. This three-level hierarchical model can be expressed as follows:
 $
\begin{eqnarray}
&& {\rm y}_{{\rm kj}} \sim Binomial\,({\rm p}_{{\rm kj}} ,{\rm n}_{{\rm kj}} ) \nonumber\\
&& {\rm logit}({\rm p}_{{\rm kj}} ) = \theta _{\rm k} + \sigma\,{\rm z}_{{\rm kj}} \sim N(0,1) \\
&& \theta _{\rm k} = \mu + \nu \,\varepsilon _{\rm k} \quad \qquad \varepsilon _{\rm k} \sim N(0,1) \nonumber\\
&& \sigma \sim logN(0,1)\quad\ \quad \nu \sim logN(0,1)\quad \quad \mu \sim N{\rm }(0,10^6 ) \nonumber
\end{eqnarray}
$
Simulation Study
We conducted a simulation study to examine the behavior of the two models described above. The simulation setting was chosen to mimic situations often met in IMD assessment, that is, each IMD version evaluated from a few studies with small samples of patients.
We considered K = 3 versions of an IMD, each version evaluated in Nk = 2 uncontrolled studies of sample size nk; k = 1, . . ., K. This scenario results in a series of ∑Nk independent studies with an overall sample size of n = ∑ nk Nk. For simplicity, we assumed that all of the patients in one study shared the same version of the IMD, with no missing data on either the IMD version or the outcome. Success rates were drawn from a binomial distribution (Pk, nk), with Pk the success rate of version k. Seven scenarios were considered, which differed according to the version effect (Table 2). We assessed the impact of the quantity of information available for each IMD version by setting the sample sizes of the two trials of each IMD version either similar (n1 = n2 = n3 = 100) or varying (n1 = 50, 60, n2 = 100, 125, 180, n3 = 60, 125, 150), accounting for a total of n = 600 patients overall.
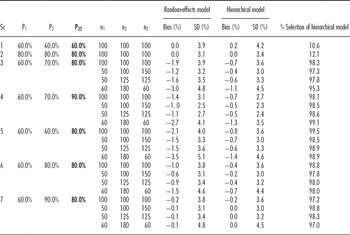
Bias and Standard Deviation (SD) of the Estimated Mean Success Rate in the Last Trial, p32, and Percentage of Selection of the Bayesian Three-Level Hierarchical Model, i.e., Percentage of Simulation Replicates for Which the DIC from the Hierarchical Model Was Decreased as Compared to That from the Random-Effects Model

Note. Sc: scenario; Pk (k = 1, 2, 3): underlying success rate of version k; nk: sample size of the two trials on version k. Priors used: N(0,106) for μ, logN(0,1) for σ and ν.
DIC, Deviance Information Criterion.
Markov Chain Monte Carlo (MCMC) simulations of posterior distributions were performed with the OpenBUGS software using the R environment and its BRugs package as the interface (http://www.mrc-bsu.cam.ac.uk/bugs/). For each simulated dataset, burn-in periods of 5,000 and a subsequent chain of 15,000 MCMC iterates based on the convergence speed and the magnitude of the dataset were used. We first used the priors described above. Then, as recommended in Bayes inference (Reference Spiegelhalter, Abrams and Myles23), sensitivity analyses to the choice of the priors were performed. The influence of the prior for μ was tested by considering both skeptical N(0, 1) and enthusiastic N(1.4, 1) priors, that is, priors centered on either a low (50 percent) or a high success rate (80 percent). Based on the assumptions previously made about the range of the standard deviations, four other priors were considered for σ and ν, namely a standard normal distribution truncated below zero, a log-normal distribution logN(1,1), and two uniform distributions U[0,2.5] and U[0,5], that achieve different shapes and variability scales. A Student t distribution with 5 degrees of freedom, for z and ɛ, was also used, because it has been suggested when the number of studies is small (Reference Smith, Spiegelhalter and Thomas22;Reference Spiegelhalter, Abrams and Myles23).
For both models and in each situation, we computed the posterior mean estimates of the success rate of the last trial p32 and the Deviance Information Criterion (DIC), as follows:
 $
\begin{equation}
{\rm DIC} = {\rm \bar D} + {\rm p}_{\rm D}
\end{equation}
$
We ran N = 1,000 independent replicates of each scenario, and we estimated the resulting bias and standard deviation of the success rates, as well as DIC, while the probability of selecting the hierarchical model was estimated by observed frequencies over the N simulations where DIC was lower than that reached by fitting the random-effect model.
Analysis was performed using R 2.10.1 (http://www.R-project.org).
RESULTS
Simulation Study
The model comparison is reported in Table 2. When there was no heterogeneity in the version effect (scenarios 1 and 2), the random-effects model exhibited smaller DICs than the hierarchical model, regardless of the true underlying success rate (60 percent or 80 percent, respectively). As soon as there was a version effect (scenarios 3–7), hierarchical models allowed better DICs compared with random-effects models in at least 95 percent of the cases. Moreover, estimation of the success rate in the last trial was always less biased with hierarchical models (Table 2) with a maximum bias of 1.4 percent.
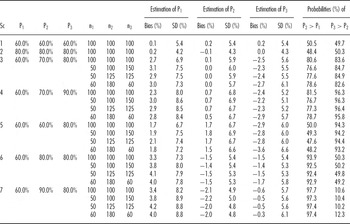
Success rates per IMD version were estimated with the hierarchical model with a bias always below 5 percent (Table 3). The highest biases in estimated posterior mean of success rates were observed when the two following conditions were met: i) true success rate of the considered version highly different (>20 percent) from that of the other versions (version 3 in scenario 5 and version 1 in scenarios 6 and 7), and ii) little information available on the considered IMD version (version 1 in scenarios 6 and 7). Posterior probability that the success rate of the new version was higher than that of the previous version was approximately 50 percent when there was no difference in success rates and between 77.3 percent and 97.7 percent when there was a version effect (Table 3). As expected, this probability increased with the magnitude of the version effect and the quantity of information on that version.
Bias and Standard Deviation (SD) of the Estimated Success Rate for Each IMD Version Using the Bayesian Three-Level Hierarchical Model

Note. Sc: scenario; Pk (k = 1, 2, 3): underlying success rate of version k; nk: sample size of the two trials on version k; Priors used: N(0,106) for μ, logN(0,1) for σ and ν.
IMD, implantable medical device.
Modifying the prior for the mean effect, μ and for the between-study and between-version standard deviations, σ and ν did not affect the results. Whatever the prior used for σ and ν, the ability of the hierarchical model to detect a change in success rate between the latest version and the previous one when this change exists, was close whatever the scenarios, and always above 80 percent (Supplementary Table 2, which can be viewed online at www.journals.cambridge.org/thc2013082). Implementing the same models with a Student t distribution with 5 degrees of freedom for random effects yielded similar results.
Illustrative Example
The above models were applied to the NEUROFORM stent complete data (Table 1), using the MCMC approach described above. In addition to DIC and posterior means, we also reported 95 percent credible intervals for each success rate.
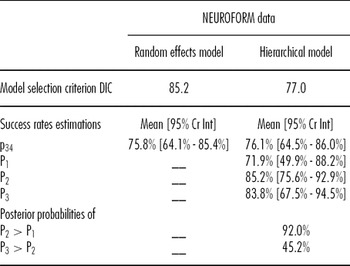
Using the hierarchical meta-analysis model, the DIC was decreased as compared to that obtained with the random-effects model (77.0 versus 85.2, respectively), suggesting some version effect of the IMD. This was illustrated by the various estimations of the success rates for each NEUROFORM version provided by the hierarchical model, that is, 71.9 percent for version 1, 85.2 percent for version 2, and 83.8 percent for version 3 (Table 4). This suggests an improvement of version 2 over version 1, with a posterior probability that the success rate of version 2 was higher than that of version 1 of 92.0 percent, while no improvement of version 3 appeared as compared to version 2; actually, the posterior probability that the success rate of version 3 was higher than that of version 2 was 45.2 percent. The choice of the prior used either for the mean effect, μ or for the standard deviations, σ and ν, did not affect these results (Supplementary Table 3, which can be viewed online at www.journals.cambridge.org/thc2013083). Actually, whatever the priors for σ and ν, the posterior probability that the success rate of version 3 was above that of version 2 ranged between 44.7 percent and 47.0 percent, suggesting the absence of benefit of the latest version over the former.
Results of the Meta-analysis Conducted on the NEUROFORM Data: Model Selection Criterion (DIC), Estimations of the Posterior Mean Success Rates in the Last Trial, p34 and for Each IMD Version P1, P2, P3, and Posterior Probabilities That the Next Version Had a Better Success Rate Than the Previous One

Note. 95% Cr Int: 95% credible interval. Priors used: N(0,106) for μ, logN(0,1) for σ and ν.
DIC, Deviance Information Criterion; IMD, implantable medical device.
DISCUSSION
This study addressed the benefits and the limitations of conducting Bayesian meta-analyses of IMD trials using published results to show that the Bayesian approach may be useful to policy makers in that setting. We considered the situation where a new IMD version is to be evaluated with most information achieved on earlier versions.
To model study-to-study heterogeneity explicitly, we thus proposed to fit three-level Bayesian hierarchical meta-analysis. Such hierarchical models, although still not widely used, have been previously proposed to model the heterogeneity of between-study types, in addition to the heterogeneity of between-individual studies of similar design (6;Reference Prevost, Abrams and Jones7). This was compared with a Bayesian standard random-effects model on the basis of a simulation study.
Actually, the Bayesian hierarchical model provides helpful information to the decision maker, which is particularly adapted to the IMD evaluation process. First, the estimation of the success rate for new versions can borrow strengths from the behavior of early versions, in the scope of meta-analysis models. Second, the DIC criterion appears helpful for model selection in identifying cases where there is a version effect. In our simulation study, it allowed distinguishing the situations where there was a true version effect in almost 95 percent of the cases, with precise estimates of the success rate per IMD version. Moreover, and specifically to that model as compared to the random-effect model, the potential improvement of the new version can be quantified throughout probabilities, for instance that the latest version had a higher success rate than the previous one. This was illustrated in the NEUROFORM example, where there was a 92 percent posterior probability that the success rate of version 2 was above that of version 1, but less than a one-half chance that the version 3 was more effective that version 2. Third, the use of such a Bayesian approach is particularly adapted to the sequential accumulation of the IMD data on its successive versions. Indeed, it could be applied sequentially as the new trial results become available to the decision maker rather than performed once all data are available as in the NEUROFORM example. Such sequential information may be useful in the decision process, for instance in the reimbursement of the new version of an IMD, when data documenting the clinical impact of its technical change are scarce and non-comparative.
Some limitations of the proposed approach could be noted. Because new versions are intended to be “better” than the old ones, there is concern that the estimate of its improvement is not too heavily affected by the data accumulated so far on previous versions. However, as reported in our simulation study where the new version was more effective than the older ones (see scenarios 3, 4, and 5), the heterogeneity in version effect was detected in almost 95 percent of the cases (Table 2), even when the sample sizes were asymmetric with more data accumulated on the past inefficient versions. Another important issue of Bayes inference is the sensitivity of the posterior estimates to the model assumptions, notably the assumed hierarchical structure of the random effects and prior distributions. The choice of prior distributions for between-study variability σ and between-version variability ν could have substantial effects on the results of the analyses, especially when there is limited information in the likelihood to provide a precise estimate for σ and ν because of the small number of versions and/or the few trials on each version (Reference Spiegelhalter, Abrams and Myles23). However, in this study, the analysis conducted to assess the influence of prior distributions showed that both random-effects and hierarchical models experienced little sensitivity to the prior specification of μ, σ, and ν. This was similarly observed on the NEUROFORM data example. Of note, we used non-informative priors, although prior derived from expert belief could be otherwise used, as proposed by Youn et al. (Reference Youn, Lord and Hemming24). This could allow reflecting somehow asymmetry in the different versions.
Other approaches could appear interesting in some specific settings. First, when there are a substantial number of studies, between-study heterogeneity could be explored by adding study-level covariates. The multivariate random-effects model that allows the trial effects to vary from one trial to the next could be another approach to explicitly model the heterogeneity across trials (Reference Spiegelhalter, Best, Carlin and Van der Linde25). Finally and as stated above, it might be interesting to apply this meta-analysis approach sequentially, once results on each version become available. By contrast, traditional cumulative meta-analysis approach based on sequential random-effects meta-analysis failed to detect any version effect (data not shown).
CONCLUSIONS
In the IMD assessment where several versions of the IMD were evaluated, we propose to compare fitting Bayesian random-effects model and the three-level hierarchical model based on DIC to detect potential version effects. The three-level hierarchical meta-analysis model appears helpful to decision makers by providing precise estimates of the success rates of the latest version of IMD and by addressing the probability that the success rate of the latest version was greater than that of the previous one. Finally, it should be kept in mind that the proposed method cannot compensate for the lack of sound clinical data. Further work should include consideration of smaller version effects and integration of expert belief as prior information in the model.
SUPPLEMENTARY MATERIAL
Supplementary Table 1: www.journals.cambridge.org/thc2013081
Supplementary Table 2: www.journals.cambridge.org/thc2013082
Supplementary Table 3: www.journals.cambridge.org/thc2013083
CONTACT INFORMATION
Leslie Pibouleau, MSc, (leslie.pibouleau@univ-paris-diderot.fr), Service de Biostatistique et Information Médicale, Hôpital Saint-Louis, 1 avenue Claude Vellefaux, 75475 Paris cedex 10, France
Sylvie Chevret, MD, PhD, Professor of Public Health, Service de Biostatistique et Information Médicale, Hôpital Saint-Louis, Paris, France
CONFLICTS OF INTEREST
All authors report they have no potential conflicts of interest.