Introduction
Energy storage became an essential requirement in modern electric vehicle systems, portable electronic gadgetry, solar and wind farms, etc. There are several energy storage systems (batteries) available at different sizes and capacities; however, lithium-ion battery (LIB) has been proven to be the most promising candidate because of its several qualities such as high efficiency, high energy density, limited self-discharge, and longer life cycle even with high charging and discharging rates [Reference Omar, Daowd, van den Bossche, Hegazy, Smekens, Coosemans and van Mierlo1, Reference Lukic, Cao, Bansal, Rodriguez and Emadi2, Reference Saw, Ye and Tay3], which are important modern battery design parameters. Silicon has a very high charge capacity (4200 mA h/g) theoretically, and it can be a promising replacement for the commercially used graphite electrodes, whose charge capacity (372 mA h/g) is roughly ten times smaller than silicon. It further has a low discharge potential and attractive operating voltage [Reference Chan, Peng, Liu, McIlwrath, Zhang, Huggins and Cui4, Reference Li, Xu, Li, Yin, Wan and Guo5]. Along with these benefits, silicon also has a disadvantage, high volumetric expansion (300%) on lithiation [Reference Lee, Lee, Chung, Lee, Lee and Baik6], leading to high stress, cracking, palletization, and delamination from the current collector, ultimately leading to electrode failure [Reference Li, Xu, Li, Yin, Wan and Guo5, Reference Beaulieu, Eberman, Turner, Krause and Dahn7]. This is the main reason why silicon is still in the laboratory and not in commercial battery electrodes. Nanostructuring of silicon was proven to be effective in relaxing the high strain due to expansion and increase the surface area available for the chemical reaction [Reference Bruce, Scrosati and Tarascon8, Reference Park, Kim, Joo, Kim, Kim, Ahn, Cui and Cho9]. Silicon nanostructures were proved to be better than their bulk counter parts in capacity retention [Reference Lee, McDowell, Berla, Nix and Cui10, Reference Liu, Zhong, Huang, Mao, Zhu and Huang11, Reference Ryu, Choi, Cui and Nix12]. Different nanostructures such as nanoparticles, nanospheres, nanowires, nanotubes, and nanocones were experimentally proved to exhibit better cycling life and performance as LIB electrodes [Reference Chan, Peng, Liu, McIlwrath, Zhang, Huggins and Cui4, Reference Park, Kim, Joo, Kim, Kim, Ahn, Cui and Cho9, Reference Liu, Zhong, Huang, Mao, Zhu and Huang11, Reference Ryu, Choi, Cui and Nix12, Reference Shelke, Gullapalli, Kalaga, Rodrigues, Devarapalli, Vajtai and Ajayan13, Reference Zhou, Yin, Wan and Guo14, Reference Ma, Yu, Li, Zhang, Cheng, Zhu and Qiu15, Reference Ma, Cheng, Chen, Zhao, Li, Tao and Liang16, Reference Kennedy, Brandon and Ryan17, Reference Shim, Woo and Hyun18, Reference Zhang, Du, Lin, Jiang, Liu, Wu and Weng19, Reference Yang, Huang, Huang, Fan, Liang, Liu, Chen, Huang, Li and Zhu20, Reference Liu, Zheng, Zhong, Huang, Karki, Zhang, Liu, Kushima, Liang and Wang21].
In the present study, silicon nanowires (SiNWs) of uniform crystallographic orientation 〈100〉, made of metal-assisted chemical etching (MACE) process, were used [Reference Chang, Chuang, Boles, Ross and Thompson22, Reference Choi, Liew, Dawood, Smith, Thompson and Hong23]. SiNWs (and silicon nanospheres) have been widely studied because of simple geometry, leading to 1D or 2D kinetics and mechanics modeling. Crystalline SiNWs and nanospheres on progressive lithiation form a core shell structure [Reference Zhao, Pharr, Wan, Wang, Kaxiras, Vlassak and Suo24, Reference Huang, Fan, Li, Zhang and Zhu25], where the outer shell transforms from crystalline silicon (c-Si) to amorphous lithiated silicon (LixSi) upon reaction with Li metal ions and the inner crystalline core remains same. The boundary between the crystalline core and the lithiated silicon shell is characterized by a sharp lithiation reaction front [Reference Huang, Fan, Li, Zhang and Zhu25]. These phase transformations and associated volumetric expansion of the lithiated phase give rise to mechanical stress in the nanowires. Based on these observations, several chemomechanical models, commonly known as “core–shell” lithiation models were developed to address the stress and fracture of the silicon nanoparticles/spheres [Reference Zhao, Pharr, Wan, Wang, Kaxiras, Vlassak and Suo24, Reference Huang, Fan, Li, Zhang and Zhu25, Reference Chen, Fan, Hong, Chen, Ji, Zhang, Zhu and Chen26, Reference Zuo and Zhao27] and SiNWs [Reference Yang, Fan, Liang, Guo, Zhu and Zhang28]. Studies were also performed to model the stress in the SiNWs, when constrained [Reference Lee, Lee, Ryu, Nix, Gao and Cui29]. All these models are based on SEM/TEM observations of the lithiation process and lithiated silicon particles/wires.
In this article, direct in situ stress measurement was performed using synchrotron X-ray microdiffraction as explained in the following sections. Compared to our recent earlier reports [Reference Tippabhotla, Radchenko, Stan, Tamura and Budiman30, Reference Ali, Tippabhotla, Radchenko, Al-Obeidi, Stan, Tamura and Budiman31], the present work reported an enhanced stress study detailing the complete stress states (the deviatoric tensor components) and their evolution during the in situ electrochemical lithiation experiments. Synchrotron X-ray microdiffraction (µSXRD) has been proven to be effective for revealing insights of mechanical stress states and other mechanics considerations (such as plasticity, mechanisms preceding fracture events, or final catastrophic failure) in small-scale crystalline structures in many important technological applications, such as microelectronics [Reference Budiman, Nix, Tamura, Valek, Gadre, Maiz, Spolenak and Patel32, Reference Budiman, Hau-Riege, Baek, Lor, Huang, Kim, Neubauer, Pak, Besser and Nix33, Reference Budiman, Besser, Hau-Riege, Marathe, Joo, Tamura, Patel and Nix34, Reference Budiman, Shin, Kim, Hwang, Son, Suh, Chung, Byun, Tamura and Kunz35, Reference Kim, Kim, Hwang, Budiman, Son, Byun, Tamura, Kunz, Kim and Joo36, Reference Radchenko, Tippabhotla, Tamura and Budiman37], nanotechnology [Reference Budiman, Lee, Burek, Jang, Han, Tamura, Kunz, Greer and Tsui38, Reference Budiman, Han, Li, Wei, Dickerson, Tamura, Kunz and Misra39, Reference Kim, Budiman, Baldwin, Mara, Misra and Han40, Reference Budiman, Narayanan, Li, Wang, Tamura, Kunz and Misra41], and photovoltaics [Reference Radchenko, Tippabhotla, Tamura and Budiman37, Reference Budiman, Illya, Handara, Caldwell, Bonelli, Kunz, Tamura and Verstraeten42, Reference Tippabhotla, Radchenko, Song, Illya, Handara, Kunz, Tamura, Tay and Budiman43, Reference Handara, Radchenko, Tippabhotla, Narayanan, Illya, Kunz, Tamura and Budiman44].
Results and discussion
As explained in the section “Synchrotron X-ray microdiffraction experiment and stress states in SiNWs”, the location of the root (base) and tip of the SiNWs is identified by line scanning process. The energy scan intensities of the diffraction plane  $\left( {\bar{3}\bar{1}5} \right)$, at the root and tip of the nanowires before battery assembly, was plotted in Fig. 1. The intensity of the SiNWs at the root is several orders high compared to the tip of the NWs. The respective diffraction peak images (at max. intensity) in Fig. 1 also show that the peak at the root is very bright and round because of high diffraction volume (influence from the bulk silicon below the root). The peak at the tip of SiNWs is dim and line shaped because of low diffraction volume (due to gaps between SiNWs). This observation is crucial to ensure a proper µSXRD scan of SiNWs during the in situ battery cycling process. Besides, it also gives the stress state in the pristine SiNWs before the battery cell assembly.
Energy scan intensity plot of diffracting plane  $\left( {\bar{3}\bar{1}5} \right)$ from the root and tip of pristine SiNWs before battery cell assembly. Respective diffraction peaks at the maximum intensity were also shown. Note: The intensity axis is in log scale.

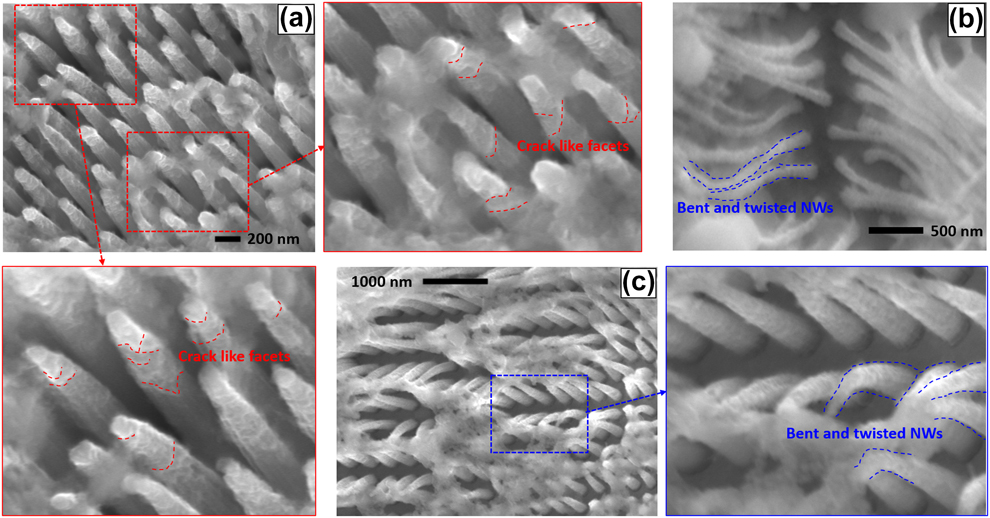
The SEM image of the partially lithiated SiNW sample (after washing in fresh electrolyte solution and acetonitrile) is shown in Fig. 2(a) below. The crystalline cores of the SiNWs are conical in shape, in line with the morphological study presented in our earlier report [Reference Ali, Tippabhotla, Radchenko, Al-Obeidi, Stan, Tamura and Budiman31] and by Yang et al. [Reference Yang, Fan, Liang, Guo, Zhu and Zhang28]. The conical shape of the crystalline cores is due to the nonuniform lithiation along the length of the nanowires, reducing from the tip to the root [Reference Yang, Fan, Liang, Guo, Zhu and Zhang28]. The zoomed-in images of Fig. 2(a) show crack-like facets (marked with red dotted lines) on the surface of the conical SiNW cores, especially near the tips. Figures 2(b) and 2(c) show bent and twisted SiNWs on lithiation. These observations from the SEM images in Fig. 2 could possibly indicate a complex 3-dimensional stress state.
SEM image of the lithiated SiNWs, (a) showing crystalline cores in conical shape. Zoomed-in images show crack-like facets on the conical surface of the NWs near tips. Almost every NW have them but only a few were marked for brevity. (b) and (c)—Bent and twisted SiNWs after lithiation.

Figure 3(a) shows stress evolution in the SiNWs during lithiation process, starting from the pristine state, calculated from the energy scan data as explained in the section “Synchrotron X-ray microdiffraction experiment and stress states in SiNWs”. The stress in the pristine nanowires is ∼40 MPa (tensile), and as the lithiation progressed, it turned compressive with magnitude between 250 and 350 MPa in different diffracting planes. This is in general consistent with the widely accepted core–shell lithiation models [Reference Zhao, Pharr, Wan, Wang, Kaxiras, Vlassak and Suo24, Reference Huang, Fan, Li, Zhang and Zhu25, Reference Chen, Fan, Hong, Chen, Ji, Zhang, Zhu and Chen26, Reference Zuo and Zhao27]. However, the magnitudes of the measured stress during lithiation is lower than that predicted by those models. Unlike those models, the magnitude of the stress almost remained constant during lithiation. These anomalies are because of averaging, as shown in the Fig. 4. The stress state in the lithiated SiNW cores is longitudinally varying with high stress near the tip and low stress toward the root. In such a scenario, averaging of stress leads to a lower magnitude. Further, owing to the loss of crystallinity, on progressive lithiation near the tip of the crystalline core, the average stress magnitude remained nearly constant.
(a) Stress evolution in the SiNWs during lithiation process from pristine state, evaluated from the energy scan. (b) Energy scan intensity variation plot of diffracting plane  $\left( {\bar{5}\bar{1}7} \right)$ at Loc-1 with the diffraction peak images at the maximum intensity. (c) Energy scan intensity variation plot of diffracting plane
 $\left( {\bar{4}\bar{2}6} \right)$ at Loc-1 with the diffraction peak images at the maximum intensity.

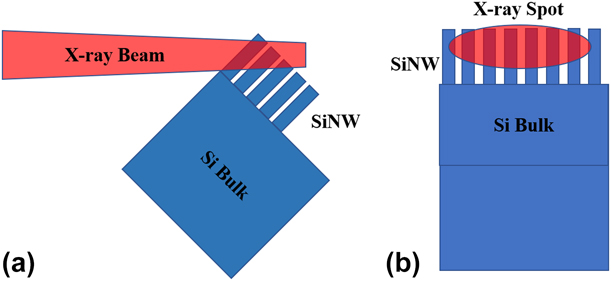
Schematic closeup of the monochromatic X-ray beam focused on the SiNWs: (a) side view and (b) front view; the size of the X-ray spot is ∼10 × 2 µm. The diffracting volume consists of several nanowires of different lengths, leading to averaging of measured parameters.

The intensity variation of the diffraction peaks from the crystal planes  $\left( {\bar{5}\bar{1}7} \right)$ and
 $\left( {\bar{4}\bar{2}6} \right)$ over the energy scan range was shown in Figs. 3(b) and 3(c), respectively. Although the low intensity, at the end of lithiation, indicates reduction in the diffraction volume (crystallinity) on lithiation, the broadened and distorted intensities indicate high stress variation and crystal rotations in the diffracting volume. This is because, in a diffraction volume with no (or uniform) stress, the Bragg’s condition is satisfied at a given energy (wavelength), giving a sharp intensity peak at a single energy (E) value, as given by Eq. (1) below.
 $$\lambda = {{hc} \over E} = 2d\;\sin \;\theta \quad .$$
But in the case of a diffraction volume that comprises of multiple stress states (different ‘d’ spacing values) and crystal rotations (different ‘θ’ values), the intensity peak is broadened, comprising a range of energy (E) values, where Bragg’s condition is satisfied. This observation is in line with the finite element simulations performed by Yang et al. [Reference Yang, Fan, Liang, Guo, Zhu and Zhang28], considering nonuniform lithium-ion diffusivities with respect to the crystal orientation, leading to a nonuniform lithiation around the circumference of the SiNWs. They further showed that such a circumferentially nonuniform lithiation causes multiple stress states, both tensile and compressive within the crystalline core at any given cross-section along the length of the SiNWs. This is in addition to the longitudinal stress variation due to conical lithiation discussed earlier. Hence, the crystalline cores of the lithiated SiNWs contain multiple stresses at different points, a triaxial stress state leading to high shear stresses. The crack-like facets and distortions near the tips of the crystalline cores seen in the SEM images in Fig. 2 indicate such nonuniform lithiation and, thus, a triaxial stress state.
The polychromatic diffraction (Laue) patterns near the tip of the SiNWs [Loc-1 in Fig. 3(a)], before battery assembly and during lithiation, were analyzed using XMAS [Reference Tamura48]. Figure 5(a) shows the Laue pattern image of the pristine SiNW sample before battery assembly. Similarly, Figs. 5(b) and 5(c) show the Laue patterns of lithiated SiNWs at 1.2 V and 0.65 V, respectively. Corresponding indexed Laue patterns were shown in Figs. 5(d)–5(f). In general, the Laue patterns generated by bulk monocrystalline silicon are characterized by bright and regular shaped peaks as shown in Ref. [Reference Tippabhotla, Radchenko, Song, Illya, Handara, Kunz, Tamura, Tay and Budiman43]. In the case of SiNWs, the peaks are dim and odd shaped, making indexing a tough job. Such circumstances made “special indexation” of the Laue pattern, an inevitable necessity, where we combined the automatic peak search routine with manual addition and removal of the peaks before indexation [Reference Tamura48]. The unindexed bright peaks in the case of pristine SiNWs [Fig. 5(d)] are from the surrounding metals on the sample stage of the beamline.
Laue diffraction patterns (before indexing) of (a) pristine SiNWs, before battery assembly, (b) lithiated SiNWs at 1.2 V, (c) lithiated SiNWs at 0.65 V (zoomed-in images of the diffraction peaks of  $\left( {\bar{3}\bar{1}5} \right)$ and
 $\left( {\bar{4}\bar{2}6} \right)$ in the insets). Indexed Laue diffraction patterns of (d) pristine SiNWs, before battery assembly, (e) lithiated SiNWs at 1.2 V, and (f) lithiated SiNWs at 0.65 V. Note: The unindexed bright peaks in (d) are from the metals present in the sample stage.

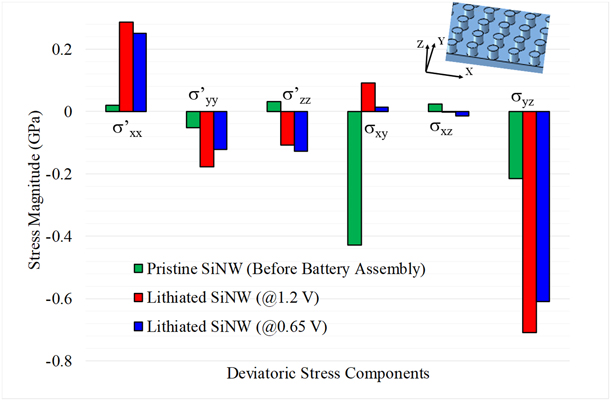
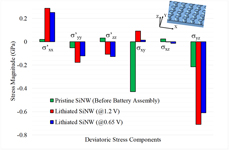
The deviatoric stress tensor, which consists of the deviatoric components of the directional stresses and the shear stresses, was evaluated from the Laue pattern analysis. The resulting deviatoric stress components were shown in Fig. 6. The stresses in the lithiated nanowires are quite different from the pristine nanowires, clearly indicating a triaxial stress state, resulting from a strongly nonuniform lithiation in both longitudinal and circumferential directions of the nanowires. The magnitudes of the deviatoric components of the directional stresses are very low in the pristine nanowires and increased on lithiation, which is in line with the findings of the energy scan analysis. Further, the directional components are in both compression and tension, indicating coexistent multiple stress states in the conical crystalline cores of the partially lithiated nanowires as shown in the simulations of Yang et al. [Reference Yang, Fan, Liang, Guo, Zhu and Zhang28]. The shear stresses across the nanowires in the pristine case are very high, may be due to the twisting, bending, and clustering of the tips observed in the SEM image [Fig. 7(b)]. After the initial lithiation (at 1.2 V), these shear stresses across them were reduced, because of the lithiation of the tips, leading to loss of crystallinity and softening. However, the shear stresses in the planes parallel to the nanowires (YZ planes) increased significantly, may be partly due to the nonuniform lithiation and conical crystalline core formation and partly due to the load from the expansion of the surrounding nanowires, because they are very close to each other [Fig. 7(b)]. The crack-like facets, bent and twisted nanowires, visible in the SEM image of lithiated SiNWs [Figs. 2(a)–2(c)] provide preliminary evidences for such possibilities. Further, the high shear stresses indicate more complicated deformation of the nanocrystals, constrained in the 3 dimensions by the amorphous parts of the nanowires. These constrained deformations of the nanowires lead to complicated stress states and their evolution during the electrochemical lithiation, especially the exact mechanisms preceding the fracture events, which are not explained earlier. Such a detailed understanding of the stress states of the silicon nanostructures could lead to novel insights to design the next-generation, fracture-resistant nanosilicon electrodes. However, it should be noted that this polychromatic diffraction signal too is an average one over several nanowires, covering them at different lengths, and hence the actual stresses in the single nanowire can be of much bigger magnitudes, leading to fractures.
Deviatoric stress components before and during lithiation.

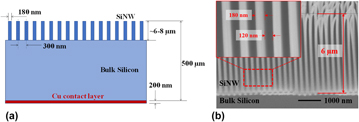
(a) Schematic of the SiNW sample (dimensions not to scale) and the Cu back contact layer. (b) SEM image of pristine SiNWs, which was taken at tilt angle of 45°. The average height of SiNWs is ∼6–8 µm (after tilt correction). Inset shows diameter and space between SiNWs.

The core–shell lithiation models in the literature consider spherical particles [Reference Zhao, Pharr, Wan, Wang, Kaxiras, Vlassak and Suo24, Reference Huang, Fan, Li, Zhang and Zhu25, Reference Chen, Fan, Hong, Chen, Ji, Zhang, Zhu and Chen26, Reference Zuo and Zhao27] and predict no shear stresses in the crystalline core on lithiation. Yang et al. [Reference Yang, Fan, Liang, Guo, Zhu and Zhang28] simulated lithiation of a single nanowire, which does not include effect of surrounding nanowires in the electrode such as the sample [Fig. 7(b)] used in the current study. Even in our earlier report [Reference Ali, Tippabhotla, Radchenko, Al-Obeidi, Stan, Tamura and Budiman31], the morphological evidence for conical lithiation pattern was shown, but no information related to its effect on the stress states was presented. The present study shows that the nanowire cores are subjected to a complex stress state, with high shear stresses, along with increase of the directional stresses, during lithiation, which is both longitudinally and circumferentially uneven for a SiNW. The resolution of the stresses predicted could have been much better if the sample contained fewer and longer nanowires with larger pitch (center to center distance between consecutive NWs) compared to what was used in this work. However, we used the samples readily available at our disposal, which were actually made and optimized for some other study. Based on the current observations, the SiNW samples for the future studies can be optimized to suit the experiment requirements. The resolution also could have been much better if the X-ray beam focused to ∼100 nm size, but such a beamline would need a different setup, instrumentation, and accessories altogether. Another factor, that could have affected the stress state in the lithiated SiNWs, is the high volume of the electrolyte in the test cell and longer distance between the lithium and silicon electrodes, compared to those of a standard coin cell. These two factors may affect the rate of lithiation process and, thus, the stress state at a given time during lithiation.
Conclusion
A unique lithium-ion battery test cell design was presented in this work. Such a specialized test cell is essential for enabling the in situ synchrotron scanning X-ray microdiffraction experiment of a SiNW electrode during electrochemical lithiation to study the evolution of stress in the crystalline SiNWs. The test cell design was proven to be effective by successfully enabling the X-ray detector to record the microdiffraction signal from the SiNW sample.
The crystalline core of the SiNWs was found to be in compressive stress (up to ∼325.5 MPa) during electrochemical lithiation using in situ µSXRD energy scan analysis. However, the SEM image of the lithiated nanowires shows conical shape with circumferential nonuniformity and crack-like facets, confirming the nonuniform lithiation pattern from the tip and also around the nanowires, indicating a triaxial stress state with high shear stresses in the SiNWs. The deviatoric stress evaluated from the Laue diffraction data analysis clearly shows high shear stresses and significantly different stress state in the lithiated nanowire cores in comparison to pristine nanowires. Such stress states could lead to evolution of more complicated mechanisms leading to and especially preceding the final failure/fracture of the nanoscale electrodes of silicon. The current core–shell lithiation models do not account for such a complex stress state. Studies using this technique with tailor-made samples and advanced instrumentation would allow furthermore comprehensive experimental examination of the stress evolution in the SiNW electrodes during electrochemical lithiation. The findings of this research study help to further improve the understanding of the stress states in the SiNWs and could help to the design of fracture-free silicon nanostructures for next-generation LIBs.
Experimental
Experimental procedure developed to quantitively evaluate the stress states during electrochemical lithiation of SiNWs in a specially designed electrochemical cell, which facilitates an in situ µSXRD probe, was explained in this section.
SiNW samples and electrochemical cell
The SiNW samples used in this experiment were fabricated using a p-type silicon wafer of thickness 500 µm. The nanowires are oriented in 〈100〉 direction and 6–8 µm tall, standing on ∼490 µm thick bulk silicon base as shown by the schematic in Fig. 7(a) and the SEM images in Fig. 7(b) below. The samples were fabricated using MACE process, at the laboratory of Materials for Micro and Nano Systems, Massachusetts Institute of Technology (MIT). The MACE process is a simple, highly repeatable, and scalable process for making silicon nanostructures as explained elsewhere [Reference Chang, Chuang, Boles, Ross and Thompson22, Reference Choi, Liew, Dawood, Smith, Thompson and Hong23]. The back side of the sample was deposited with a 200 nm thick copper layer for electric contact as shown in Fig. 7(a) below.
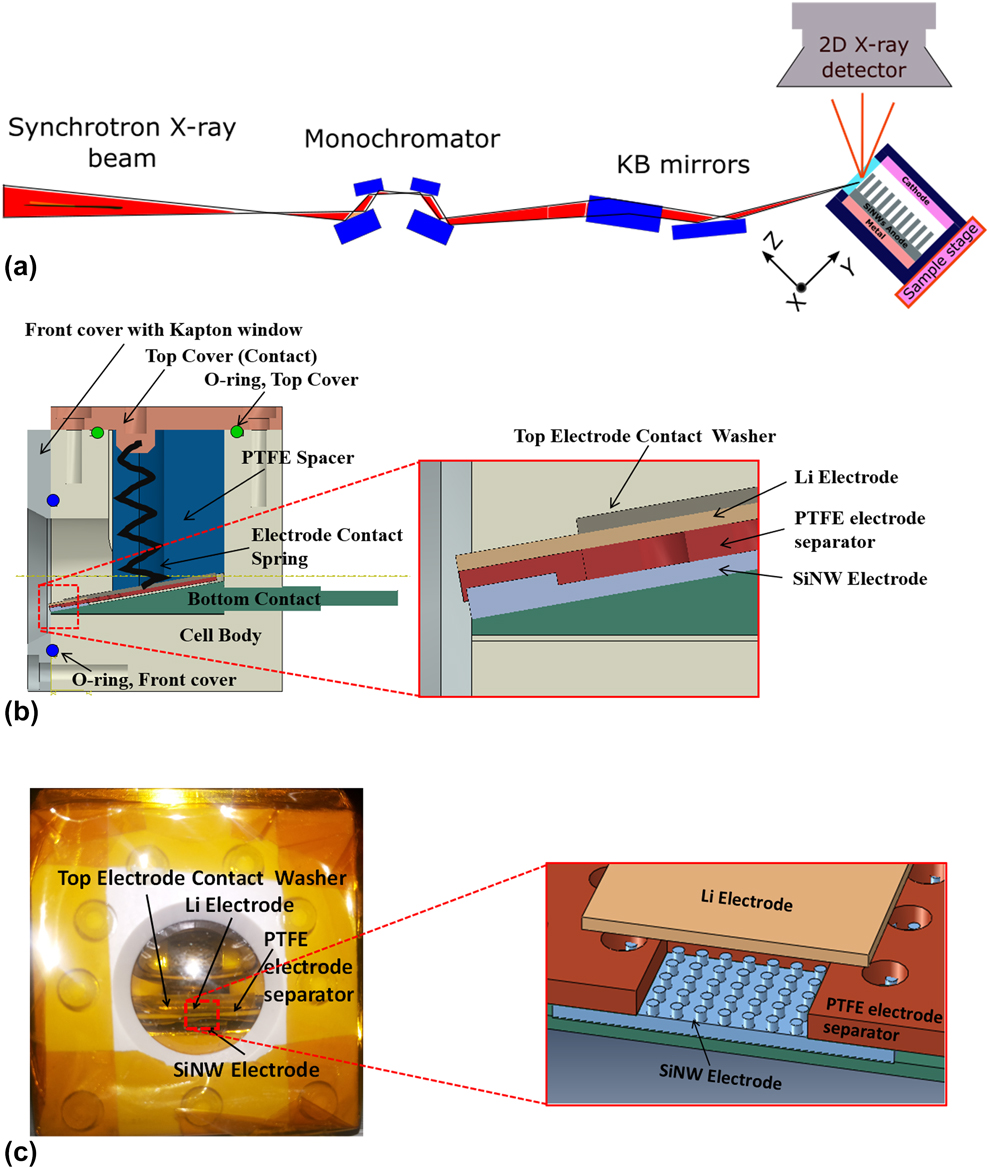
A unique battery test cell, specially designed and fabricated, is the key enabler to perform the in situ µSXRD experiment as explained in our previous reports [Reference Tippabhotla, Radchenko, Stan, Tamura and Budiman30, Reference Ali, Tippabhotla, Radchenko, Al-Obeidi, Stan, Tamura and Budiman31]. Such a special battery cell is required to enable the X-ray beam to reach the interior SiNW sample and come out (the diffracted X rays from the SiNW sample) to reach the detector as shown in the µSXRD schematic diagram in Fig. 8(a), and thus enable the detector to record the in situ µSXRD signal from the SiNWs during electrochemical lithiation in the cell. To achieve this task, the body of the cell (except the top metal cover) was made of an X-ray transparent material. In addition, a circular front window with transparent Kapton tape was fabricated to make the inner electrodes and other parts visible from outside as shown in Figs. 8(b) and 8(c). This front window is essential to enable focusing adjustments of the sample stage for good diffraction and to closely monitor the interaction of the X-ray beam and the electrolyte (which may be a safety concern) from outside. The interior of the cell was tightly sealed using O-ring seals [Fig. 8(b)], and the cell was assembled in a nitrogen/argon-filled glove box. The electrochemical cycling of the test cell from open circuit voltage (OCV) of ∼3–0.01 V was done on a single channel, portable Potentio/Galvanostat (Bio-Logic Science Instruments, Seyssinet-Pariset, France).
(a) Schematic of the overall µSXRD experimental setup. (b) Schematic of battery test cell assembly with detailed view of electrodes in the inset. (c) Picture of the assembled battery test cell with schematic of the close view of SiNWs, Li-electrode, and PTFE separator in the inset.

The test cell thus described [Reference Tippabhotla, Radchenko, Stan, Tamura and Budiman30] is much larger in volume compared to the typical coin cells and hence requires large quantity of electrolyte to fill the empty space. Hence, a PTFE spacer was used to fill most of the cell space that is empty [Fig. 8(b)]. However, the cell still requires much larger quantity of electrolyte (∼10–20 mL) compared to a few drops in a typical coin cell. Filling the cell volume is necessary for the µSXRD experiment, explained in the following section. It requires the cell to be assembled at 45° angle with the base, and the electrolyte displaces to the empty volume (if any) from the region between the electrodes, which may have affected the lithiation process. A more detailed description of the battery test cell to allow for this in situ experiments could be obtained from our recent earlier article [Reference Tippabhotla, Radchenko, Stan, Tamura and Budiman30].
Synchrotron X-ray microdiffraction experiment and stress states in SiNWs
The µSXRD technique uses a focused polychromatic/monochromatic X-ray beam of submicron resolution, which is crucial to enable the study of stress states in SiNWs during electrochemical lithiation. The current experimental work was conducted using the µSXRD setup at beamline 12.3.2 of the Advanced Light Source, Lawrence Berkeley National Laboratory, Berkeley, California [Reference Kunz, Tamura, Chen, MacDowell, Celestre, Church, Fakra, Domning, Glossinger and Kirschman45]. This beamline provides ∼0.8 µm spatial resolution and high crystal orientation resolution of 0.01° [Reference Kunz, Tamura, Chen, MacDowell, Celestre, Church, Fakra, Domning, Glossinger and Kirschman45, Reference MacDowell, Celestre, Tamura, Spolenak, Valek, Brown, Bravman, Padmore, Batterman and Patel46, Reference Chen, Dejoie, Jiang, Ku and Tamura47]. The µSXRD setup at this beamline has been widely used to study microstructural changes and mechanical and residual stresses in many technologically important devices and structures. Through-silicon via (TSV) in the microelectronics, nanostructures such as Cu/Nb nanopillars and nanolayers for energy applications, and crystalline silicon solar cells in photovoltaics are well known examples [Reference Budiman, Nix, Tamura, Valek, Gadre, Maiz, Spolenak and Patel32, Reference Budiman, Hau-Riege, Baek, Lor, Huang, Kim, Neubauer, Pak, Besser and Nix33, Reference Budiman, Besser, Hau-Riege, Marathe, Joo, Tamura, Patel and Nix34, Reference Budiman, Shin, Kim, Hwang, Son, Suh, Chung, Byun, Tamura and Kunz35, Reference Kim, Kim, Hwang, Budiman, Son, Byun, Tamura, Kunz, Kim and Joo36, Reference Radchenko, Tippabhotla, Tamura and Budiman37, Reference Budiman, Lee, Burek, Jang, Han, Tamura, Kunz, Greer and Tsui38, Reference Budiman, Han, Li, Wei, Dickerson, Tamura, Kunz and Misra39, Reference Kim, Budiman, Baldwin, Mara, Misra and Han40, Reference Budiman, Narayanan, Li, Wang, Tamura, Kunz and Misra41, Reference Budiman, Illya, Handara, Caldwell, Bonelli, Kunz, Tamura and Verstraeten42, Reference Tippabhotla, Radchenko, Song, Illya, Handara, Kunz, Tamura, Tay and Budiman43, Reference Handara, Radchenko, Tippabhotla, Narayanan, Illya, Kunz, Tamura and Budiman44].
Figure 8(a) shows the schematic diagram of the µSXRD setup. The beamline end station (BL 12.3.2) produces a high energy (5–24 keV) polychromatic X-ray beam of ∼0.8 µm diameter. A four-crystal monochromator in the setup is optionally engaged to get a monochromatic beam, whose cross-section is in elliptic shape with major axis ∼10 µm/minor axis ∼2 µm. The battery test cell was assembled on the sample stage as shown in the schematic in Fig. 8(a). The sample stage can move in XYZ directions, where Y is along SiNWs and Z is across the SiNWs as shown, and X is perpendicular to the viewing plane. The sample stage was approximately adjusted to the focus of the X-ray beam on to the SiNW sample in the cell using a laser triangulation system available in the beamline setup [Reference Kunz, Tamura, Chen, MacDowell, Celestre, Church, Fakra, Domning, Glossinger and Kirschman45].
The SiNW sample emits multiple diffraction signals from different crystalline planes (a Laue diffraction pattern) on interaction with the polychromatic X-ray beam. A 2D X-ray hybrid pixel array (DECTRIS Pilatus 1M) detector (made by Dectris Ltd., Baden, Switzerland), mounted over the sample stage [Fig. 8(a)], captures the diffracted signal. Initial µSXRD scans were performed along the SiNWs (Y-direction) covering the entire thickness of the SiNWs electrode, i.e., a line scan from bottom (bulk Si) to top (tip of SiNWs). The resulting intensity variation of the diffracted signal along Y-direction was studied to approximately locate the SiNWs. This is because the bulk Si generates high-intensity diffraction signal, and the SiNWs at the same time generate weak diffraction signal, at least 10 times lower in intensity than that of bulk Si.
Once the location of SiNWs was identified, they were scanned by both monochromatic and polychromatic X rays before and after assembly of the battery cell. Further, an in situ µSXRD scanning of the SiNWs was conducted during the electrochemical cycling of the test cell from OCV to 0.01 V. During lithiation (cycling), the crystalline core of the partially lithiated SiNWs produces diffraction signal and the amorphous lithiated outer shell does not participate in the diffraction process. The polychromatic diffraction data were analyzed using the XMAS software [Reference Tamura48]. Based on analysis of the initial polychromatic µSXRD scan from the SiNWs, the diffraction peak from the crystal plane  $\left( {\bar{3}\bar{1}5} \right)$, energy ∼9.716 keV in the case of pristine SiNWs (before the battery cell assembly) was identified for further analysis using energy scan. Similarly, the diffraction peaks from the crystal planes
 $\left( {\bar{5}\bar{1}7} \right)$, energy ∼14.08 keV and
 $\left( {\bar{4}\bar{2}6} \right)$, energy ∼14.62 keV were identified in the case of SiNWs during lithiation, for further analysis using energy scan. The monochromatic scan was performed around the aforementioned approximate energy values (corresponding to the identified diffraction planes) with a step of 0.002 keV. From this monochromatic scan data analysis, the lattice plane spacing (d-spacing) of the diffracting planes, d µSXRD, was evaluated for pristine SiNWs (before battery assembly) and lithiated SiNWs (during electrochemical cycling). The strain normal to the diffracting crystal planes, εhkl, was then calculated using the unstrained d-spacing, d 0, using Eq. (2) below [Reference Tamura48]. Thus, the stress acting normal to the diffracting planes can be calculated by multiplying the strain with the Young’s modulus of SiNW (160 GPa). Because the focused monochromatic X-ray beam is an ellipsoid of several (∼10 × 2) microns size, a single exposure covers several nanowires as shown in Figs. 4(a) and 4(b), and hence, the resultant diffraction signal is an average from several nanowires and so are the strain and the stress.
 $${\varepsilon _{hkl}} = {{{d_{\mu {\rm{SXRD}}}} - {d_0}} \over {{d_0}}}\quad .$$
Apart from the monochromatic energy scans, white beam Laue microdiffraction scans were also performed during the lithiation process. The resulting Laue diffraction patterns were indexed using XMAS [Reference Tamura48] to evaluate the deviatoric stress state in the SiNWs before and during the lithiation process. It should be noted that the size (diameter) of the polychromatic X-ray beam (white beam) is ∼1 µm, much smaller than the size of the energy beam spot [Fig. 4(b)]; thus, the white beam spot covers fewer SiNWs compared to the energy scan. Hence, the diffraction signal from the white beam scan is also an average, but from fewer nanowires. The Laue diffraction results provide evolution of shear stresses (the deviatoric stress tensor) during the electrochemical lithiation experiments in addition to the simple normal stresses in the diffracting planes already presented in our earlier reports [Reference Tippabhotla, Radchenko, Stan, Tamura and Budiman30, Reference Ali, Tippabhotla, Radchenko, Al-Obeidi, Stan, Tamura and Budiman31]. The results were discussed in the following section.
Acknowledgments
The authors gratefully acknowledge help and support in battery cell fabrication and SiNWs samples by Prof. Carl V. Thompson’s research group, Massachusetts Institute of Technology (MIT). In particular, Ahmed Al-Obeidi, Thomas Peter Batcho, and Wen Zheng in Prof. Carl V. Thompson’s research group at MIT are gratefully acknowledged for their assistance in sample fabrication and other experimental support. Koffi Pierre Claver Yao in the Prof. Yang Shao-Horn’s research group at MIT is also gratefully acknowledged for his assistance with the battery test cell design and fabrication. The authors also gratefully acknowledge the assistance from Dingchang Lin and Yayuan Liu from Prof. Yi Cui’s research group at the Stanford University for extending the glovebox and SEM facilities for battery test cell assembly during the synchrotron experiment at Beamtime 12.3.2 at ALS, Berkeley Lab. The Advanced Light Source (ALS) is supported by the Director, Office of Science, Office of Basic Energy Sciences, Materials Sciences Division, of the U.S. Department of Energy under Contract No. DE-AC02-05CH11231 at the Lawrence Berkeley National Laboratory and University of California, Berkeley, California.