

Introduction
In creating an “economic miracle,” the postwar Japanese business system became the admired model of policy makers and business leaders worldwide. Explanations of rapid success veered between the developmental state, bank-led finance, cooperative interfirm relations, employment practices, a unique culture, or any combination of these elements. Analysis identified a triangle of key actors—government, banks, and big business—yet initially overlooked the integral contribution of Small and Medium-Sized Enterprises (SMEs). Whereas later interpretations of the “miracle” period partially corrected this imbalance, our knowledge of these firms remains limited and, in comparison to Japan’s corporations, markedly so. With the perspectives of national bureaucrats and big business executives dictating our understanding of Japanese business history, our article focuses on the goals and actions of small enterprise leaders and their employees. The bursting of the “bubble economy,” in 1989–1990, turned Japan from a challenger of the Western economies into the subject of international criticism. SMEs acutely felt the consequences of failing growth rates and industrial restructuring, and they could no longer rely on long-term relationships and supply chains dominated by big companies. This sudden turnabout in economic fortunes, during Japan’s so-called lost decades, offers a well-defined opportunity to investigate major debates about SMEs, their management, and, specifically, their capacity to effect purposeful business strategies and transform their businesses. Crisis forced a reconfiguration of internal resources and competitive capabilities and, to avoid closure, innovation in products and production methods. However, rapid change in economic circumstances and industrial structure was just one major strategic issue confronting Japanese SMEs in the 1990s: Equally concerning were pressing decisions about installing computerized machinery, which, seemingly, had the potential to replace existing production methods rooted in older, noncomputerized tools and handcraft skills. Rival firms reequipped with transformative technologies would, it was assumed, pose an existential threat to unrestructured businesses. Furthermore, the operational flexibility and efficiencies associated with numerical control and automation offered an available and increasingly persuasive strategic solution to reduced demand, falling prices, and overdependency on supply chains. For Japanese SMEs, the conversion from conventional subcontractors into flexible specialists meant acquiring the resources and capabilities to meet varied orders, customize products, and obtain new customers.
Using in-depth cases, government reports, and national data, we present a needed account of Japan’s SMEs in the slow growth era of the 1990s and 2000s. We analyze and compare changes in production, technology, and skills in two firms, Industrial Manufacturing Center Ltd (IMC) and Precion Co., Inc., which both fabricated sheet metals for machinery and other products. Responding to the economic crisis, these enterprises acquired computerized equipment and pursued flexible specialization. However, they achieved different outcomes. As a result, our research explores the other strategic and operational factors that governed the conversion from subcontractor. The gaps in our historical knowledge of Japan’s SMEs, their organizational characteristics, and innovation processes is especially regrettable for an important and unprecedented period of transformation. One interpretation perceives a “paradigm shift.”Footnote 1 We investigate the development of systems and capabilities within the two case firms, and detail what any “paradigm shift” meant in practice. After evaluating the influence of economic, structural, and technological trends on the decisions of owner-managers, the study focuses on changes in organizational processes and operations.
This article assesses two research questions. First, in responding to waning relational subcontracting and transformative technologies, how effectively did Japanese SMEs between 1990 and 2008 revise their internal resources, products, and production capabilities to become flexible specialists? Falling demand, reordered supply chains, and growing use of computerized machinery forced Japan’s SMEs to address core strategic issues of market positioning, technological sophistication, and product development.Footnote 2 Our cases reveal the direct influence of factors external to the firm, namely economic and technological change, and important decisions by owner-managers. They show, additionally, the role of reformulated internal operational routines, involving owner-managers and engineers, in achieving sustainable strategic transformation. Firms discovered that becoming a distinctive flexible specialist, defined as turning newly installed technological resources into performance-enhancing capabilities, was more difficult than anticipated. One reason was exaggerated expectations about the ability of the latest production tools to fulfil all production and customer needs. Moreover, because computerization and automation were widely available, they could not by themselves be a source of competitive differentiation and long-term advantage. The case studies concentrate, therefore, on the complex processes of organizational change that followed the introduction of new machinery. Rather than just the adoption of leading technologies, it was their unique combination with existing experience, skills, and machinery that created distinctive capabilities and competitive differentiation. Second, to what extent can the strategic successes and failures of Japanese SMEs between 1990 and 2008 supply general insights? To elucidate this issue, we draw on major ideas in business strategy and the goals of SMEs.
Before detailing the IMC and Precion cases, the article considers in turn the two key external factors, namely economic restructuring and technological advances, which shaped the fortunes of SMEs after 1990. We begin, therefore, with a historical survey of relational subcontracting and production pyramids, and assess their particular importance to Japanese manufacturing. The article discusses how the bursting of the “bubble economy” and the reaction of large companies threatened a well-established system, and how economic restructuring forced SMEs in the 1990s into strategic realignment. An analysis of major developments in production technology follows, including the ways in which flexible specialization appeared an apposite response to a contemporary crisis. The next section describes the core aims of SME strategy and their relation to economic restructuring and technological change during 1990–2008. Based on the production and product problems confronting Japanese SMEs, the section explains the choice of case firms and their analysis. After our accounts of IMC and Precion, the article concludes by addressing the research questions.
Japanese SME Networks and Economic Restructuring
Small-scale workshops contributed to industrial development before and during World War I and expanded in scope during the 1920s and 1930s.Footnote 3 The 1937–1945 Pacific War left a lasting legacy: As well as greatly expanding industry, it forged the political and economic structures that would oversee postwar growth. The conflict influenced the Japanese model of industrial planning, state-firm relationships, bank finance, business networks, professionalized corporate management, and inclusive employment relations.Footnote 4 Furthermore, it embedded SMEs into production pyramids with major companies at their apex. War’s insatiable demand for munitions and resources forced large firms to switch from in-house production to subcontracting. Small enterprises were, by 1945, tied to government-controlled businesses, and these relationships enabled advances in their engineering techniques, skills, and quality of output. After the Korean War of 1950–1953, the Ministry of International Trade and Industry (MITI) formulated plans that prioritized national resources, and selected industries for development. During the “miracle” growth period, Japan absorbed leading foreign technologies and product standards, but it ensured indigenous control of production and promoted local innovation. Industrial plans focused in turn on steel, automobiles, and electronics, while allowing scope for corporate initiative. To facilitate the rapid growth in production, large manufacturers increasingly utilized subcontracting networks. GDP grew by 8.8 percent per annum between 1950 and 1960, doubling the size of the economy, and by 10.2 percent between 1960 and 1973, which drove a shift toward high value services and greater capital intensity. Some 1.1 million workers moved from agriculture and the primary sector into industry between 1950 and 1955, when manufacturing employees numbered 6.9 million, subsequently growing to 13.5 million by 1970. Although global crises in the 1970s curbed the “miracle” growth rates, the 4.2 percent per annum achieved in the 1980s compared favorably with major rivals.Footnote 5
Although legally and financially independent, Japanese SMEs could be functionally and strategically reliant on main customers.Footnote 6 Studies of the postwar automobile industry demonstrate how the integration of keiretsu networks supported the development of highly competitive production methods. They show, too, that large company programs to enhance supplier competence significantly constrained SME governance and investment decisions.Footnote 7 Established in 1948, as part of MITI, the SME Agency recognized the duality of the industrial system. In 1951, wages in enterprises with 4–19 on their payroll equalled 50 percent of those available in large firms; businesses with 20–59 employees offered some 56–68 percent. The employees of small enterprises could not anticipate job security and expected few nonwage benefits.Footnote 8 Major manufacturers relied, nonetheless, on the cost efficiencies, quality components, skills, and specialized machinery to be found within vertical supply chains. They offered SMEs secure orders, and technological, managerial, and production assistance; in return, they used SMEs as buffers against demand and price falls.Footnote 9 Banks preferred to finance SMEs with long-term contracts and stable orders from large companies. Being distrustful of outside shareholders, and valuing managerial control, SME owners needed access to bank financing. Although the lean production system associated with large Japanese manufacturers lacked the returns to scale and automation levels associated with the United States, it contained compensating advantages in low inventory, fewer product defects, and a just-in-time system entrenched in relational subcontracting. Stable relationships limited the leaking of proprietary and insider information.Footnote 10 Subcontractor motives were complex and conflicted. They relied on their connections with large companies, but vulnerability and fear of terminated orders motivated production and investment decisions. Suppliers experienced a paradoxical cycle of deeper vertical integration and greater insecurity. Many did not possess or proved unable to develop distinctive products, skills, technologies, innovation capabilities, or marketing expertise. The loss of a major contract badly damaged a firm’s reputation with customers and banks.Footnote 11 The story from the bottom of the production pyramid was frequently one of technology expropriation and squeezed prices. As a result, independent SME associations sought to improve the status and operational freedom of their members.Footnote 12
Employment in a recognized corporation bestowed social status, higher pay, regular promotion, and steady employment. SMEs implied economic backwardness, low productivity, old technologies, and cheap labor.Footnote 13 In 1963, the Basic Small Business Law defined SMEs as having less than 300 employees, reiterated their role within supply chains, and urged improvements in management, skills, and machinery.Footnote 14 Some 24.2 percent of Japanese SMEs, in 1966, stated that they had only a single customer; 18.6 percent had several main customers; some 10.6 percent engaged in a mix of subcontracting and independent sales. Therefore, a total of 53.4 percent declared involvement in some form of subcontracting.Footnote 15 Government policy slowly acknowledged the limits of scale economies and the benefits of industrial diversity.Footnote 16 It accordingly encouraged horizontal links and cooperative associations in specialized production and handcrafts, such as those in textiles, housewares, and food.Footnote 17 In 1982, enterprises with less than 100 employees accounted for approximately two-thirds of private sector personnel, and those employing between 4 and 299 employees were responsible for 51.9 percent of manufacturing value added.Footnote 18 By 1991, average wage levels in firms with 30–99 and 100–299 employees were respectively 73.6 and 81.2 percent of those sized 1,000–4,999. Smaller firms remained more inclined to use “nonpermanent” labor.Footnote 19
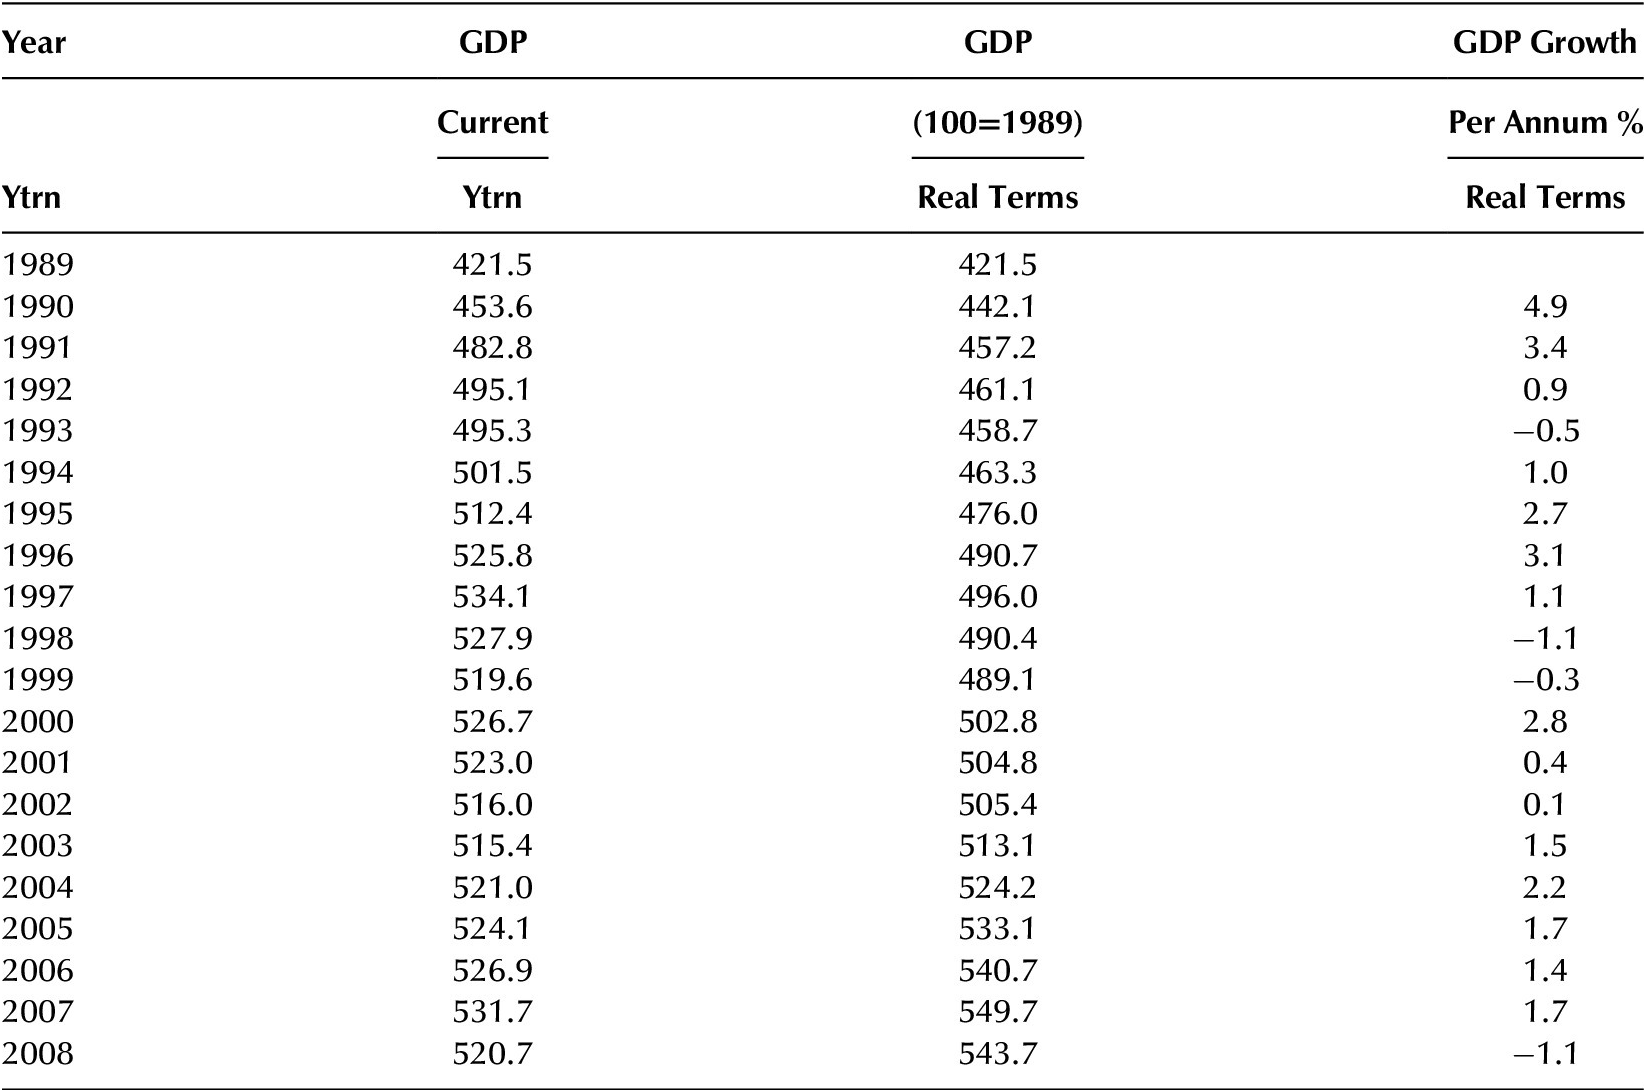
The latter half of the 1980s witnessed financial deregulation, easy credit, and an asset bubble. The fall in property and share prices that followed 1989–1990 cast doubts on Japan’s corporate governance, and challenged the viability of its economic model. An era of deflation, low growth, and industrial restructuring began, involving a banking crisis during 1997–1998, with the recession seeing partial recovery by 2000–2001 (Table 1). The unravelling of an industrial system exposed the strategic weaknesses of SMEs tied to production pyramids.Footnote 20 The loss of stable orders and revenues undermined the foundations of relational subcontracting. Contemporary commentators perceived the “hollowing out” of SMEs after 1990 as hastening long-term challenges for SMEs: They noted the growing sophistication of demand, market segmentation, internationalization, the relocation of production overseas, and technological progress. All these developments, it was argued, required subcontractors to operate more independently. One factor, it was contended, would favor SMEs: New flexible production machinery could greatly enhance their competitive advantage.Footnote 21
GDP in current and real terms, Japan, 1989–2008

Source: Recalculated from World Bank, Japan, GDP data and GDP constant (2010) data.
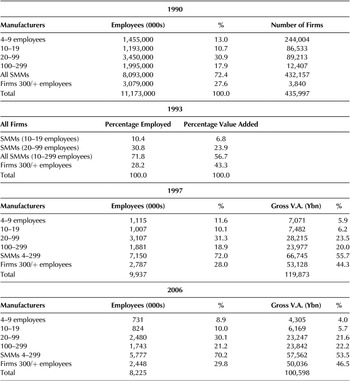
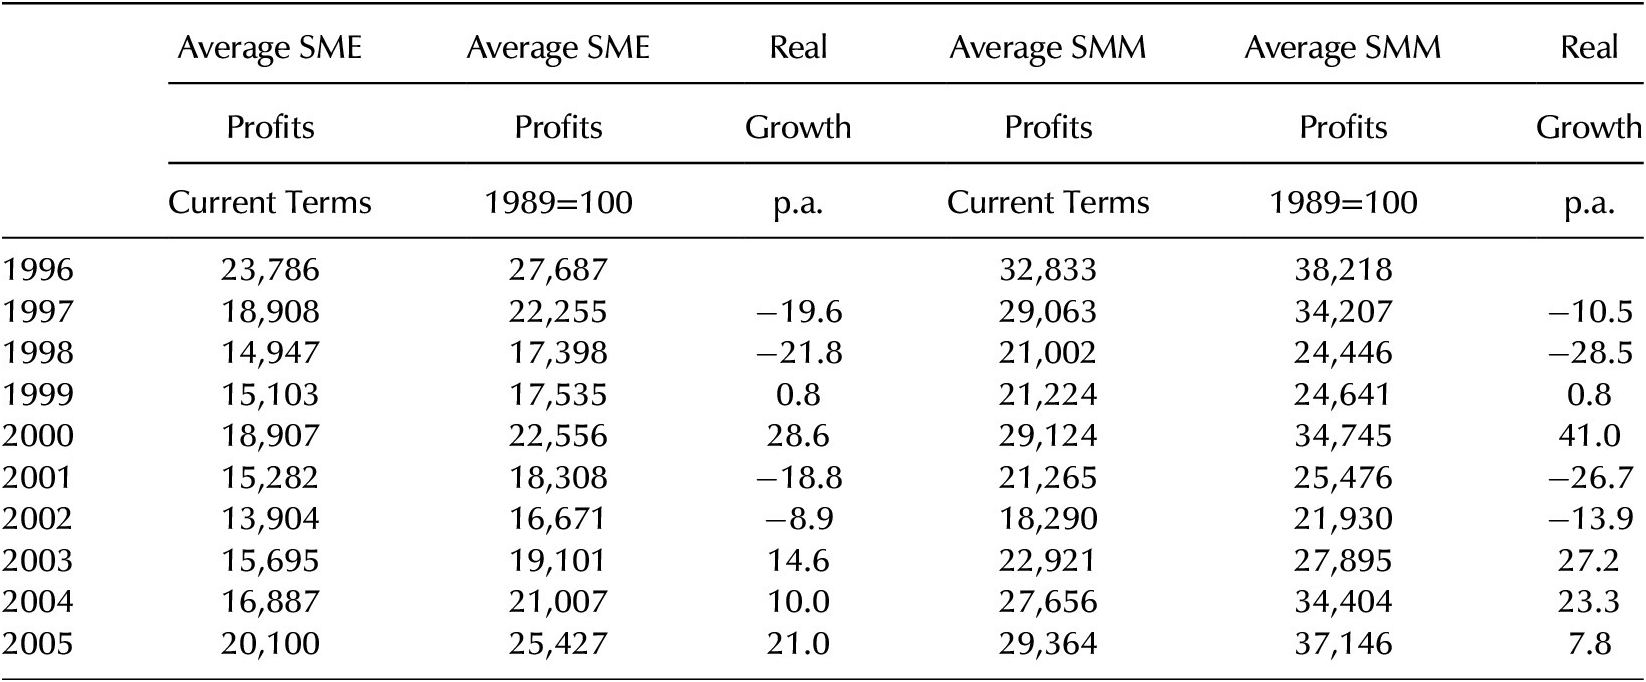
More immediately, Japanese SMEs faced a historically unprecedented crisis. A Bank of Japan survey recorded far-reaching price cuts to the components and services supplied by subcontractors between 1991 and 2002. Banks refused loans to endangered or underperforming small firms. The SME Agency recorded how most subcontractors, having invested in operations attuned to the needs of major customers, encountered the crisis with limited managerial know-how, market knowledge, marketing expertise, brand recognition, or financial resources. In 1993, Small and Medium Manufacturers (SMMs) accounted for 71.8 percent of all Japanese employees and 56.7 percent of manufacturing value added, against, respectively, the 28.2 and 43.3 percent for companies employing 300 or more. National shares of employee numbers and value added between small and large firms continued largely unchanged through to 2006 and beyond. The figures indicate the importance of SMMs to total employment but, in parallel, the continued higher productivity and stronger value chain position of large firms (Table 2).Footnote 22 The Small and Medium Enterprise Basic Law of 1999 marked a reversal in official policy: It recognized small firms as sources of economic growth, and emphasized the revitalization of industrial districts, start-ups, innovation, technological upgrading, diversification, better employment, or, in summary, overcoming the duality of firms.Footnote 23 By the end of the 1990s, general opinion about SMEs and subcontracting had significantly shifted.Footnote 24 Table 3 demonstrates large swings in the operating profits of SMEs and SMMs, and the uncertainty of their environment, particularly during 1996 and 2005 (Table 1).
Japanese manufacturers by size of establishment, employees, and value added, 1990-2006

Sources: SME Agency, White Paper (1993, 1997, 2006); MITI, Census of Manufacturers (1995).
Average operating profits, current and real terms: Japanese SMEs and SMMs, 1996–2005

Source: Ministry of Finance, Financial Statements (1995).
Flexible Specialization in Japan
Michael Piore and Charles Sabel famously devised the term flexible specialization. They denied the link between industrial efficiency and mass production, which relied on single-purpose machines, unskilled labor, and the production of standardized goods. Instead, Piore and Sabel pointed to other historically significant forms of production organization.Footnote 25 Philip Scranton’s account of U.S. manufacturing, from the late nineteenth century to the 1920s, similarly reevaluates mass production. Speciality producers pioneered technological and organizational transformations distinct from routinized assembly, bureaucratic management, and oligopolistic competition. Alongside mass standardized flow production, often labelled Fordism, was bulk production, connected to staple goods and simple technologies. It lowered prices by systemizing output, but did not standardize products. Batch production was potentially large-scale and capital-intensive, but it responded to unpredictable, “lumpy” or varied customer orders. Machinery and engineering projects required different production systems compared to mass manufactured automobiles or branded packaged goods. Custom production, usually small-scale, crafted a single product to meet a specific customer order. Both batch and custom manufacturing needed flexibility and specialization, and complex specifications and differentiated products could assume priority over price competition. Unlike mass producers, with routinized inflexible systems, other firms relied on adjustable, general purpose machinery and skilled workers. Firms could combine a mix of approaches. Although the 1920s saw the rise of mass manufacturing and large enterprises, in the United States and Europe, production systems and product markets continued to vary.Footnote 26 Flexibility and specialization expanded alongside standardization and mass production. In Japan, postwar large-scale manufacturing achieved competitiveness through higher levels of flexibility than in the United States or Western Europe, as evidenced by lean production, multiskilling, just-in-time, and responsive subcontracting networks.Footnote 27 Traditional craft skills, operational flexibility, investments in machinery, cost cutting, and product development within SMEs all contributed to Japan’s postwar success. When writing in the 1980s, Piore and Sabel perceived flexible specialization as defining “post-Fordist” societies. Cooperative networks and specialist subcontracting (distinct from production networks dominated by large firms) would be another characteristic. Piore and Sabel argued that computerized machines and data reduced the advantages of scale, and supported cost-effective batch production. In contrast to large companies, flexible specialists could switch nimbly between customers during periods of economic turbulence. Critics doubted the demise of mass markets and producers, and questioned the ability of resource-limited SMEs to innovate or implement significant changes in product and production strategies. Piore and Sabel held an optimistic vision of differentiated, innovation-led, high-skilled production; they underestimated, arguably, technology’s potential for work intensification and de-skilling.
CNC (or Computerized Numerical Control) machines had originated in the United States, and by the 1970s, integrated CAD/CAM (Computer Aided Design/Computer Aided Manufacture) had become commercially available. Over the next decade, Japan emerged as the biggest manufacturer and user of CNC machine tools, with their rapidly improving functionality and falling prices. Their technological sophistication and utility improved accuracy, and programming facilitated setup times, operational agility, and specialized production runs. Automation replaced labor and established skills.Footnote 28 However, it was the post-bubble crisis, the cancellation of major orders, or the threat of closure that led to substantial numbers of Japanese SMEs extensively installing already-available CNC machinery.Footnote 29 As a result, contemporary observers viewed Japanese small businesses as transforming themselves into “flexible specialists,” with CNC machines creating gains in production methods, batch processes, costs, and product quality. With notable exaggeration, they interpreted flexible specialization as turning subcontractors into the collaborating equals of large companies.Footnote 30
There is danger in simply assuming that Japan’s SMEs were, by the 1990s, devoid of innovative capabilities or the capacity to change. Many had more than one customer and would regularly compete for new orders. Investments in plant and machinery secured or retained major clients. Retirement among older craftspeople and the disinclination of younger employees toward traditional skills necessitated the installation of CNC machines. However, the subcontracting system and dependency on large orders inevitably curtailed production flexibility, and limited strategic options.Footnote 31 Technological change appeared as both competitive opportunity and threat during a time of economic uncertainty and supply chain restructuring.Footnote 32
Historical evidence about the impact of new technology on the activities and performance of firms is limited and little understood. As our case studies reveal, SMEs could mistakenly believe that CNC machinery automatically brought the capacity to thrive in the post–bubble economy. In reality, some 53 percent of surveyed Japanese SMEs, in 2000, reported that established handcraft skills retained their importance and could not be mechanized; 43.8 percent reported that technology could not fulfil diverse customer requirements; and 31.0 percent reported that traditional techniques allowed flexible responses to design changes.Footnote 33 Throughout the 1990s and 2000s, craft techniques and older machinery continued to offer specific operational advantages that CNC tools could not substitute. Because rivals could imitate the example of early users, the new technology was, by itself, a strategically insufficient solution.
Analyzing SME Strategies: The Japanese Case
In general, four key factors influence and determine SME strategies: external equity, market positioning, new products, and technological sophistication.Footnote 34 With traditions of personal control or family inheritance being markedly strong in Japanese SMEs, they commonly relied on long-term bank support. Owners characteristically sought to remain “lord of the castle,” and avoided outside shareholders. During the 1990s, over 70 percent of firms employing less than 300 people continued to declare no interest in external equity, and after internal revenues, banks remained their main means of finance. With cuts in production capacity and employee numbers, borrowing inevitably fell over the decade.Footnote 35 IMC and Precion reported good relations with their banks, and finance was no strategic barrier to their investing in new production equipment and computerized machines.Footnote 36 Market positioning enabled SMEs to exploit established products more successfully, or to maximize product developments.Footnote 37 When large manufacturers in Japan transferred production overseas and moved away from conventional contracting, matters of market positioning, greater independence, and enhanced product development constituted urgent strategic considerations for SMEs.Footnote 38 Subcontracting had previously resolved or confirmed market position within supply chains. They exercised, it follows, limited choices over product development, production methods, and technological upgrading. The 1990s pointed to reappraisal: Some 70 percent of SMEs claimed to have pursued product differentiation.Footnote 39 Regarding technological sophistication, Japanese firms had to evaluate their mix of manual skills, human abilities, and machinery, and decide on their willingness or capacity to invest in leading-edge equipment. CNC machines, in principle, bestowed the production flexibility needed to compete for customers, and enabled specialization in high-value products and services. Flexible specialization appeared an available alternative to a production architecture and product range designed for supply chains.
Through case studies, we address the ability of Japan’s SMEs to transform their market position, production, and products through new equipment and technology. As we shall see, aspirations to convert from subcontractor to flexible specialist led to the installation of CNC machinery. To achieve intended strategic outcomes, SMEs had to integrate their new equipment into their existing production systems, and create new or augmented combinations of assets. The resource-based view (RBV) interprets business strategy as firms utilizing heterogeneous internal resources—such as finance, equipment, technology, knowledge, skills, and production and product development systems—to create a sustainable competitive advantage over rivals.Footnote 40 Resources contribute to competitive advantage when they are valuable, rare, imperfectly mobile between firms, and nonsubstitutable. As exampled by Japanese SMEs converting into flexible specialists after 1990, both distinct individual resources and systemic resources that optimize different assets within a firm have relevance. It is the exploitation and not the existence of resources that underpins durable performance. The firm’s capabilities determine the capacity of combined resources to perform a task or activity.Footnote 41 Complex internal organizational patterns, built through learning routines and repetition, grow along an incremental development path.Footnote 42 A “systemic resource” derives value and uniqueness from being a vital part of a system.Footnote 43 By retaining a variety of production options, technologies, and skills, Japanese SMEs maximized operational flexibility, customer responsiveness, and product diversity. Our case studies identify both individual skills and resources and their systemic linkages, and map out production systems and internal competence transformation over time.
The RBV provides a useful framework for understanding how firms build sustainable and specialized competitive capabilities from their “feedstock” of internal resources. On the other hand, it says little about how firms adapt specialized resources and capabilities in changed circumstances.Footnote 44 The RBV does not explain how firms maintain competitive advantage over time, or as illustrated so clearly in post-bubble Japan, respond to periods of turbulence.Footnote 45 The Dynamic Capabilities approach attempts to describe how firms build new competencies or reconfigure existing ones in an altered external environment. In the case of the RBV, internally-generated differentiating capabilities enable firms to compete more effectively or to acquire a lead in the external marketplace; for Dynamic Capabilities, the external environment shapes the formation of differentiating capabilities within firms, and to survive long-term, changes in external conditions necessitate the reconfiguration of internal capabilities. Critics have commented on the RBV’s inability to distinguish clearly between resources and capabilities, leaving its analytical approach vulnerable to accusations of tautology. Similarly, empirically demonstrating the existence and workings of Dynamic Capabilities presents well-acknowledged problems.Footnote 46 Our historical review of Japanese SMEs, therefore, explores how firms responded in different ways to transformed economic and technological circumstances, and as they sought conversion into flexible specialists, it pinpoints stages in internal reconfigurations of resources and capabilities. The cases support the Dynamic Capabilities school that stresses the significant role of owner-managers in sensing changing conditions and seizing new opportunities. They show, too, that existing SMEs had the capability to transform their competitive fortunes during a period rapid economic and technological change.Footnote 47 Our analysis highlights, therefore, the impact of external factors on the internal evolving systems of firms. However, it acknowledges how sustainable differentiated resources and long-term flexibility stemmed directly from the internal interactions of owner-managers, engineers, and key personnel, and from the inculcation of new or improved systems and routines in product development and production.Footnote 48
Commentators question whether SMEs, lacking scale and resources, can pursue deliberative business strategies and, therefore, whether they can react effectively to a shifting external environment by fundamentally revising operations or market position.Footnote 49 One response is that researchers have paid comparatively little attention to SMEs and that more evidence and cases are needed.Footnote 50 This article, consequently, details the strategic aims and operational transformation of Japanese SMEs between 1990 and 2008. It describes how reactions to contextual factors rested ultimately on internal processes for acquiring, absorbing and utilizing knowledge.Footnote 51 The owner-manager’s personal networks and willingness to assimilate external information were critical catalysts, while internal experimentation and systemization determined the absorptive capacity of firms. The challenges for resource-constrained small firms were, nonetheless, considerable.Footnote 52 The advantages of CNC machines were well-known but nonspecific, and abandoning valuable resources and capabilities for the advanced technology equipment amounted to a strategic risk. A more evolutionary process allowed opportunities for combining or linking new and old techniques, with the resulting systemic resources and capabilities facilitating hard-to-imitate differentiation in products and production.Footnote 53 Traditional skills and older machinery reflected a firm’s experiences and proven competencies.Footnote 54 During this period, they continued to embody important production options. Experimentation within a firm, combining older and new techniques, offered chances to build or reconfigure resources more likely to be valuable, rare, imperfectly mobile, and nonsubstitutable.Footnote 55 Integrating technological improvements into existing assets allowed the achievement of strategic aims rather than just operational efficiency.Footnote 56 We are concerned with internal processes, including the decisions, contributions, and daily interactions of entrepreneurs, managers, and engineers. Our cases show how one firm, committing wholly to computerized production methods, failed to convert into a flexible specialist. The other firm integrated, systemized, or improved combinations of traditional skills, technology-related skills, older machinery, and new equipment, and achieved the goal of flexible specialist.
Our research investigates what strategic transformation through flexible specialization meant for SMEs as a process and as an outcome. For research purposes, SMEs have the advantage of being at a scale small enough to identify and track the evolution of varied resources and capabilities. Through case studies, we are able to show the interplay of external forces and internal firm processes, and the resulting contribution of internal resources and capabilities to operations and performance. In his insightful survey, D. Hugh Whittaker reveals how Japan’s small firms differed in character from the corporations one-sidedly depicted as the “Japanese enterprise model.” He notes how industrial restructuring, the overseas relocation of production, insecure demand, and falling prices signalled in the 1990s severe challenges for SMEs.Footnote 57 Whittaker discusses the emerging threat, but at the time of writing, he cannot describe the fate of small firms during the low growth era that followed. Possible outcomes included the polar opposites of “hollowing out” and a “paradigm shift.”Footnote 58 Our research looks in detail at the capacity of Japanese SMEs to undertake a strategic transformation during rapidly changing circumstances. The cases demonstrate, moreover, the valuable contribution that historical methods and longitudinal case studies can make in demonstrating the internal processes of firms reacting to a changing landscape.Footnote 59
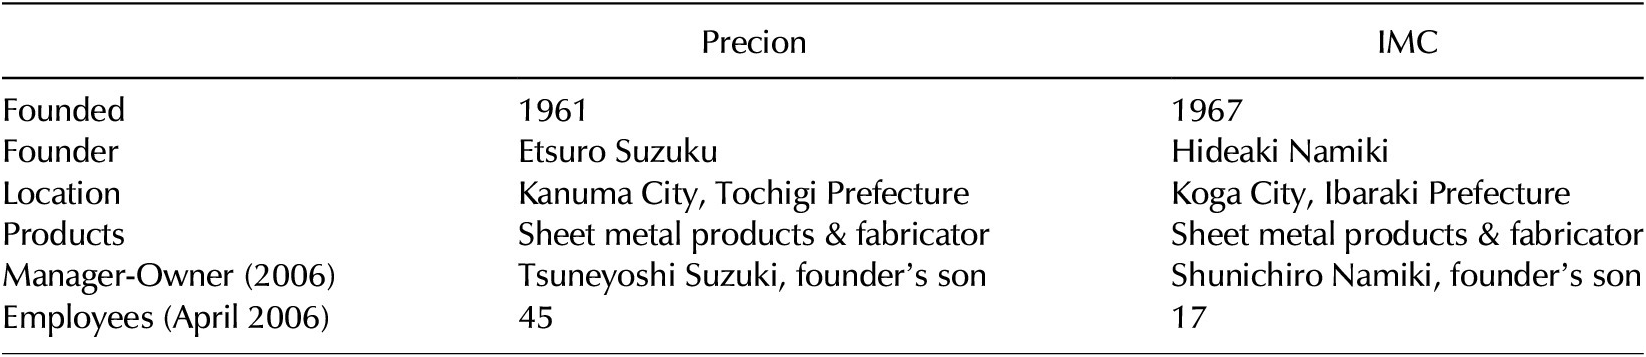
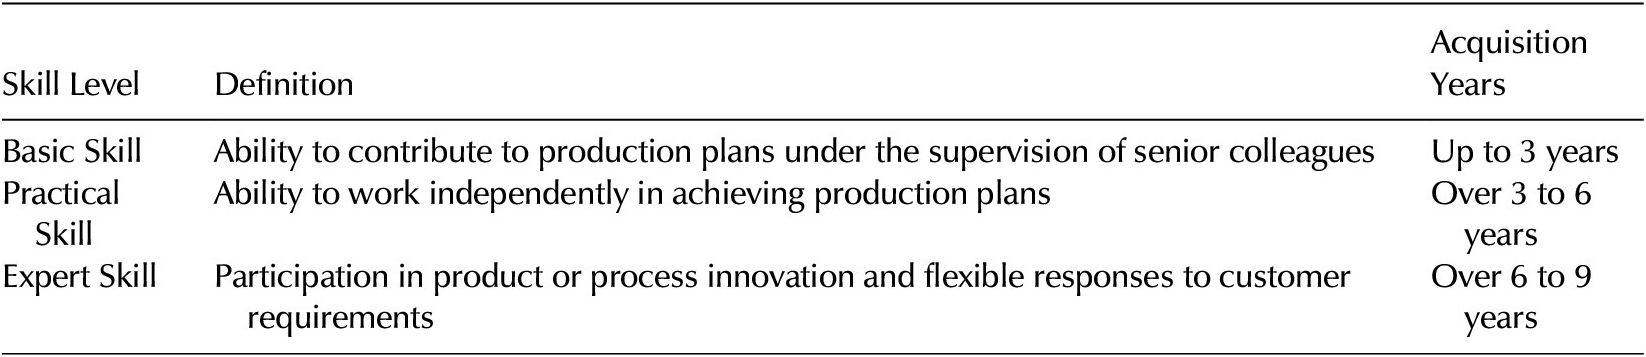
Both IMC and Precion originated in the 1960s, the high era of supply chain subcontracting (Table 4), and by 1990, they were located among Japan’s top five prefectures for machinery and components manufacture.Footnote 60 IMC fell into the category of SMEs with 4–19 employees, which, during 1993, accounted for some 10.4 percent of Japan’s total employees and 6.8 percent of value added. Precion could be found among the 20–99 employee category, which, nationally, held 30.8 percent of employees and 23.9 percent of value added (Tables 2 and 4).Footnote 61 We explore the organizational challenges of the 1990s and 2000s, the strategic reasoning of owner-managers, and the opinions and contributions of engineers. The research used semistructured interviews, as well as written information and business documents. All interviews were conducted and recorded in Japanese, and later transcribed into English. Surveys and reports, from government and other organizations, allowed the evolving strategies and internal organization of firms to be set within national trends. Owner-managers and engineers completed questionnaires in which they recorded their roles, skills, years of training, and involvement in and understanding of different processes and production stages. We used the questionnaires to record and construct the individual skills and production tasks of each firm in every year, charting changes in competencies, product development, and production systems. The categorization of engineering skills and expertise follows the approach of Japan’s SME Agency, whose definitions relate directly to the engineers’ ability to work innovatively, independently, or under direction (Table 5). In this way, the research could trace developments over a decade in the level, composition, and range of skills; degrees of multiskilling; uses of machinery; technological change; and integration between production stages. The analysis focuses on the major reconfigurations carried out at each firm, specifically as a response to the loss of major contracts and the decline in traditional subcontracting. The cases explore how knowledge exchange and modified combinations of equipment, skills, and experience influenced product development or production.
Precion and IMC: Origins, Products, Owners, Employees

Definitions of skill levels in Japanese SMEs, 2006

Source: SME Agency, White Paper (2006), 189.
Strategic Dependency versus New Technology: IMC
Archetypal Subcontractor: 1967–1995
Hideaki Namiki founded Industrial Manufacturing Center Ltd, or IMC, during 1967 in Koga City, Ibaraki Prefecture, northeast of Tokyo.Footnote 62 There were four main process stages in shearing and shaping metal sheets for the manufacture of machinery and related goods: product design; blanking (punching holes or cutting shapes); bending; and welding. As an archetypal subcontractor focused on one customer’s needs, IMC in its early decades needed the efficiency of mass-production machines. Nevertheless, the equipment required manual dexterity and experience, and craft-based skills dominated more complex processes. The combination of methods secured operational flexibility. Relying heavily on three separate groups of craft engineers, who controlled production, clashes over manufacturing plans, and access to machinery were commonplace.Footnote 63
First Reconfiguration: 1995–1997
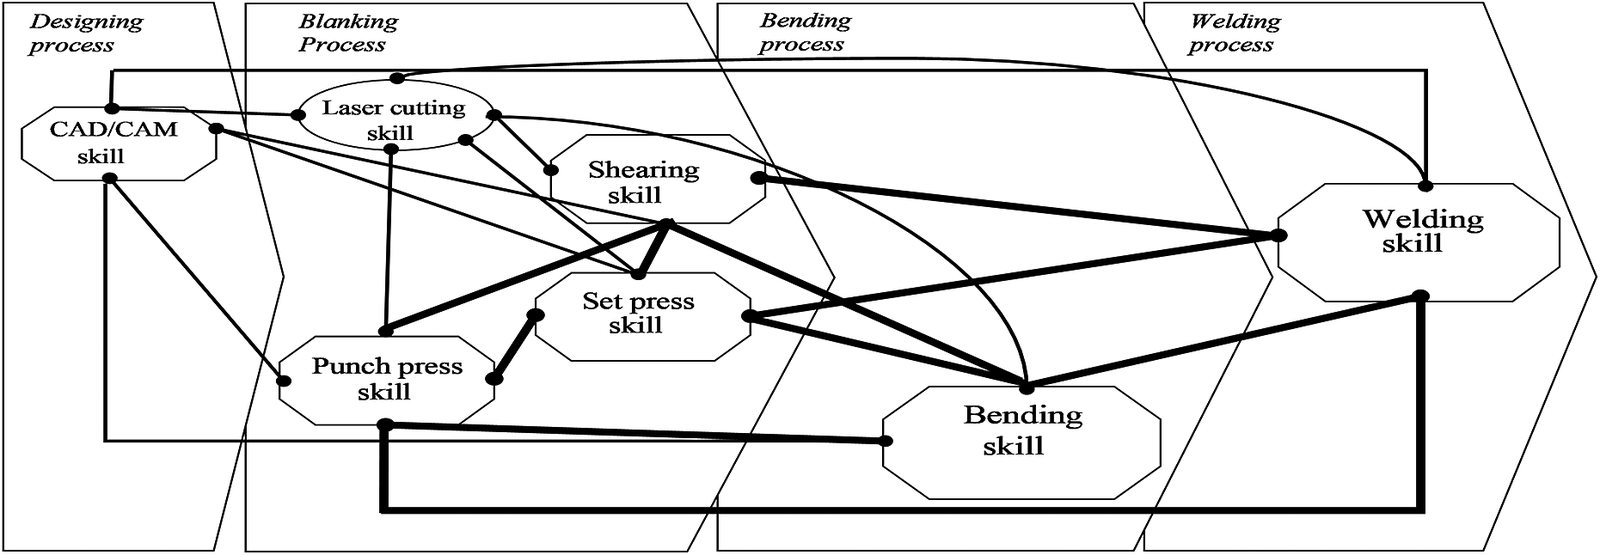
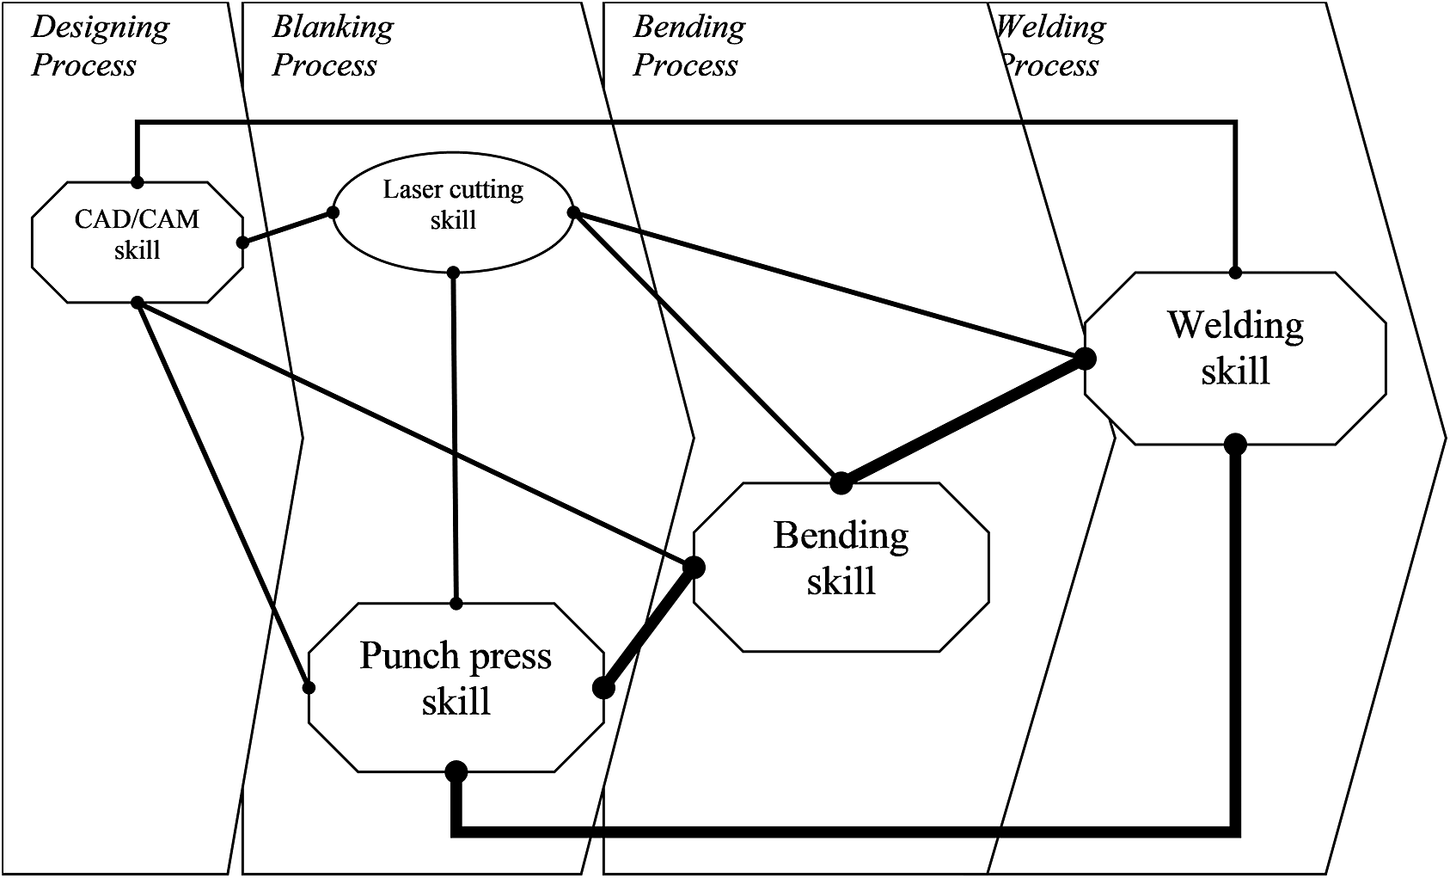
In 1995, Shunichiro Namiki, the founder’s son, succeeded as managing director and embarked on supplementing IMC’s price-sensitive manufacturing with niche markets and product quality. Using his experience as a product designer for a large machine firm, Namiki introduced CAD/CAM to transform IMC’s production system and, specifically, to fulfil the potential of an underutilized CNC turret-punch press. The firm acquired the ability to receive customer data electronically, and the central database it created allowed changes to product or component designs. Potentially, CAD/CAM could transform production planning and automate the cutting and pressing of sheet metal. This new facility, potentially, challenged the operational control and status of the engineers. Whereas it was possible to download CAD/CAM data to the CNC turret-punch press, the number of applications had been limited. In the event, CAD/CAM remained a stand-alone function separate from the other unaltered production processes, and the firm remained, noticeably, a conventional subcontractor in its operational methods, priorities, and narrow sales base.Footnote 64 Excepting those involved in CAD/CAM design, most IMC engineers continued with their recognized craft methods and mechanical equipment, and, revealingly, those engaged in the long-established blanking and bending stages held the highest levels of skills and experience (Figure 1).
IMC’s Production and Skills Architecture, 1997
Source: Questionnaires, IMC engineers, 2007 (smaple = 11).
Notes: An octagonal shape denotes an established skill at the dates indicated, and a circle shows a newly-established skill. The size of each shape illustrates the relative number of expert skill holders of each skill, as defined in Table 5.

Second Reconfiguration: 1998
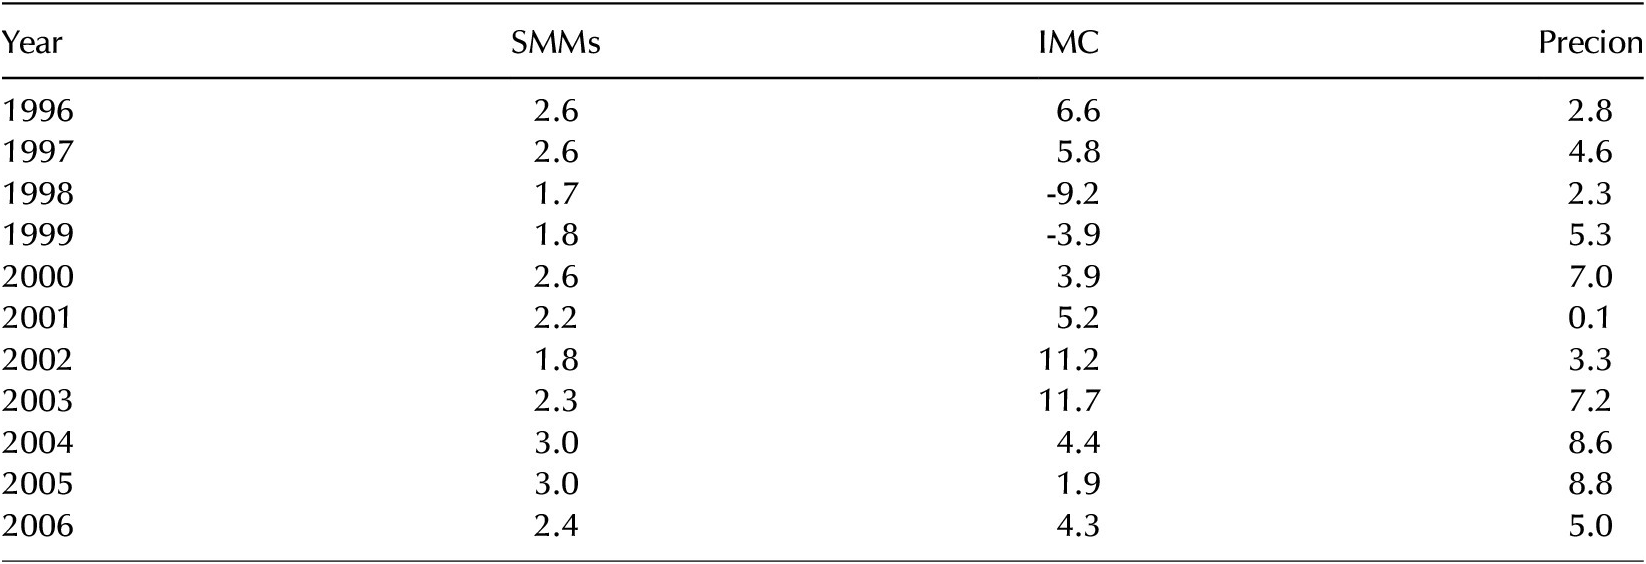
When Japan’s economic difficulties worsened in 1998, and its main customer went bankrupt, IMC lost half its sales revenue overnight. Operating profits reached a low of −9.2 percent against the national SMM average of 1.7 percent, reversing respective returns of 5.8 and 2.6 percent the previous year.Footnote 65 Confronted with a crisis, Namiki followed his belief in transformative technologies. He set out wholly to cease reliance on conventional machinery and craftsmanship, and to convert IMC into a fully “modern” factory. More sophisticated manufacturing methods would, it was argued, bring greater customer responsiveness and product differentiation.Footnote 66 To secure orders and long production runs, Namiki believed that computerized flexible manufacturing had become critical to the large-scale batch efficiency he aspired to implement. Reflecting on recent experience with CAD/CAM, he judged that “the most important thing should be to organise these important elements systematically,” transforming processes and deepening links between production stages. In this task, he argued, the managing director would be the prime mover and the chief reason for success or failure.Footnote 67
IMC began its extensive change program by investing in additional CNC machinery (namely a LCV3012B laser cutter) to “upgrade” to a more complete computer-based production system.Footnote 68 Installing the equipment in parallel to the existing CNC turret-punch press initiated a step change.Footnote 69 Laser cutting gave IMC greater opportunities to exploit transferred customer data and to cut complex shapes automatically, reducing setup times, increasing operational speed, and improving quality. The laser cutter and turret-punch press tendered distinctive production capabilities: The cutter suited large standardized batches; the press was better for small batches of differentiated products.Footnote 70 Although the press was less flexible than the laser for cutting complicated shapes or fabricating acute angles, it was cheaper to operate and more efficient in making repeated holes of similar patterns.Footnote 71 Having received customers’ product data, engineers decided on the appropriate production process and selected, as required, the laser cutter, turret-punch press, or the older press brake machine. They then assembled and welded individual manufactured components into saleable products. The change program, however, had important limits: IMC chose not to invest in expensive CNC bending machines, leaving the process as comparatively time-consuming and craft based, and all the blanking machines, old and new, required manual and craft skills.Footnote 72 As a method of metal-sheet shearing, the laser cutter reduced the number of manual interventions and skills. Comparing 1997 with 2001, IMC increased flexibility and product range at the blanking stage, but with the operations of other more established processes being left unchanged, the deepening or further integrating of production techniques was minimal (Figures 1 and 2). Engineers on the laser cutter involved themselves little in other processes, and they had few opportunities and little motivation to exchange knowledge and experience. As laser cutting came to dominate blanking at IMC, its lack of integration and a general failing in systemic planning had consequences. Skill combinations between the less-used computerized punch press and conventional blanking, bending, and welding remained minimal, reflecting an entrenched production architecture (Figure 2). Just as CAD/CAM and laser cutter engineers kept mainly to themselves, their older colleagues found computer-based systems difficult to operate.Footnote 73

The separateness of laser cutting from much of the production system hindered the building of capabilities in manufacturing flexibility and batch production. Within a few years, the laser cutter lost its competitive advantage. Little integrated into a distinctive production system, rival firms easily copied its functionality. The problem was especially difficult for IMC, whose shearing, set press, and bending skills were similarly commonplace. The costly automated welding facilities were poorly suited to small-batch production and multiple lines, and in reverting back to manual welding, the firm undertook training in skills very recently relinquished.Footnote 74 Although the CAD/CAM engineers could computerize customer data for production, IMC did not develop the capability for customizing products.Footnote 75 Connections between CAD/CAM, design skills, and machining processes were highly restricted, despite such linkages remaining a major strategic objective (Table 7). High competence levels in CAD/CAM rested with the same two expert engineers throughout 1996 to 2005. Because employees involved in CAD/CAM, but without highly rated skills, almost doubled from 2002 onward, the average expertise level at the firm became diluted. Blanking skills and expertise with the CNC machines (the LCV3012B and a BPEGA357) did not improve and fell from 2001; bending and welding techniques followed the same pattern. The number of expert engineers engaged in CAD/CAM design, blanking, bending, or welding did not increase, and interactions between design and production showed a long-term decline (Table 7). Knowledge diffusion and differentiation in products or production within the firm could not, as a result, fulfil Namiki’s expressed strategic objectives.Footnote 76
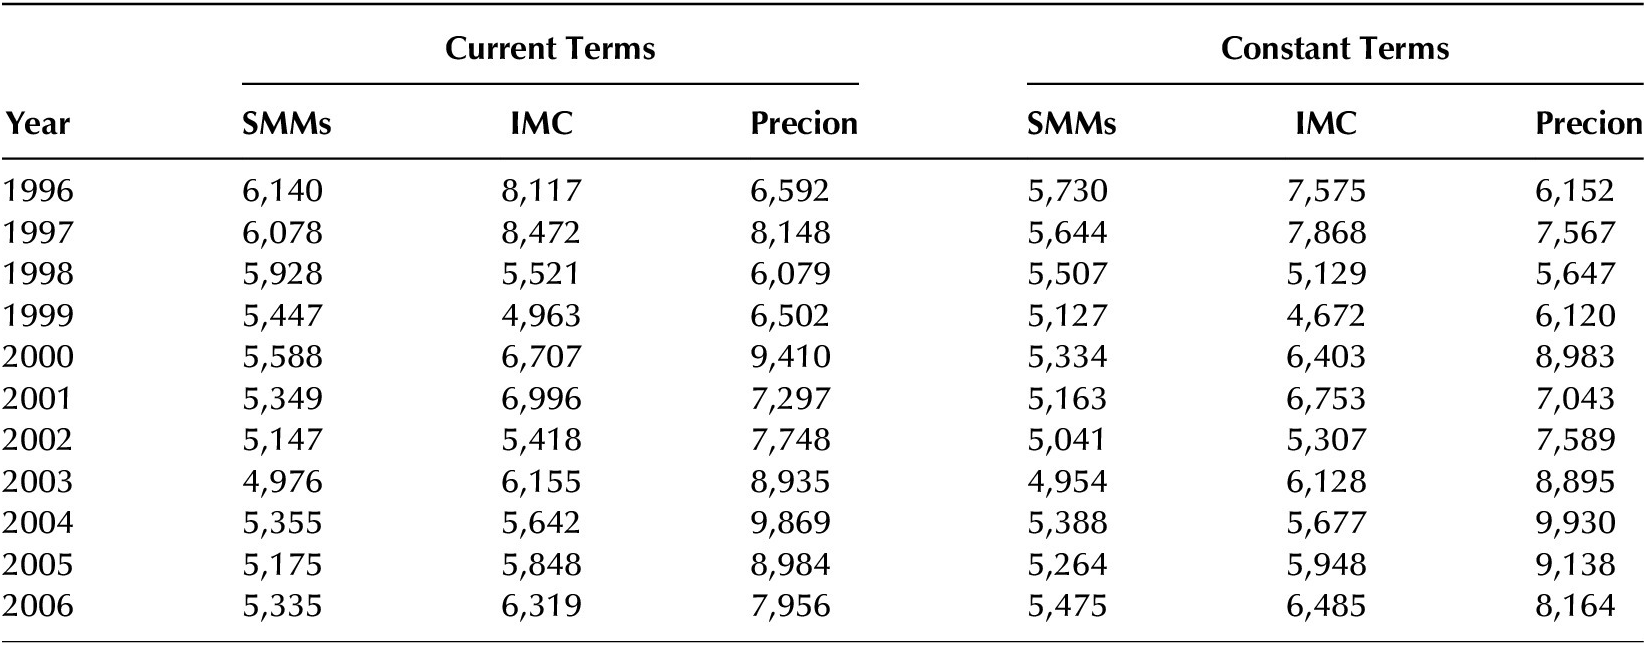
Labor productivity: Japanese SMM average, IMC and Precion. Current and constant (1989=100) figures, 1996–2006

Sources: Recalculated from SME Agency, White Paper (2006), 15; Ministry of Finance, Financial Statements; IMC (1996-2005), Financial Statements; Precion (1996-2005), Financial Statements.
Notes: Labor productivity is value added divided by the number of employees. Value added is the sum of operating profit, personnel costs, depreciation, interest expenses, discount charges, and rent from property.
Operating profit margins: Japanese SMM average, IMC and Precion, as percentage of sales, 1996–2006

Sources: Recalculated from Ministry of Finance, Financial Statements; IMC (1996-2006), Financial Statements (1996-2005); Precion Ltd, Financial Statements.
Third Reconfiguration in 2002
By 2002, IMC had not upgraded from conventional subcontractor to flexible specialist. CAD/CAM and laser blanking aside, individual engineers continued to control the production of particular product lines and inhibited the emergence of new routines and techniques. They also saw themselves as being de-skilled.Footnote 77 Namiki had been reluctant to challenge the practices of his father and the subordinates he had appointed. Small Japanese manufacturers regarded the emergence of distinct computerized and conventional “language” groups as problematic, and workplace tensions could disrupt production. In deciding every production plan, including choice of materials, machines, and cutting tools, CAD/CAM programmers had gained oversight but not control of operations.Footnote 78 In their role, they were unable to increase skill linkages or generate production and product innovations.
All decisions are made in the office, not in the factory. The managing director and the CAD/CAM programmers discuss issues among themselves, and what we do is to manufacture goods under their decisions and supervision.… This created conflict with the older engineers, often relegated to less skilful downstream activities.Footnote 79
From 2002, Namiki abandoned conventional cutting machinery and pursued differentiation through greater use of new technologies. Instead of evaluating each machine and process, or their contributions to overall effectiveness, IMC looked to new technology to overcome its strategic impasse.
It was a common trend that small manufacturers replaced an old set of cutting machines, called mechanical cutters, with a new set, such as laser cutters and punch presses, around the turn of the century. At that time, the new machines were very expensive, because they had just gone on the market. Therefore, if a firm had a laser cutter, it could highly differentiate its production from competitors.Footnote 80
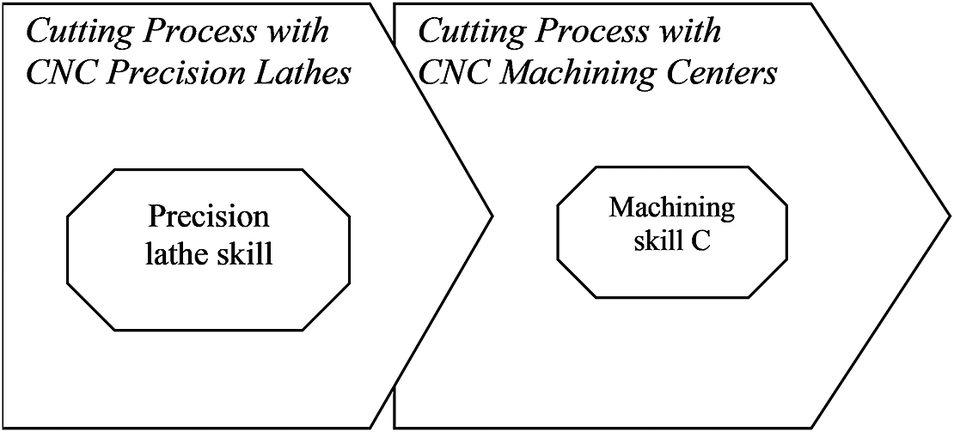
It was questionable if, in the long term, the available new production technologies by themselves could achieve the goals of flexibility or specialization, and in the short term, competence might be lost before being replaced.Footnote 81 Figure 3 shows the resulting production architecture. The skills associated with shearing and set press processes disappeared, and skill linkages and the capacity to differentiate fell markedly. By ceasing to use the older equipment, Namiki inevitably reduced the variety of production facilities, in the hope that new technology would generate net advantages. He thought it necessary to replace skills he now regarded as redundant. As a result, Namiki had to tackle matters of personnel, observing that
we had plenty of machines. We could manufacture any line made from sheet metals. The problem was the low rate of operation.… I forced our craftsmen not to use those old machines. I abandoned and sold them to change the engineers’ attitudes. In general, the division of labour will increase productivity, but craftsmen with older skills tend to be firmly fixed to stand-alone production with old machines.Footnote 82
IMC’s Production and Skills Architecture, 2002-2005.

Organizational change became an issue of transforming attitudes and personnel associated with handcraft skills. Given Namiki’s belief that IMC had too many old machines, total assets per employee decreased from approximately ¥16 million to ¥9 million, far below industry average, between 2003 and 2005. Interestingly, whereas Japan’s SMMs on average improved their operating profits during this period, those of IMC were falling.Footnote 83 The advantages of new technology had seemingly justified full computerization and automation, but IMC’s history from 2002 illustrates its waning advantage. The relinquishing of old technologies and skills depleted IMC’s specialization overall and, in fact, led to linkages with both traditional and new skills being abandoned (Figure 3). The policy constituted a competence destroying event. When, by 2005, the laser cutting machine had become commonplace in the industry, the rareness and inimitability of the firm’s resources reduced further. The IMC case reveals the critical role of the owner-manager and, for SMEs, the gains and pitfalls of advanced technologies. Namiki hoped that computerized and centralized product design would itself facilitate innovative product development, integrate design with the most modern production machinery, and generate manufacturing efficiencies. He aspired for IMC to be a product innovator, as well as a flexible specialist and efficient batch producer. However, the firm did not enhance product differentiation or customization, and although new technologies at first did bring greater flexibility, the loss of specialized skills eventually had the greater counter effect. With skill levels and overall connectivity between production stages falling, Namiki failed to integrate or embed routines and understanding between different expert engineers, and to generate product or production specialisms. Whereas Namiki’s strategic intent from 2002 onward was evident, IMC proved unable to realize his objectives.
Flexible Specialization and Systemic Resources: Precion
Subcontractor Capabilities: 1961–2000
In 1961, Etsuro Suzuki established his private firm as a provider of metal-cutting services, and he refounded it, formally, as Suzuki Seiki Machinery Ltd ten years later. Tsuneyoshi Suzuki succeeded his father as managing director during 1991, just as Japan’s economy was slowing. In the following year, wanting to meet the needs of existing customers more effectively and to expand his business, Suzuki built a new factory in Kanuma City, Tochigi prefecture, northeast of Tokyo, creating Suzuki Precion Co., Inc. The plant used several types of cutting machines to fabricate sheet metal and manufactured for numerous firms and industries. However, it operated principally as a subcontractor to three customers, with one hard disk device (HDD) producer accounting for over 70 percent of sales. In 1996, Precion extended its capital to ¥20 million, mainly to fund investment in new machinery.Footnote 84 Whereas the sharp economic downturn of 1997 hit the profits of Japan’s SMMs, Precion recovered quickly between 1998 and 2000. Thanks to the growing demand for HDDs, sales revenues reached ¥1 billion.Footnote 85 Although Precion sought greater differentiation in production capabilities, its growing dependence on a single customer locked the firm in as a conventional subcontractor.Footnote 86
First Reconfiguration in 2000
From 2000, Tsuneyoshi Suzuki aimed to be a flexible specialist and to distinguish his production processes.
Since around 1995, a variety of new machines with multiple cutting functions had begun to go on the market.… As we had sought uncertainly for the potential to expand our business, we decided to install the new CNC machines and specialise in the small-batch production of multiple products … [we] developed a bundle of skills and technology to manufacture highly intricate product shapes.Footnote 87
Despite buying new CNC machines, Precion wanted to augment rather than replace existing craft skills. Computer engineers, who could learn their skills in two years, became increasingly available and could not offer sustainable differentiation. In contrast to IMC, the production manager of Precion’s CNC precision lathe department defended the combined instilling and preserving of techniques:
The young engineers lack knowledge on cutting techniques, cutting tools, and the quality of materials. There is an implicit knowledge that engineers can learn only from experience. For example, when an experienced engineer looks at a production plan, he can immediately decide on the manufacturing machine, cutting tools, materials, and programming details.Footnote 88
Precion introduced CAD/CAM as the central operating system for CNC machinery and as the basis of its design skill. However, downstream, the firm relied on the experience of older engineers who implemented defining subtle adjustments in product development and production.Footnote 89
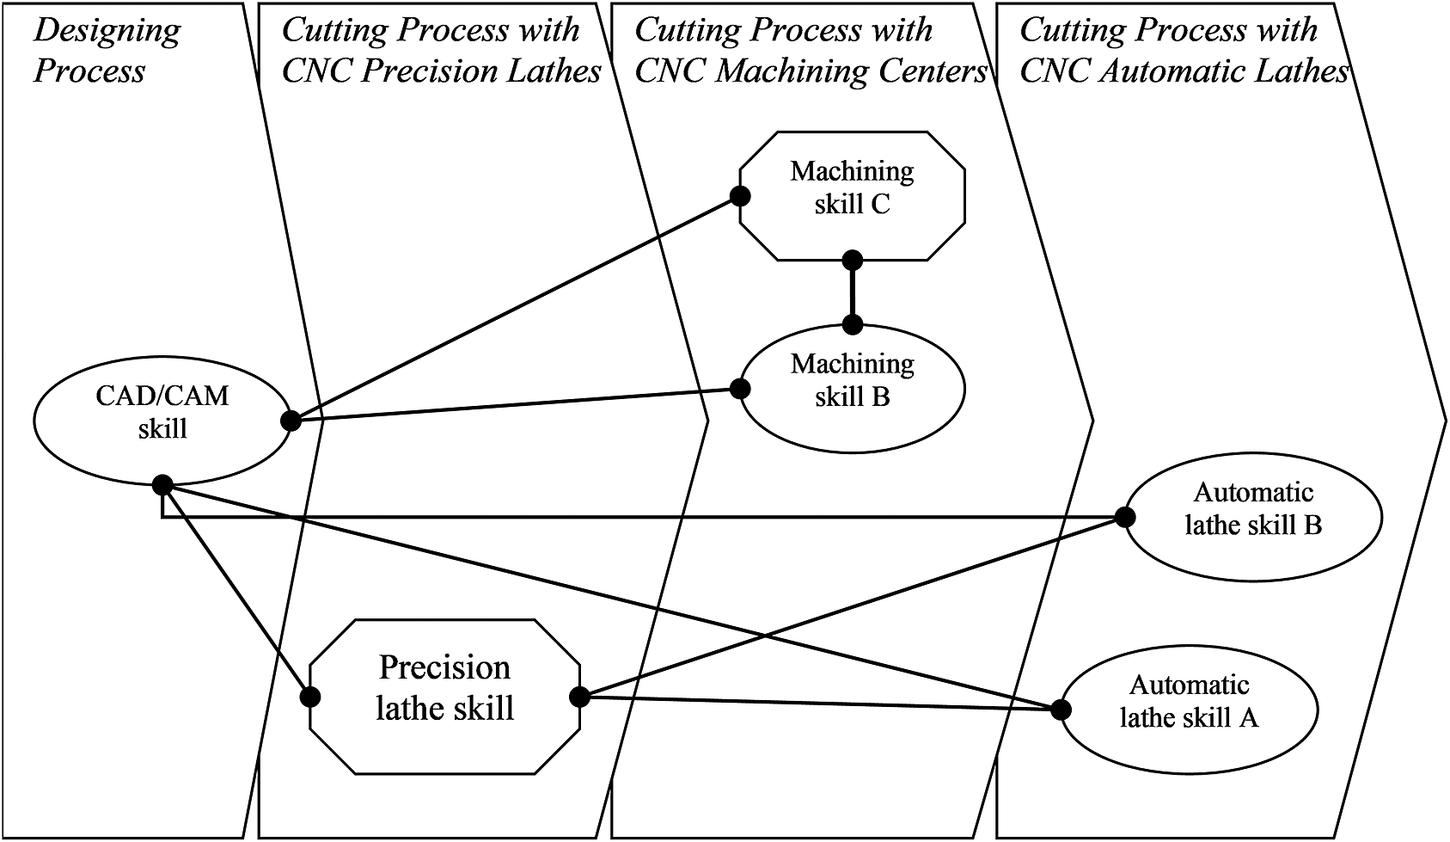
CAD/CAM and computerized machines extended the firm’s range of production processes, and they brought about a reconfigured web of interlocking varied specializations and skills. Two new CNC precision lathes (the Takamatsu X-10 and the T-Wave) supported the manufacture of HDDs, and an automatic loader improved setup times, accuracy, and quality.Footnote 90 The T-Wave could process products within an accuracy of 0.1 microns, while the less accurate X-10 assisted mass production.Footnote 91 A CNC machining center (the A55) became the main cutting equipment for Precion, and the combination of CAD/CAM with the A55 made it “possible to carve complicated shapes out of solid workpieces, so speeding production.”Footnote 92 This “carving-out” technique added production functionality, increased the skills pool, and established a machining center department equal in importance to its lathe counterpart. Production developed a multifunctional approach. The firm invested in “Swiss-type” automatic lathes (the SV-12 and the SR-20R) to introduce greater flexibility and high speed in the machining of sophisticated products, notably medical devices.Footnote 93 Four production stages evolved, beginning with design and moving on to three different cutting pathways. Located in the two lathe departments or the machining department, experienced engineers with CAD/CAM skills undertook product design and used their acquired knowledge to integrate design with production.Footnote 94 While the clear separation of production tasks according to machine types positively influenced efficiency, the integration between processes established flexibility and differentiation (Figure 5).
Comparisons of Figures 4 and 5 illustrate Precion’s transformation, from 2000, and the increasing complexity of its production web. New CAD/CAM skills connected to CNC machinery supported a strategy of design and improvement at each process stage. The firm continued to deepen capabilities in computerized design, until, by 2005, there were eleven engineers with expert, practical, or basic CAD/CAM skills.Footnote 95 The number of engineers using the CNC precision lathes rose from six in 2000 to fourteen by 2005, with expert skills specifically increasing from three to seven; the two basic skills employed for cutting on the CNC multiplefunction machining centers increased to three at expert or practical level, between 2001 and 2005. Importantly, the connectivity between CAD/CAM design and production processes strengthened overall from 2000 onward. Precion simultaneously integrated the two “language” groups engaged on the machining centers and the lathes. It linked conventional machining skills with those on the CNC tools, and interconnected precision lathe techniques with those for automatic lathes. Whereas CNC machines had their own intrinsic advantages, Precion ensured that technological opportunities brought deeper connections with all processes. The firm, once a conventional subcontractor, succeeded in transforming itself into a flexible specialist with a wide range of hard-to-imitate production techniques.Footnote 96 Precion’s operations manager summed up the outcome:
Our knowledge of production technology tends to be much greater than our customers. In other words, they know where to go, but do not know how to get there. So, we can navigate them by telling them about a variety of methods.… Finally, we could join in with the product development processes of our customers from the very beginning.Footnote 97
Precion’s Production and Skills Architecture, 1996-1999
Source: Questionnaires, Precion engineers, 2007 (sample = 21).


Second Reconfiguration in 2001–2005
Precion lost its main customer to bankruptcy in 2001. Suzuki pondered closing the business but decided instead to speed up the production and technological changes already being implemented.
Our overall strategic change had to start with new technological development, leading to the creation of our own unique technology, and finally differentiating our technological strengths from others, by developing original production techniques and methods.Footnote 98
Precion implemented a phased series of changes, between 2001 and 2005, ultimately increasing its capital to ¥30 million. The company renovated its factory and introduced fine-cutting technology and a high-speed machining center.Footnote 99
Precion’s total assets per employee gradually increased, and matched the average of SMMs by 2003.Footnote 100 Figure 6 shows the culmination of changes in production architecture by 2005. The addition of further CNC machines in 2001, when combined with CAD/CAM and other CNC equipment, boosted the integration of computer and longer established skills. Two 5-axis machines, one installed in 2001 and another in 2005, increased the capability to shape complicated geometries. However, as a production manager at Precion pointed out, the core production philosophy remained:
Although machining centers [are] functionally enhanced, and able to carve intricately shaped products through technological developments, the skills to design products and plan production process are still human tasks. Expert engineers can picture production processes in their heads soon after receiving the production plans, immediately choose suitable machines and cutting too

ls, and programme the efficient tool-paths.Footnote 101
The production manager argued that the more technology progressed, the more important it became to match individual engineering expertise with highly sophisticated machines. Specialized skills and knowledge, for carving intricate shapes in small batches with CNC machining centers, bolstered the differentiation strategy. Suzuki regarded overall skill development as a major contributor to the firm’s improved performance between 2001 and 2005, when the operating profit margin grew from 0.1 percent to 8.8 percent.Footnote 102 He commented on the benefits of engineers with differing skills interacting:
I could see the capability of some engineers had been growing. I also recruited some young workers and conducted on-the-job training for them. Over the last five or six years, these young engineers became competent, and the co-operation between younger engineers and the elder workers seems to enhance their skill development process.Footnote 103
When installed in 2004, CNC automatic lathes boosted skills-technology combinations. Compared to precision lathes, they brought both manufacturing speed and functional flexibility to pattern cutting, and their efficient use depended on the experience and planning of engineers.Footnote 104 By recognizing the strengths of conventional machines, Precion gained operational flexibility, the cross-fertilization of techniques, and the creation of unique competencies through the integration of technology and craft skills.
On-the-job rather than formalized training was prevalent within Japanese SMEs, and key skills were commonly experiential and firm specific. Yamawaki, in 2002, and Yamamoto, in 2004, argue that on-the-job training demonstrated the firm-specific nature of skills, and the continued relationship between traditional handcraft techniques and product development.Footnote 105 During 2004, some 27.6 percent of firms claimed that they had maintained skills or redeployed older workers. Only 11.4 percent allocated specific human resources or procedures to training. Because SMEs could not attract young workers willing or able to learn conventional skills, the loss of older employees put valuable competencies and production processes at risk.Footnote 106 With younger engineers preferring technology-related tasks, systemic interactions between different skills became operationally necessary for SMEs to sustain or improve competitive advantage. Precion used the installation of new equipment as an opportunity to increase skills specialization and skills integration. Moreover, while IMC merely transferred submitted data to CNC machines, Precion could, through interactions between engineers, improve the designs provided by customers. Cooperation between “old” and “new” staff and knowledge exchange between departments contributed to production flexibility and product differentiation.
Discussion: Systemizing Resources and Strategic Differentiation
The research, first, evaluates the extent Japanese SMEs could strategically transform their internal resources and capabilities between 1990 and 2008, and successfully convert into flexible specialists. Our account reassesses the economic events that shaped the post-bubble fortunes of SMEs and reveals the influence of changes in technology and production machinery on their strategies. It moves the story of small firms into the critical decade after 1997, filling a gap in our understanding of Japan’s economy. Both case firms aimed to become flexible specialists in response to uncertain market conditions, the decline in relational contracts, the loss of large customers, and falling profitability. Our objective was to identify the critical resources and capabilities of SMEs empirically and in real historical time, setting these businesses and the calculations they made within an evolving and uncertain context. While quoting government reports and national trends, we argue that underlying explanations require insights into firms. Our case studies necessarily concentrated on specific aspects—management decision-making, key personnel, skills, technology, product development processes, production systems—and their contribution to the goal of greater strategic independence. The research clearly uncovers the links between external trends in the economy and in technology, managerial decision-making, and the reorganization of internal processes. The SME Agency reported that, given their long involvement in production pyramids, small firms were, in general, short of the financial resources, market knowledge, and managerial know-how to cope with the crisis.Footnote 107 IMC and Precion proved able to finance new equipment purchases, and they had similar and accurate perceptions of market and technological trends. It was differences in “managerial know-how,” shown in decisions over production systems and product development, that had distinct varied consequences for the two firms. The installation of new computerized equipment by itself ensured neither sustained competitiveness nor successful conversion into flexible specialist. It was, more precisely, the combination of CNC machines with existing assets that brought production flexibility and product differentiation.
Despite losing major customers, IMC and Precion navigated the “lost decades” better than the “average” Japanese SME. Available figures indicate a “hollowing out” of the Japanese SME sector: The number of establishments, some 411,000 in 1992, fell to nearly 355,000 by 1997 and then to 255,000 by 2006; employee numbers, likewise, took a downward trajectory, from 8.0 million to 7.2 million between 1992 and 1997, reaching 5.8 million in 2006.Footnote 108 In 1993, large manufacturers were over 1.9 times more productive measured by value added per employee than their SMM counterparts; by 2006, despite small business closures, the figure was nearly 2.4.Footnote 109 Such trends revealed the strategic realities of the dual structure economy. Large manufacturers continued to benefit from brand recognition, patents, and scale. They gained, importantly, from the falling supply chain costs that, in turn, hurt SME sales, profitability, and capacity to upgrade. IMC and Precion’s performance, as measured by labor productivity and operating profit margins, was higher than the average SME in the difficult decade after 1996. IMC’s labor productivity was above Precion’s in 1998, but tellingly, the position was reversed from 1999 onward (Tables 6 and 7). The SME Agency reported, in 2003, that seven out of ten SMEs had adopted a strategy of differentiating products or services, as exampled through the IMC and Precion cases, and as might be anticipated from the weakening of relational contracting. Differentiators generally secured higher operating profit margins than pursuers of cost-superiority.Footnote 110 The recessionary years of 1998–1999 were noticeably damaging for IMC’s profitability. Following investments in computerized machinery, the firm made gains in 2002–2003, but subsequently, profits fell to a point below those of 1996. Precion’s contrasting long-term upward progress is notable (Table 7). In reacting to declining demand and orders, SMEs had the choice of reducing their workforces, enhancing technology, improving skills, or combining these approaches. Our research attempts to evaluate the major external and internal factors that shaped their decisions and achievements.
IMC and Precion attempted to avoid the fate of “hollowing out” through programs of upgrading. Although IMC did not escape the role of dependent subcontractor, Precion achieved levels of flexibility and specialization. IMC’s strategy ultimately relied on replacing its craft-based skills and older machinery with new technology. In reducing the variedness of its production system, it shrank its functional scope and capabilities. The firm reflected a common contemporary view: that new technology offered a fast remedy to the problem of a suddenly transformed business environment.Footnote 111 However, at the time, automation could not replicate the finer tolerances of craft workers and did not offer the most effective or efficient operational solution for every process or product. IMC’s differentiation and competitive capabilities stalled and declined. Precion combined new technology with craft-based skills and older machinery and, evaluating experientially the advantages and disadvantages of each, built mixed modes of operation. It found ways to utilize, interconnect, and enhance new technology and established skills and processes. From the viewpoint of flexibility and specialization, new technology could augment but not fully replace older techniques and methods.Footnote 112 Precion encouraged traditional craftspeople to learn CAD/CAM and CNC skills, or to cooperate and interact with engineers familiar with newer techniques. Maintaining an evolutionary capability through the interactions of different personnel, skills, and equipment underpinned distinctiveness in production and products.Footnote 113
At Precion, Suzuki was actively interested in recruiting and training. He recognized the ability of expert engineers independently to organize production, evaluate product and production needs, and choose between older and newer techniques or some combination. These processes gave Precion the capability to adapt and incrementally innovate products in collaboration with customers.Footnote 114 The comparison between IMC and Precion is enlightening: They inherited similar operational traditions and production architecture, but their varying approaches, after 1997, had divergent consequences. Both firms proved that they had the capacity, strategically, to transform: In a period of turbulence, they were able to introduce new resources and change their operational architecture. However, only Precion, in creating sustainable competitive-enhancing capabilities, converted from a mainly contracted supplier into a flexible specialist. Unlike IMC, Precion appreciated the need to retain diverse individual skills and equipment and, over time and through experimentation, the contribution they could make to enhancing systemic resources and capabilities. Due to the size, limited resources, and vulnerability of SMEs, an iterative approach that mixed and matched high-tech resources with older craft and machine resources proved effective in Japan during 1990–2008. The approach retained operational complexity, flexibility, and specialization, and developed opportunities for internally generated, differentiated, and hard-to-imitate capabilities. It had the potential to create mindsets and operational routines based on adaptability, and as circumstances changed, it increased the chances of avoiding future obsolescence.Footnote 115 With “mix and match,” differentiation came through the interactions, knowledge exchange, and routines continuously undertaken between owners and engineers, between highly skilled engineers, and between those with craft and new skills. Influencing decisions over operational requirements, and regarding subsequent production and product development reconfigurations, they made strategic differentiation and market repositioning possible.Footnote 116
The analysis reveals that Japanese SMEs could avoid the dangers of hollowing out after 1990, and that we need to consider carefully the relationship between broader contemporary trends, managerial decision-making, internal processes, and sustainable competence enhancement during strategic transformation. We can ask, as a second research aim, if the achievements and failures of Japanese SMEs in this period can offer more general insights or were a product of their time. Our cases highlight how owner-managers were pivotal figures in determining responses to external factors and, crucially, in initiating internal reorganization. It was they who acquired information about market opportunities, production methods, and product ideas, and they were cognizant of rapid changes in the economy, market structure, and technology. In contrast to IMC, the managers at Precion more astutely considered the enduring advantages of existing resources within their firms, the limits of the new technologies, and the importance of systemic differentiating capabilities.Footnote 117 Strategies succeed by retaining a focus on enduring capability development, particularly when under pressure to meet immediate market needs.Footnote 118 Prior experience shaped the attitudes and decision-making of owner-managers.Footnote 119 IMC’s Namiki succeeded his father after working as a product designer at a larger manufacturer; Precion’s Suzuki stayed with the business during his formative years. Through his extended familiarity with his firm, Suzuki favored the retention of existing production processes and working relations. Frustrated with his engineers and their practices, Namiki followed many in the sector by placing his trust heavily in computerized machinery. The separation of design and manufacturing negatively affected IMC’s innovative capability. Its owner did not build on his firm’s firm-specific, tacit knowledge, and ultimately reduced its specialized, inimitable resources.Footnote 120
Both owner-managers shared similar entrepreneurial capabilities in the identification of strategic opportunities: What distinguished the firms were differences in reconfiguring internal resources.Footnote 121 As suggested in the resource-based view, the IMC and Precion cases suggest that it is not the firms’ resources but their organization and systemization that induces long-term competitive differentiation. The impact of computerized production technologies, by themselves, on performance or survivability underlines that point and raises interesting questions about the nature of flexible specialization within SMEs historically and generally. The case studies indicate that SMEs could restructure their combinations of resources and capabilities and could do so during a period of rapid change. They underline Dynamic Capabilities ideas that stress the role of managers and their ability to sense external opportunities and implement strategic renewal.Footnote 122 The importance of interactions between owner-managers and key personnel in enhancing products and production systems is additionally apparent. The organizational processes by which firms synthesize knowledge and equipment created distinctive applications of new and established resources at Precion.Footnote 123 Shared understanding and trusted relationships within the firm, rather than individual efforts, were determinant. Other Dynamic Capabilities viewpoints stress the importance of firms building, integrating, and reconfiguring competencies as the basis of value-creating strategies. Dynamic Capabilities, it has been argued, share significant levels of commonalities, substitutability, or best practice across firms. Competitive advantage, it follows, lies more precisely in the resource configurations created by Dynamic Capabilities, not in the Dynamic Capabilities themselves. It is resources that can be valuable, rare, inimitable, and nonsubstitutable. IMC and Precion provide insights into the origins, characteristics, and significance of these resource configurations. Kathleen Eisenhardt and Jeffrey Martin distinguish between “learning-by-doing,” as in Precion’s iterative change process, and “learning-before-doing,” as exemplified by IMC’s fuller embrace of new technology. Learning and improvising from concrete experience deepens understanding of existing resources and personnel, with frequent, small variations helping managers to reinforce capabilities and ensure sustainability.Footnote 124
Conclusion: Trends in Technology and Skills
Our study adds to our understanding of Japanese business and the wider economy during a critical period of change. Japanese SMEs demonstrated that they possessed and reshaped strategic resources and capabilities in the era of low growth and technological change after 1990, and converted into flexible specialists. The period reveals not only the potential but also the contemporary limits of computerized machines. The analysis points to the influence of factors external to the firm, the contribution of owner-managers, and the determinant role of internal processes in integrating and systemizing resources and capabilities in the creation of sustainable differentiated competitive advantages. These factors enabled SMEs to adjust their market position away from the pyramid of subcontractors dominated by the strategic needs of large firms and toward greater independence.
However, the lessons to be drawn from this period could too easily suggest that craft skills specifically would remain an enduring core competence for SMMs. Later evidence shows that the evolution of CAD/CAM, CNC machinery, and digitalization would surpass the speed and accuracy once held in handcrafts in production and product development.Footnote 125 While the need to assess fully the continuing value of existing resources and skills remained, the balance between integrating or more fully adopting new technologies shifted, as, therefore, did the character of strategic differentiation. The owner-managers active in the 1990s and 2000s handed over control of their firms to a third generation more aware of the hastening speed and advantages of advancing technologies. Young engineers trained only in computerized design and production replaced older colleagues. Firms could no longer depend on the interactions of owner-managers and declining numbers of craft engineers. New business leaders had to interact instead with CAD/CAM-trained personnel if they were to connect externally acquired knowledge with the internal dynamics of product development and differentiation. In any case, for reasons of cost, accuracy, and efficiency, customers would force SMMs to use transferred computerized data, and their suppliers had to reconfigure their developmental and production architecture accordingly. Nonetheless, studies of Japanese SMEs indicate, after the 2008 bank crisis, a continued emphasis on both skills and technology in underpinning production knowledge, product diversity, and competitiveness.Footnote 126 As in the earlier period, changing market and technological contexts required continuing adjustments in systems and strategies that prioritized long-term competitive differentiation over short-term market and technological responses. Within firms, the nature of expertise and internal interactions changed considerably from earlier decades. However, as before, it was the combined maintenance and enhancement of firm-specific expertise and internal interactions that could contribute directly to sustainable competitive distinctiveness.