

Over the past several decades, many behavioural scientists have examined the influence of gender-role dimensions — that is, psychological femininity and psychological masculinity — across a wide variety of contexts. Scholars have, for instance, examined the gender-role dimensions in relation to the workplace (e.g., Jiang, Wang, & Wang Reference Jiang, Wang and Wang2010; Venkatesh, Morris, Sykes, & Ackerman, Reference Venkatesh, Morris, Sykes and Ackerman2004), in academia (e.g., Ames & Kidd, Reference Ames and Kidd1979; Hackett, Reference Hackett1985), and in health-related behaviours (e.g., Reynolds, Fisher, Dyo, Huckabay, & Loucine, Reference Reynolds, Fisher, Dyo and Huckabay2016; Shifren & Bauserman, Reference Shifren and Bauserman1996). This body of literature also illustrates the extensive association of gender-role dimensions in both personal and interpersonal domains, including relationship satisfaction. Since the early 1980s there have been over 50 studies conducted that have examined the association between gender-role dimensions and relationship satisfaction. Surprisingly, there have been no systematic, meta-analytic reviews of this body of literature to better understand the veracity of the reported relationships. Thus, the purpose of the current study is to conduct such a meta-analysis. This can be used to better synthesise a body of literature for researchers and clinicians and can provide implications for how we understand the impact of gender-role dimensions on people's social and interpersonal relationships.
Gender-Role Dimensions
Psychological femininity and psychological masculinity are two gender-role dimensions representing the characteristics that tend to be associated with the behavioural and trait expectations of women and men, respectively, in society (Bem, Reference Bem1974). Femininity is defined as the quality of being expressive, selfless, and interpersonally oriented, and is characterised by traits such as ‘gentle’ and ‘empathy’ (Bem, Reference Bem1974, 1987; Spence, Reference Spence1991, Reference Spence1993; Spence & Helmreich, Reference Spence and Helmreich1980). Masculinity is defined as the quality of being instrumental, agentic, and goal-oriented, and is characterised by traits such as ‘dominance’ and ‘assertiveness’ (Bem, Reference Bem, Shaver and Hendrick1987; Spence, Reference Spence1993; Spence & Helmreich, Reference Spence and Helmreich1980).
Femininity and masculinity were, for many decades, viewed as the opposing end-points of a single dimension of gender-typing such that high levels of masculinity implies low levels of femininity, and vice versa (Constantinople, Reference Constantinople1973; Langis, Sabourin, Lussier, & Mathieu, Reference Langis, Sabourin, Lussier and Mathieu1994). Today, they are considered empirically independent and orthogonal dimensions such that one can score high on both dimensions simultaneously (i.e., psychological androgyny; Bem, Reference Bem1975), score high on one dimension but low on the other, or score low on both (i.e., be undifferentiated, according to Spence, Helmreich, and Stapp, Reference Spence, Helmreich and Stapp1974, Reference Spence, Helmreich and Stapp1975). In other words, men and women can have both psychologically feminine and psychologically masculine attributes.
Psychological femininity has been found to be associated with behaviours such as help-seeking intentions (Shea, Wong, Nguyen, & Baghdasarian, Reference Shea, Wong, Nguyen and Baghdasarian2017), a higher willingness to invest in relationships (Lin & Rusbult, Reference Lin and Rusbult1995), accommodation in relationships (Kilpatrick, Bissonnette, & Rusbult, Reference Kilpatrick, Bissonnette and Rusbult2002; Rusbult, Verette, Whitney, Slovik, & Lipkus, Reference Rusbult, Verette, Whitney, Slovik and Lipkus1991), attempts to improve relationship problems (Rusbult, Zembrodt, & Iwaniszek, Reference Rusbult, Zembrodt and Iwaniszek1986), relationship trust (Lee & Schumann, Reference Lee and Schumann2009), higher levels of religiosity (Francis, Reference Francis2005), and fewer self-destructive behaviours (Tsirigotis, Gruszczynski, & Tsirigotis-Maniecka, Reference Tsirigotis, Gruszczyński and Tsirigotis-Maniecka2014). Previous studies have associated psychological masculinity with self-efficacy (Adams & Sherer, Reference Adams and Sherer1985), self-esteem (Carlson & Steuer, Reference Carlson and Steuer1985), fewer psychological help-seeking behaviours (e.g., Addis & Mahalik, Reference Addis and Mahalik2003; Levant et al., Reference Levant, Stefanov, Rankin, Halter, Mellinger and Williams2013; Yousaf, Popat, & Hunter, Reference Yousaf, Popat and Hunter2015), higher rates of transgressions (Tsirigotis, Reference Tsirigotis2017), higher job and career satisfaction (Ngo, Foley, Ji, & Loi, Reference Ngo, Foley, Ji and Loi2014), and executive functioning (Norvilitis & Reid, Reference Norvilitis and Reid2002). Both psychological femininity and psychological masculinity have also been linked with wellbeing (Helgeson, Reference Helgeson1994). Overall, the literature suggests that psychological femininity tends to be more associated with positive behaviours in interpersonal interactions and greater expressive competence than psychological masculinity.
The most widely used scales to measure gender-role dimensions include the Bem Sex Role Inventory (BSRI; Bem, Reference Bem1974) and the Personal Attributes Questionnaire (PAQ; Helmreich, Spence, & Wilhelm, Reference Helmreich, Spence and Wilhelm1981; Spence & Helmreich, Reference Spence and Helmreich1979; Spence et al., Reference Spence, Helmreich and Stapp1974, Reference Spence, Helmreich and Stapp1975). These scales provide a measure of the extent to which people psychologically identify with stereotypically gendered traits. The BSRI consists of 60 personality trait items and requires respondents to indicate the extent to which the personality trait items are characteristic of them (1 = never like me, 7 = always like me). The BSRI includes three subscales: a 20-item masculine trait subscale, a 20-item feminine trait subscale, and a 20-item neutral trait subscale. The masculine trait subscale is composed of items that are stereotypically associated with men, such as ‘analytical’, ‘competitive’, and ‘assertive’. The feminine traits subscale is composed of 20 items that are stereotypically associated with women, such as ‘gentle’, ‘does not use harsh language’, and ‘affectionate’. The neutral subscale is composed of filler items such as ‘helpful’, ‘happy’, and ‘adaptable’. The responses on items in the masculine and feminine traits subscale are averaged to produce a continuous masculine trait score and a feminine trait score respectively. The combination of masculine and feminine trait scores are used to produce an androgynous trait score.
The PAQ consists of 24 trait dimensions and requires respondents to indicate the extent to which each trait dimension is characteristic of them on a 5-point Likert-type scale (1 = not at all, 5 = very). The PAQ includes three subscales that contain eight items each: a masculinity subscale, a femininity subscale, and a masculine-feminine subscale. The masculinity subscale contains socially desirable traits that are stereotypically more associated with men than women and refer to instrumental qualities, such as ‘standing up well under pressure’, ‘independent’, and ‘never gives up easily’. The femininity subscale contains socially desirable traits that are stereotypically more associated with women than men and refer to expressive qualities, such as ‘able to devote self completely to others’, ‘very helpful to others’, and ‘very warm in relations with others’. The masculinity-femininity subscale contains traits that are associated with androgyny, such as the extent to which one needs security, the extent to which one is excitable in a major crisis, and the extent to which one is passive. Like the BSRI, responses on items in the masculinity and femininity subscales are averaged to produce a continuous masculinity score and a femininity score respectively. Studies have suggested that both the BSRI and PAQ are correlated with each other and are valid measures of the current conceptualisation of psychological femininity and psychological masculinity (Fernandez & Coelleo, Reference Fernández and Coelleo2010; Spence Reference Spence1991).
Relationship Satisfaction
Measures of relationship satisfaction assess the degree to which a romantic relationship meets the expectations, needs, or desires of one or both relationship partners and overall relationship quality. Various scales of relationship satisfaction have been used in previous studies. For instance, the Marital Satisfaction Scale assesses one's general attitudes and level of satisfaction toward his or her own marriage (Roach, Frazier, & Bowden, Reference Roach, Frazier and Bowden1981). The Locke-Wallace Marital Adjustment Test measures general marital satisfaction and quality, agreement and disagreement on several issues (e.g., finances, sex, affection), and relationship style (leisure, outside interests, conflict resolution, confiding; Locke & Wallace, Reference Locke and Wallace1959). The Marital Satisfaction Index measures a broad range of areas of relationship functioning, including global distress, problem-solving communication, affective communication, time spent together, and sexual dissatisfaction (Snyder, Reference Snyder1997).
While these scales provide a measure of relationship satisfaction focused on married couples, other scales measure relationship satisfaction more generally and include items that are broad in scope that allows them to be applied to dating, cohabitating, and married couples. For example, the Relationship Assessment Scale assesses general satisfaction, how well partners meet their partner's needs, how well the relationship compares to others, regrets about the relationship, how well one's expectations have been met, problems in the relationship, and love for one's partner (Hendrick, Reference Hendrick1988; Hendrick, Dicke, & Hendrick, Reference Hendrick, Dicke and Hendrick1998). Dyadic adjustment, measured through the Dyadic Adjustment Scale (Spanier, Reference Spanier1976), has also been used as a measure of relationship satisfaction. Dyadic adjustment is defined as an overall measure of a relationship's functioning and success and includes the concepts of dyadic consensus (the degree to which a couple agrees on matters of importance to the relationship), dyadic cohesion (the degree of closeness and shared activities experienced by the couple), and affectional expression (the degree of demonstrations of affection and sexual relationships), along with dyadic satisfaction (the degree to which the couple is satisfied with their relationship).
Studies have shown that one's relationship satisfaction can have serious implications for one's overall health and quality of life. For example, low levels of relationship satisfaction have been associated with a higher risk of future depression (Dekel et al., Reference Dekel, Vilchinsky, Liberman, Leibowitz, Khaskia and Mosseri2014; Miller et al., Reference Miller, Mason, Canlas, Wang, Nelson and Hart2013), higher levels of stress (Bodenmann, Reference Bodenmann1997), lower sexual satisfaction (Sprecher & Cate, Reference Sprecher, Cate, Harvey, Wenzel and Sprecher2004), lower life satisfaction (Ruvolo, Reference Ruvolo1998), and lower perceived social support (Rochlen, McKelley, Suizzo, & Scaringi, Reference Rochlen, McKelley, Suizzo and Scringi2008). Thus, as lower levels of relationship satisfaction can have potentially detrimental implications on people's lives, it is important to identify traits that are associated with higher levels of relationship satisfaction.
Theoretical Perspectives and Literature Review
There are at least three theoretical perspectives that can be used to make predictions regarding the meta-analytic association between the gender-role dimensions and relationship satisfaction. First, Antill's (Reference Antill1983) empirically based conclusion that happiness (i.e., marital satisfaction) is having a feminine marriage partner suggests that individuals who have partners with high levels of femininity should be happier and more satisfied with their marriages than those who have partners with low levels of femininity. (Note that the partner's level of masculinity is either not addressed, or is regarded as irrelevant in Antill's dictum.) In this model, marital satisfaction should be highest when both partners have high levels of femininity because they are both more likely to be nurturing and supportive of each other, thereby facilitating ‘happiness’ within their marriage and increasing marital satisfaction. Several studies have indeed found actor and partner effects of psychological femininity and relationship satisfaction (Antill, Reference Antill1983; Baucom & Aiken, Reference Baucom and Aiken1984; Bradbury, Campbell, & Finchman, Reference Bradbury, Campbell and Finchman1995; Bradbury & Finchman, Reference Bradbury and Finchman1988; Kurdeck & Schmitt, Reference Kurdek and Schmitt1986; Peterson, Baucom, Elliott, & Farr, Reference Peterson, Baucom, Elliott and Farr1989).
Second, Bem's (Reference Bem1974) theory of psychological androgyny suggests that the most satisfying interactions should occur between partners who are androgynous. If both partners possess a wide range of characteristics that are associated with both femininity and masculinity, they should be more likely to incorporate both positive masculine characteristics and positive feminine characteristics into the various domains of their relationship, thus increasing the likelihood of high levels of relationship satisfaction. Several studies have supported this position and found that relationship partners who are androgynous are better able to develop and maintain satisfying relationships than relationship partners who are feminine, masculine, or undifferentiated (Bender & Newcomb, Reference Bentler and Newcomb1978; Kurdeck & Schmitt, Reference Kurdek and Schmitt1986; Peterson et al., Reference Peterson, Baucom, Elliott and Farr1989; Stephen & Harrison, Reference Stephen and Harrison1985).
Third, research guided by the interpersonal circumplex approach has revealed that people tend to reciprocate their interaction partner's behaviour on the nurturance/warmth dimension (communion/femininity), but to adopt a complementary stance on the dominance/ambition dimension (agency/masculinity; Carson, Reference Carson1969; Horowitz et al., Reference Horowitz, Wilson, Turan, Zolotsev, Constantino and Henderson2006; Kiesler, Reference Kiesler1983; Sadler, Ethier, & Woody, Reference Sadler, Ethier, Woody, Horowitz and Strack2011). Although the second dimension does not perfectly capture what is measured by masculinity, it is at least roughly aligned with masculinity (Leary, Reference Leary1957; Wiggins, Reference Wiggins, Grove and Cicchetti1991). Because the definition of dominance suggests that it cannot be gained by all members of a group or dyad, there is an overall zero-sum principle regarding dominance such that the more dominant one person is within a group, the less dominant the other members of that group must be (Blau, Reference Blau1964; Clark, Reference Clark and Kemper1990; Frank, Reference Frank1985).
Nurturance/warmth (communion/femininity), on the other hand, is generally reciprocated between interaction partners and does not follow a zero-sum rule. The prosocial, friendly, and warm behaviours that are displayed may be interpreted as an invitation to also be prosocial, friendly, and warm in return. Because these behaviours are usually accepted and reciprocated (Horowitz et al., Reference Horowitz, Wilson, Turan, Zolotsev, Constantino and Henderson2006), all involved parties tend to mutually benefit from it (Gintis, Bowles, Boyd, & Fehr, Reference Gintis, Bowles, Boyd and Fehr2003; Trivers, Reference Trivers1971). When these general trends are applied to relationship satisfaction, the presence of feminine behaviour may be reciprocated with feminine behaviour, which may, in turn, promote a close and supportive relationship that leads to greater relationship satisfaction (Ault & Lee, Reference Ault and Lee2016; Gonzaga, Keltner, Londahl, & Smith, Reference Gonzaga, Keltner, Londahl and Smith2001; Gottman & Krokoff, Reference Gottman and Krokoff1989; Janicki, Kamarck, Shiffman, & Gwaltney, Reference Janicki, Kamarck, Shiffman and Gwaltney2006; Smith, Traupman, Uchino, & Berg, Reference Smith, Traupman, Uchino and Berg2010; Smith, Vivian, & O'Leary, Reference Smith, Vivian and O'Leary1990)
Overall, femininity has been consistently and positively associated with relationship satisfaction, with marital satisfaction being the most frequent context of relationship satisfaction studied. Both actor and partner effects have been reported (e.g., Antill, Reference Antill1983; Baucom & Aiken, Reference Baucom and Aiken1984; Bradbury et al., Reference Bradbury, Campbell and Finchman1995; Bradbury & Finchman, Reference Bradbury and Finchman1988; Kurdeck & Schmitt, Reference Kurdek and Schmitt1986; Peterson et al., Reference Peterson, Baucom, Elliott and Farr1989). In other words, higher levels of self-reported femininity have been associated with higher levels of self-reported and partner's relationship satisfaction. The strong and consistent association between femininity and relationship satisfaction has been credited to the very nature of femininity itself. The characteristics that are attributed to femininity are those that tend to influence the quality of a close relationship, such as empathy (Thomas & Reznikoff, Reference Thomas and Reznikoff1984), nurturing behaviours (Bem, Martyna, & Watson, Reference Bem, Martyna and Watson1976), placing importance on marriage and family (Doherty, Reference Doherty1979), and expressive qualities (Kurdek, Reference Kurdek1989). These attributes are inherently promotive of a close and supportive romantic relationship whether they are found in one partner or both.
The association of masculinity with relationship satisfaction, on the other hand, has proven to be variable and generally weak across studies. For example, studies have found strong actor and partner effects between masculinity and marital satisfaction (Cooper, Chassin, & Zeiss, Reference Cooper, Chassin and Zeiss1985; Langis, Mathieu, & Sabourin, Reference Langis, Mathieu and Sabourin1991; Murstein & Williams, Reference Murstein and Williams1983; Zammichieli, Gilroy, & Sherman, Reference Zammichieli, Gilroy and Sherman1988). However, other studies have found weaker actor and partner effects between masculinity and marital satisfaction compared to femininity and marital satisfaction (Baucom & Aiken, Reference Baucom and Aiken1984; Bradbury et al., Reference Bradbury, Campbell and Finchman1995; Peterson et al., Reference Peterson, Baucom, Elliott and Farr1989). Still, other investigators have found evidence of a link between masculinity and marital satisfaction, but only in wives (Baucom & Aiken, Reference Baucom and Aiken1984; Peterson et al., Reference Peterson, Baucom, Elliott and Farr1989).
The Current Study
Given the modest number of relevant studies included in this review, it was not possible to test all of the different predictions addressed in the three theoretical perspectives. However, the goal of this meta-analysis was to present the most comprehensive assessment of the association between the different gender-role dimensions and relationship satisfaction as possible. As such, the safest general prediction was that the relationship between psychological femininity and relationship satisfaction would be the strongest. The current study will only focus on actor correlations (vs. partner correlations; Kenny, Kashy, & Cook, Reference Kenny, Kashy and Cook2006) because too few partner correlations could be obtained. The overarching construct of satisfaction will be referred to as relationship satisfaction for the remainder of this article to encompass the marital satisfaction measures and the relationship satisfaction measures that were included in the current meta-analysis.
There are at least four important reasons for the undertaking of this meta-analysis. First, it can provide an objective summary measure of the relationship between the gender-role dimensions and relationship satisfaction. This is important given that previous studies have reported inconsistent results on this topic (especially regarding the association between masculinity and relationship satisfaction), and there has been no systematic review of this body of literature. Second, this meta-analysis can provide a direct comparison of the overall association between the two gender-role dimensions and relationship satisfaction. Third, given that there has been a relatively sizeable number of studies over the past several decades that have examined the relationship between gender-role dimensions and relationship satisfaction, it would be advantageous to summarise the state of this research topic, such as the number of studies that have been conducted, how researchers have measured and scored the constructs of interest, the availability of published and unpublished data, and others. Last, as mentioned earlier, it is essential to understand the extent to which certain traits can affect relationship satisfaction, due to the potentially damaging effects that low levels of relationship satisfaction can have on people's wellbeing.
Method
Literature Search
First, the online databases PsycINFO, PsycArticles, Google Scholar, and Dissertation Abstracts International were searched for relevant articles using the following keywords: Bem Sex Roles Inventory, BSRI, Personal Attributes Questionnaire, PAQ, agency, communion, androgyny, relationships, sex roles, gender roles, satisfaction, relationship satisfaction, and marital satisfaction. The search for articles took place between April 2016 and December 2016. Second, the available conference programs for the Society for Personality and Social Psychology (SPSP), American Psychological Association (APA), and the Association for Research in Personality (ARP) were searched for relevant data. Third, the references that were cited in all articles that were included in the sample were examined for any additional content. Fourth, a search for any recent citations of the articles included in the current meta-analysis was conducted to find related content that may not have been indexed in the databases. Fifth, calls for unpublished data were posted on the International Association for Relationship Research (IARR) website and on the Society for Personality and Social Psychology's (SPSP) online forum, SPSP Connect!.
Inclusion Criteria
The first criterion for study inclusion concerned whether the gender-role dimensions were measured as continuous or as categorical variables. To be included, the studies must have measured the gender-role dimensions on a continuous scale rather than as categorical classifications. Second, the included studies must have provided the correlations between each gender-role dimension and relationship satisfaction. Third, studies must have used either the Bem Sex Role Inventory (BSRI) or the Personal Attributes Questionnaire (PAQ) to assess levels of psychological femininity and psychological masculinity. As mentioned before, the BSRI and PAQ are the two most commonly used scales in previous research to measure psychological masculinity and femininity. They have been shown to produce substantially similar results and have excellent reliability and validity. Thus, the studies included in the current article were restricted to those that used either instrument to measure psychological masculinity and psychological femininity. No restrictions were placed on the particular scale that was used to assess relationship satisfaction (e.g., Dyadic Adjustment Scale, Marital Adjustment Test, Marital Satisfaction Inventory).
If the initial studies that were collected for the current paper did not meet all inclusion criteria, attempts were made to contact the authors of these studies via email to obtain relevant data for inclusion. Of these initial studies, eight were identified to have measured the gender-role dimensions as continuous scales rather than categorical classifications, but did not report adequate statistics for a correlation coefficient to be calculated. Eighteen studies were identified to have measured the gender-role dimensions as categorical classifications rather than on a continuous scale. The authors of four of these studies responded and indicated that due to the amount of time that had passed since their paper was published, they no longer had access to their data and could not provide any additional information. The remaining authors did not respond. This issue is further discussed in the Discussion section.
Almost all eligible studies reported only the correlation between psychological femininity and relationship satisfaction, and/or between psychological masculinity and relationship satisfaction. There were too few available studies to evaluate the differential effect of psychological androgyny as a predictor. In addition, all eligible studies reported actor correlations, whereas only nine studies reported partner correlations. This is not a sufficient number of studies to adequately evaluate partner correlations. Conducting a meta-analysis on a low number of studies is not recommended, as this can result in substantial errors when estimating between-studies variance and other aspects of the analysis (Borenstein, Hedges, Higgins, & Rothstein, Reference Borenstein, Hedges, Higgins and Rothstein2009). As such, the current article will focus only on the actor correlations of the relationship between psychological femininity and relationship satisfaction, and the actor correlations of the relationship between psychological masculinity and relationship satisfaction.
In all, 43 effect sizes from 26 studies with 7,215 participants were retained to assess the relationship between femininity and relationship satisfaction, and 43 effect sizes from 26 studies with 7,215 participants were retained to assess the relationship between masculinity and relationship satisfaction. Because the current article includes data reported from studies that have already been published, a review protocol was not required.
Coding of Primary Studies
Effect sizes, in the form of correlation coefficients, of the relationship between each gender-role dimension and relationship satisfaction were recorded. When other statistics were reported instead of the correlation coefficient, they were converted into correlation coefficients when appropriate. Studies were also coded for sample size, the demographic makeup of the sample, the chosen measure of gender-role dimensions (i.e., either the BSRI or PAQ), the chosen measure of relationship satisfaction (i.e., the specific scale that was used), whether the sample consisted of participants who were married, cohabitating, or dating, and publication type (published vs. unpublished). Agreement on the coded factors were assessed by the author and a trained research assistant and reached 100% for all coded variables. Table 1 reports the characteristics of all studies included in the current study.
Characteristics and Effect Sizes of Studies Included in Meta-Analyses

Note: BSRI = Bem Sex Role Inventory; PAQ = Personal Attributes Questionnaire; DAS = Dyadic Adjustment Scale; MSI = Marital Satisfaction Inventory; MAT = Marital Adjustment Test; ENRICH = Enriching Relationship Issues, Communication, and Happiness; MRS = Marital Relationship Test; RAS = Relationship Assessment Scale; DMSS = Domains of Marital Satisfaction Scale; RDR = Respondent Dissatisfaction with Relationships; MSS = Marital Satisfaction Scale; X = predictor; Y = outcome; r fem = femininity-relationship satisfaction effect size; r masc = masculinity-relationship satisfaction effect size; m = male f = female. *Study did not report results separately by gender and results were entered for both males and females.
Data Analysis
Because (1) the goal of the current article was to determine the overall effect of the relationship between psychological femininity and relationship satisfaction, and between psychological masculinity and relationship satisfaction; and because (2) psychological femininity and psychological masculinity are considered two independent dimensions (Bem, Reference Bem1974), two separate meta-analyses were conducted. Specifically, the first meta-analysis examined the relationship between psychological femininity and relationship satisfaction, and the second meta-analysis examined the relationship between psychological masculinity and relationship satisfaction.
The two meta-analyses were conducted as multilevel meta-analyses such that the gender-role dimension by relationship satisfaction correlations were treated as a Level 1 variable and the study from which the correlations are drawn from were treated as a Level 2 variable. A multilevel meta-analysis was conducted because almost all of the studies included in the current meta-analyses recruited romantic couples, and thus, the gender-role dimensions by relationship satisfaction correlations of both partners within a couple were represented in the data for this subset of studies. Note that these same studies were characterised by the presence of between-subjects interdependence of relationship satisfaction, such that the relationship satisfaction of one partner could have influenced the relationship satisfaction of the other partner. The multilevel approach to meta-analysis also controls for the presence of this between-partner interdependence and allows for the inclusion of all the available information into the analyses without violating the statistical assumption of independent observations.
The analyses were performed using PROC MIXED in SAS, as consistent with past research (e.g., Podsakoff, Whiting, Welsh, & Mai, Reference Podsakoff, Whiting, Welsh and Mai2013) using the random-effects approach that accounts for both within-study variability and between-study variability (Becker, Reference Becker, Benbow and Lubinski1996; Hedges, Reference Hedges1992). All correlation coefficients were converted to their corresponding Fisher's z score and all data analyses were performed on these z-transformed values. The mean z values were then transformed back into their corresponding correlations for reporting purposes (Borenstein et al., Reference Borenstein, Hedges, Higgins and Rothstein2009). The covariance estimate parameters were estimated using the restricted maximum likelihood approach. Effect sizes were weighted by their inverse variance (Hox, Moerbeek, & van de Schoot, Reference Hox, Moerbeek and van de Schoot2010) and corrected for the estimated degree of unreliability of the specific gender-role dimension measure and relationship satisfaction measure (Hunter & Schmidt, Reference Hunter and Schmidt2004). Consistent with relevant past meta-analyses, the average of the available gender-role dimension reliabilities or the available satisfaction reliabilities was used when a given gender-role dimension or relationship satisfaction reliability estimate was missing (e.g., Grijalva & Zhang, Reference Grijalva and Zhang2016).
To estimate the overall effect sizes, an unconditional multilevel meta-analysis (i.e., without any predictors) must first be tested to examine the systematic differences between studies (model 1). If there are no systematic differences between studies (i.e., if there is no evidence of between-study heterogeneity), this indicates that any observed difference in effect sizes is due to sampling error alone and no further analyses are required (Rosenthal, Hoyt, Ferrin, Miller, & Cohen, Reference Rosenthal, Hoyt, Ferrin, Miller and Cohen2006). However, if there are systematic differences between studies (i.e., if there is evidence of between-study heterogeneity), this indicates that additional analyses should be conducted to identify the variables that are affecting the strength of the relationship between the predictor variable and the dependent variable (Baron & Kenny, Reference Baron and Kenny1986). Thus, for each multilevel meta-analysis, the unconditional model for effect sizes was estimated, along with the goodness-of-fit statistics for all models (Table 2 reports all fit statistics). If the presence of between-study heterogeneity was detected, additional analyses were tested to determine if certain variables influenced the relationship between the gender-role dimension and relationship satisfaction.
Goodness-of-Fit Statistics for Femininity-Relationship Satisfaction and Masculinity-Relationship Satisfaction Multilevel Meta-Analyses

Note: −2 Res LL = −2 Residual Log Likelihood; AIC = Akaike information criterion; AICc = Akaike information criterion corrected for small sample sizes; BIC = Bayesian information criterion. Model 1 = unconditional model. Model 2 = Ratio of men as moderator.
Sex/Gender as a Potential Moderator
Individuals’ levels of psychological masculinity and psychological femininity may predictably vary, based on sex/gender. Because psychological masculinity and psychological femininity represent the traits that tend to be associated with men and women (Bem, Reference Bem1974), it can be expected that, generally, women tend to report more feminine traits compared to men, and that men tend to report more masculine traits compared to women. Due to these sex/gender differences across the gender-role dimensions, sex/gender was tested as a moderator, which was represented as the ratio of menFootnote 1 associated with each effect size. Because the studies in the current sample varied in their assessment of participant sex (i.e., male, female) or gender (i.e., men, women), and insufficient samples exist with participants who do not identify on the sex/gender binary (e.g., transgender, intersex), the current study uses sex/gender to discuss men and women, although both the conceptual overlap and distinctions of these terms are recognised.
Using sex/gender as a continuous moderator had several advantages over alternative coding schemes such as dummy coding. Most of the studies that recruited couples reported the correlation between a given gender-role dimension and relationship satisfaction for men and women separately. However, several studies in the sample only reported the average dyadic correlation (i.e., averaging the dyadic correlations of all couples together to report one overall dyadic effect size for each gender-role dimension), or only reported the average individual correlation (i.e., averaging the correlations across all participants to report one overall individual effect size for each gender-role dimension). Thus, using the ratio of men associated with each effect size would account for the mixed-sex/gender effect sizes. The ratio of men was centred by subtracting .50 from each value (Hox et al., Reference Hox, Moerbeek and van de Schoot2010).
Results
Femininity and Relationship Satisfaction
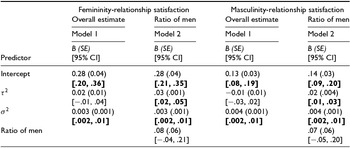
A total of 43 effect sizes (level 1) from 26 studies (level 2) was available for this analysis (Table 3). The intercept of the baseline model (i.e., the unconditional model; model 1) is equivalent to the correlation coefficient and is considered the overall effect size of the relationship between femininity and relationship satisfaction. After converting the unstandardised regression coefficient of the intercept back into the form of a correlation coefficient, the overall effect size was r = .28 and was significantly different from zero. This finding suggests that there is an overall medium-sized relationship between femininity and overall relationship satisfaction. As shown in Table 3, the variability of effect sizes between studies (τ2), as indicated by 95% confidence intervals, was not significantly different from zero, indicating that the effect sizes between studies were homogeneous. The ratio of men did not emerge as a significant moderator of the relationship between femininity and relationship satisfaction (Table 3, model 2).
Summary of Multilevel Meta-Analyses

Note: B = unstandardised regression coefficient. SE = standard error of the regression coefficient; 95% CI = 95% confidence interval; p = exact p value; τ2 = intercept variance across groups; σ2 = within-group, individual-level variance. Bolded 95% confidence intervals are significant.
Masculinity and Relationship Satisfaction
A total of 43 effect sizes (level 1) from 26 studies (level 2) was available for this analysis (Table 3). Again, model 1 served as the baseline model and provided the overall effect size of the relationship between masculinity and relationship satisfaction. The overall effect size was small (r = .13) and was significantly different from zero. The variability of effect sizes between studies was not significantly different from zero, which indicated that the effect sizes between studies were homogeneous. Again, the ratio of men did not emerge as a significant moderator of the relationship between masculinity and relationship satisfaction (Table 3, model 2).
Publication Bias
Funnel plots were created to assess the presence of potential publication bias in both meta-analyses (Figure 1). A symmetrical distribution of the effect sizes around the horizontal summary effect lines would indicate the absence of publication bias whereas an asymmetrical distribution of effect sizes would indicate the presence of publication bias. For the psychological femininity-relationship satisfaction meta-analysis, the distribution of the effect sizes appeared somewhat symmetrical, suggesting an absence of bias in the data. Egger's linear regression method (Egger, Smith, Schneider, & Minder, Reference Egger, Smith, Schneider and Minder1997) was conducted to quantify the bias that may be depicted by the funnel plot. The results suggested an absence of publication bias in the data, t = −1.77, df = 41, p = .08. For the psychological masculinity-relationship satisfaction meta-analysis, the distribution of the effect sizes appeared somewhat symmetrical, also suggesting an absence of bias in the data. The results of Egger's test supported this conclusion, t = −.40, df = 41, p = .69.
Funnel plot of both meta-analyses. The femininity-relationship satisfaction effect sizes graphed on the y-axis and sample size graphed on x-axis (top) and masculinity-relationship satisfaction effect sizes graphed on the y-axis and standard error graphed on the x-axis (bottom). Horizontal lines represent the mean effect sizes with slanted lines represent the 95% confidence intervals.

Discussion
The current meta-analyses assessed the overall strength of the relationship between gender-role dimensions (i.e., psychological femininity and psychological masculinity) and relationship satisfaction. Two meta-analyses were conducted: first, 43 correlations from 26 studies were aggregated using multilevel meta-analytic techniques and revealed a medium, significant relationship between psychological femininity and relationship satisfaction. Second, 43 effect sizes from 26 studies were aggregated using multilevel meta-analytic techniques and revealed a small, significant relationship between psychological masculinity and relationship satisfaction. The results confirmed the hypothesis that psychological femininity would reveal a stronger association with relationship satisfaction than psychological masculinity. Sex/gender did not emerge as a significant moderator in either meta-analysis.
These results indicate that the characteristics associated with femininity, such as expressiveness, empathy, and nurturance, tend to facilitate the development of close and supportive relationships. When individuals have high levels of feminine characteristics, they are more likely to be nurturing and supportive, which can lead to higher levels of satisfaction within their relationships. On the other hand, the qualities associated with masculinity are more weakly associated with relationship satisfaction. However, this does not necessarily mean that all masculine characteristics have a weak association with relationship satisfaction. For instance, some studies have found stronger associations between being self-reliant (Bolvardi, Damavandian, & Talebi, Reference Bolvardi, Damavandian and Talebi2015) and independent (Fan & Lui, Reference Fan and Lui2004) with relationship satisfaction, even though these traits are associated with psychological masculinity. It is also possible that the psychologically masculine characteristics that contributed to higher relationship satisfaction might have been cancelled out by other psychologically masculine characteristics that contributed to lower relationship satisfaction, such as being aggressive (e.g., Bradbury, Fincham, & Beach, Reference Bradbury, Fincham and Beach2000; Lawrence & Bradbury, Reference Lawrence and Bradbury2007), ambitious (e.g., Hinde, Reference Hinde1997), and forceful (e.g., O'Donohue & Crouch, Reference O'Donohue and Crouch1996). This may have resulted in the small effect size of the overall relationship between psychological masculinity and relationship satisfaction. Exploring this suspicion would require researchers to examine the association between relationship satisfaction and the traits associated with psychological masculinity individually, rather than as an aggregate measure of psychological masculinity.
Did the overall relationship between the two gender-role dimensions and relationship satisfaction vary with other study characteristics? There was not a presence of between-study heterogeneity of effect sizes in either meta-analysis, and any presence of variability was due to sampling error only. Sex/gender was also not a significant moderator in either meta-analysis. This result, in particular, has at least two important implications. First, it suggests that the association between psychological femininity and relationship satisfaction, as well as the association between psychological masculinity and relationship satisfaction, did not depend on whether the individual was a man or a woman. In other words, for both men and women, having traits that are associated with psychological femininity seemed to be more strongly related to relationship satisfaction than traits that are associated with psychological masculinity. It also suggests that both men and women may report similar levels of relationship satisfaction based on their self-reported levels of psychological femininity and psychological masculinity. That is, both men and women who report higher levels of psychological femininity also report higher levels of relationship satisfaction than men and women who report lower levels of psychological femininity; further, both men and women who report higher levels of psychological masculinity also report lower levels of relationship satisfaction than men and women who report higher levels of psychological femininity. These implications highlight the similarities, rather than differences, between men and women regarding their self-reported gender-role dimensions and how it relates to their reflection of interpersonal processes and adjustment with their partner.
Limitations and Future Research
The current study can make assertions regarding the magnitude of the association between the gender-role dimensions and relationship satisfaction, but it cannot make assertions regarding the directionality of this association. In other words, do individuals with psychologically feminine personality characteristics have greater relationship satisfaction? Or, does having greater relationship satisfaction lead individuals to adopt more psychologically feminine characteristics? It is suspected that the former is likely more tenable than the latter — however, there is some evidence that the traits associated with gender-role dimensions may change based on different situations (Abrahams, Feldman, & Nash, Reference Abrahams, Feldman and Nash1978). Thus, future research should conduct longitudinal studies to examine the directionality of this relationship.
As mentioned earlier, authors of a given study were contacted if their study did not report adequate statistics for inclusion in the current meta-analyses. Some of the authors had indicated that they no longer had access to their data and could not provide any additional information for inclusion in the current meta-analyses. This was because their respective studies were conducted a few decades ago and the technology that was used to store data at that time is now outdated and no longer in use. This raises an important issue regarding the accessibility of data from previous research over time. Moving forward, researchers should develop a method to store data in a way that will allow future researchers to access it regardless of how much technology has changed and how much time has passed.
Similarly, future researchers should provide a more complete summary of their results when assessing the relationship between gender-role dimensions and relationship satisfaction. At minimum, a correlation matrix of all variables within a given study should be provided in all future scholarly empirical articles. This practice will permit future researchers to easily obtain the appropriate statistics for meta-analytic purposes, and will also facilitate more thorough assessments of these empirical studies in general.
Lastly, the body of literature that investigates the relationship between gender-role dimensions and satisfaction largely focuses on either relationship satisfaction or marital satisfaction. Other types of satisfaction, such as friendship satisfaction, were quite unrepresented compared to relationship/marital satisfaction. Future studies should address this limitation by investigating the relationship between gender-role dimensions and a wider variety of relationship satisfaction types, such as satisfaction between coworkers, family members, or mentor/mentees. Doing so will determine whether the gender-role dimensions have the same effect on different types of relationship satisfaction (i.e., is psychological femininity also associated with higher relationship satisfaction between coworkers, family members, mentors/mentees, and other types of relationships? Does the magnitude of this relationship differ by relationship type?). This will also provide a more complete assessment of the gender-role dimensions’ influence in close relationships in general.
Conclusion
In conclusion, the current study systematically reviewed the literature assessing the relationship between gender-role dimensions and relationship satisfaction and found a stronger meta-analytic effect size for the relationship between psychological femininity and relationship satisfaction than the relationship between psychological masculinity and relationship satisfaction. In other words, individuals who exhibit qualities associated with psychological femininity tend to report higher relationship satisfaction than those who do not exhibit qualities associated with psychological femininity or those who exhibit qualities associated with psychological masculinity. The overall relationship between the two gender-role dimensions and relationship satisfaction did not vary by other study characteristics. Finally, the current study discusses the implications of these results and provides recommendations for future studies assessing the relationship between gender-role dimensions and relationship satisfaction.
Acknowledgments
The author would like to thank William Ickes, Justin R. Garcia, Gregory D. Webster, Jared Kenworthy, Angela Liegey-Dougall, and reviewers for their input and assistance on this paper.
Financial Support
This research received no specific grant from any funding agency, commercial or not-for-profit sectors.
Conflict of Interest
None.
Ethical Standards
The author asserts that all procedures contributing to this work comply with the ethical standards of the relevant national and institutional committees on human experimentation and with the Helsinki Declaration of 1975, as revised in 2008.